all transients in sector25 (57 total)
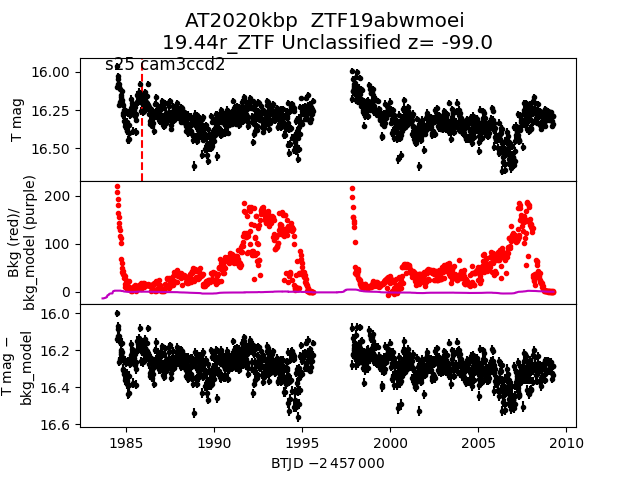
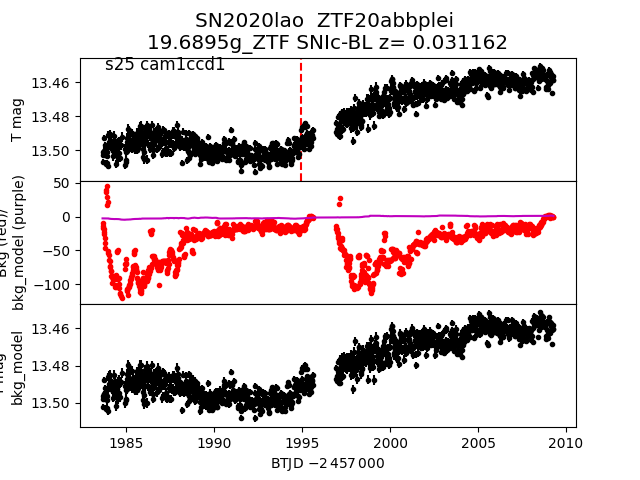
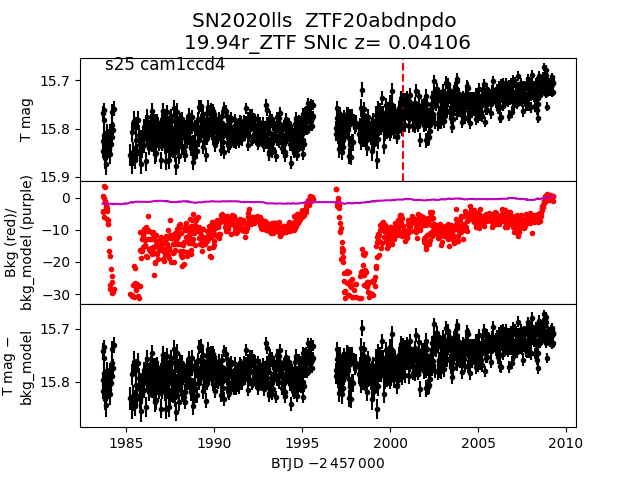
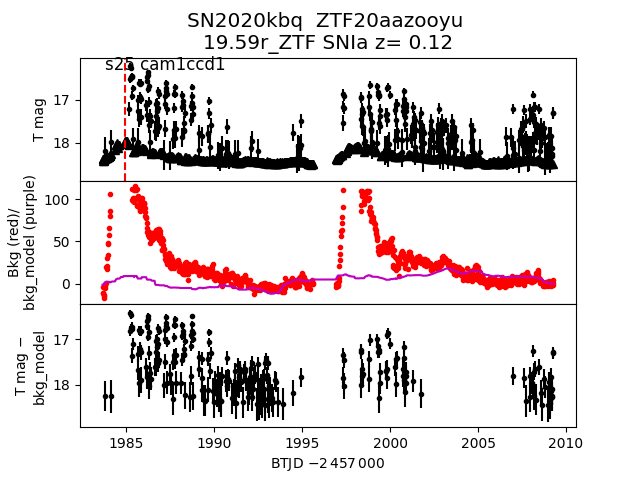
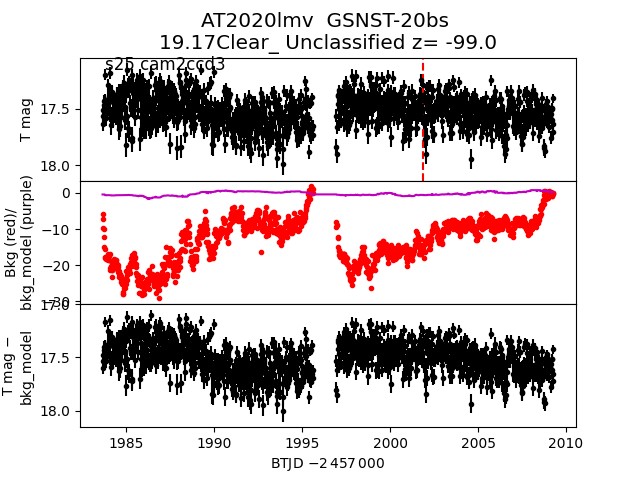
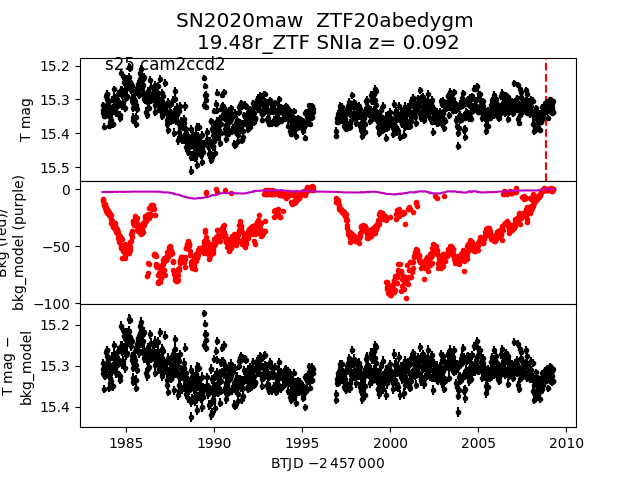
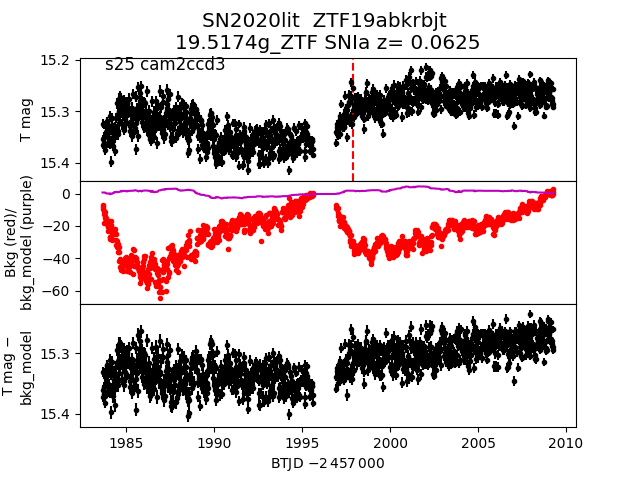
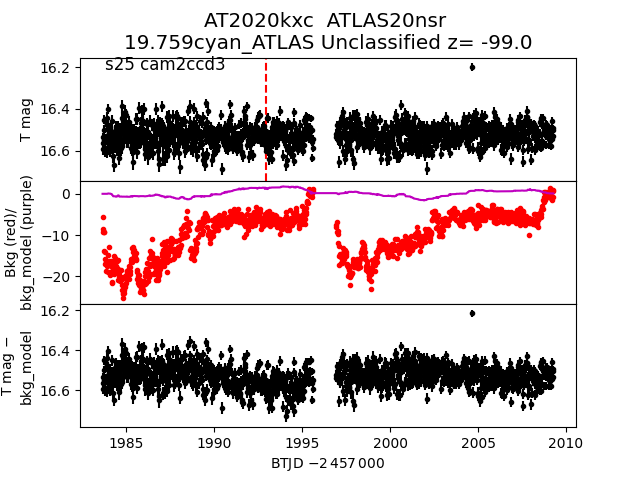
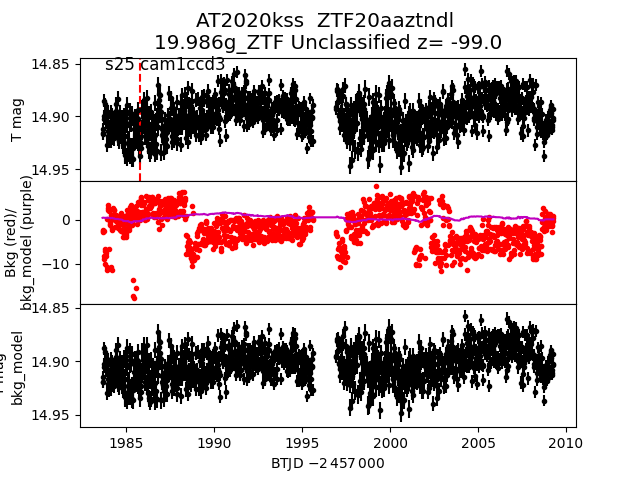
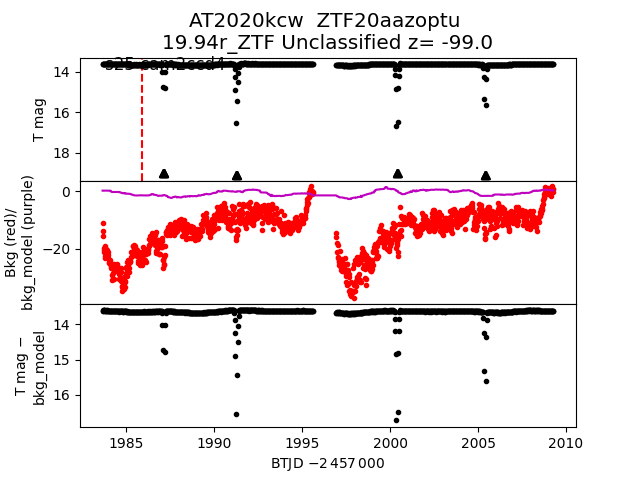
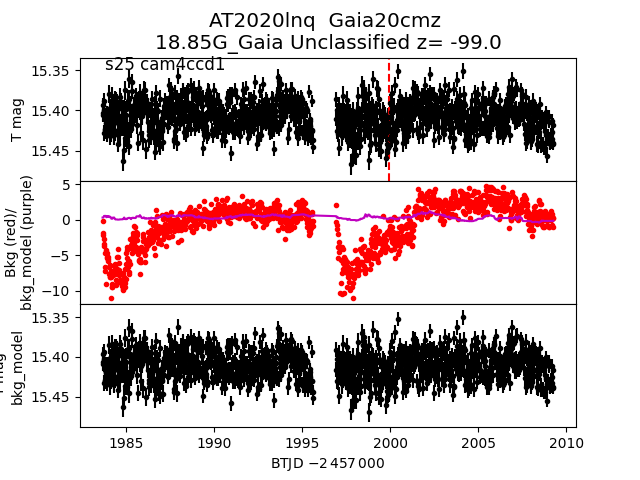
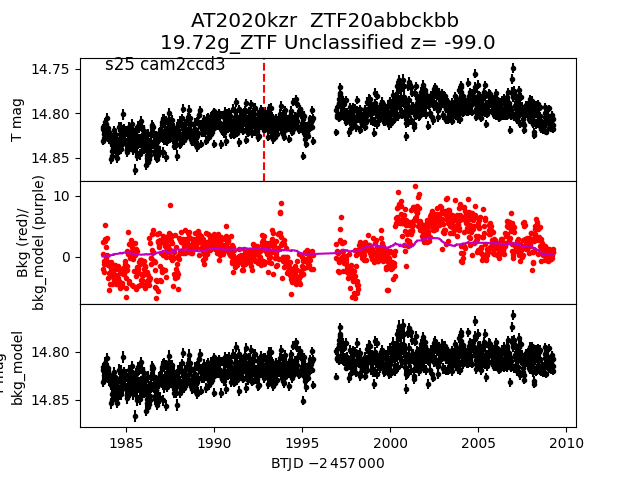
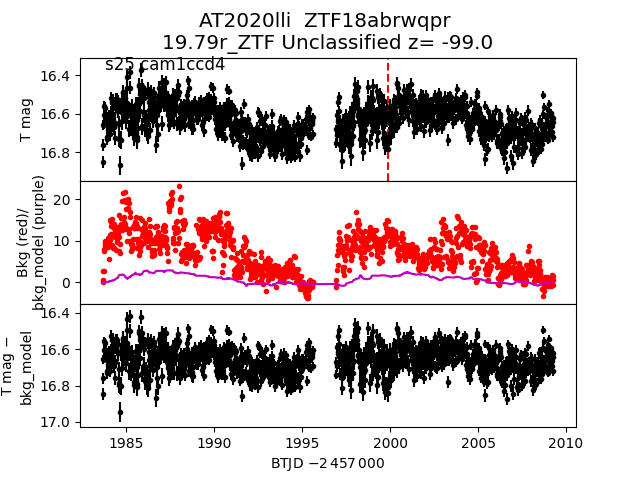
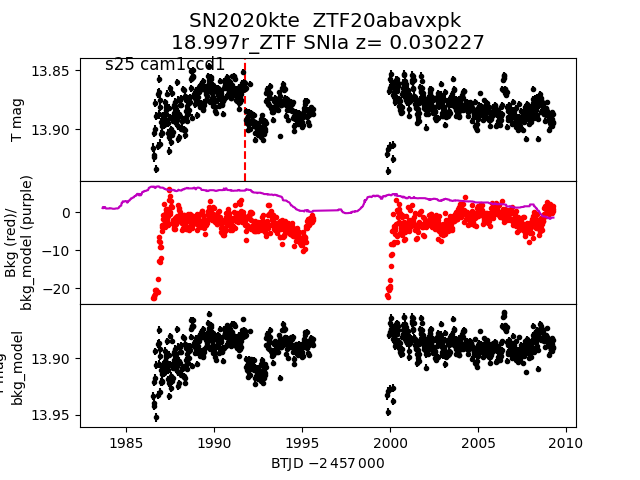
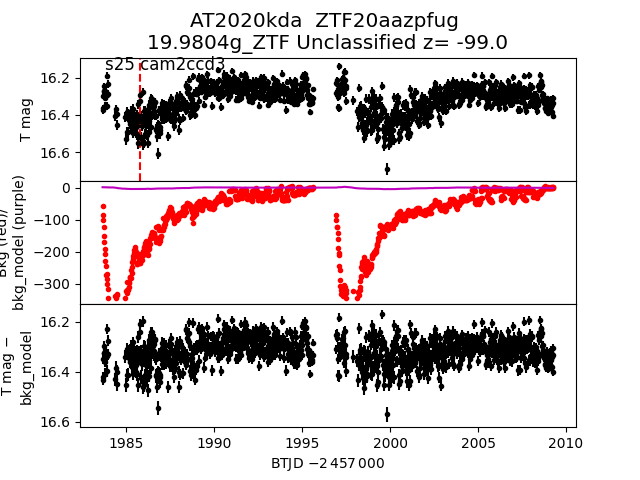
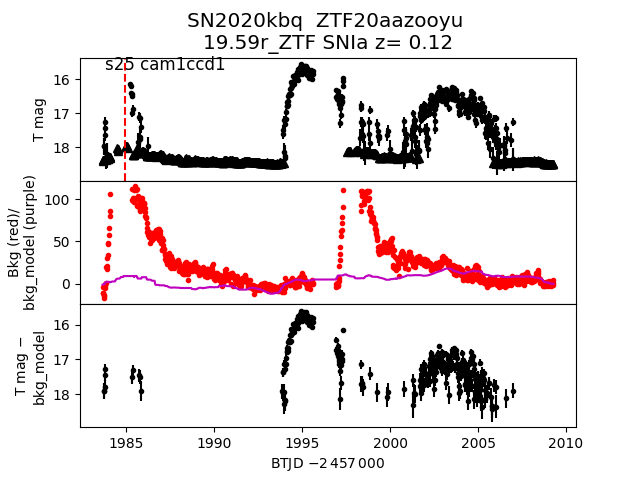
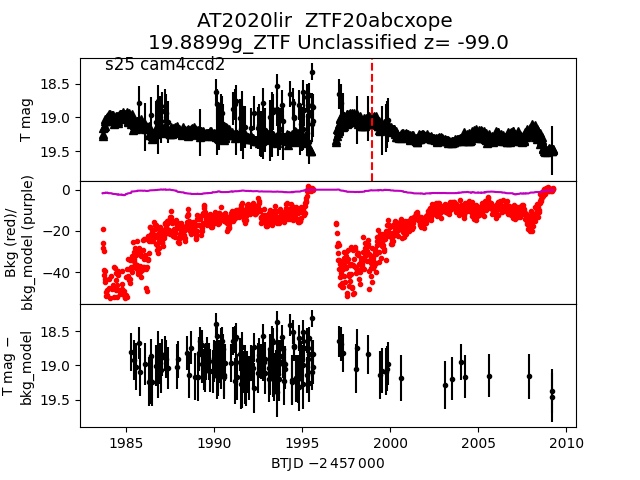
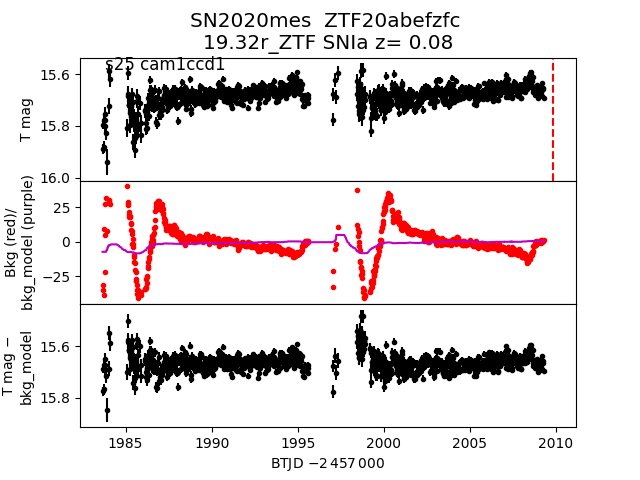
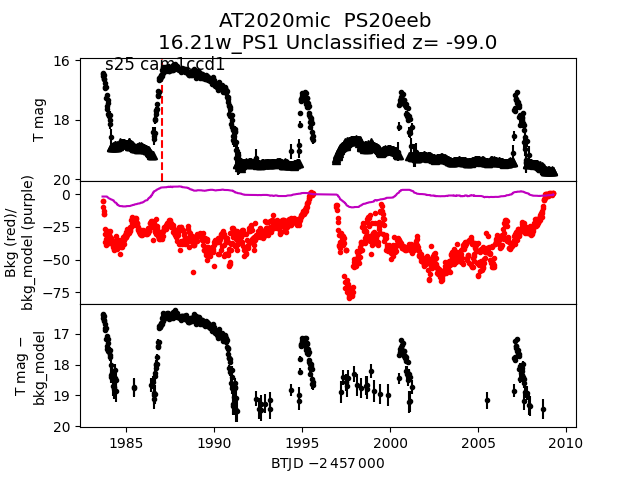
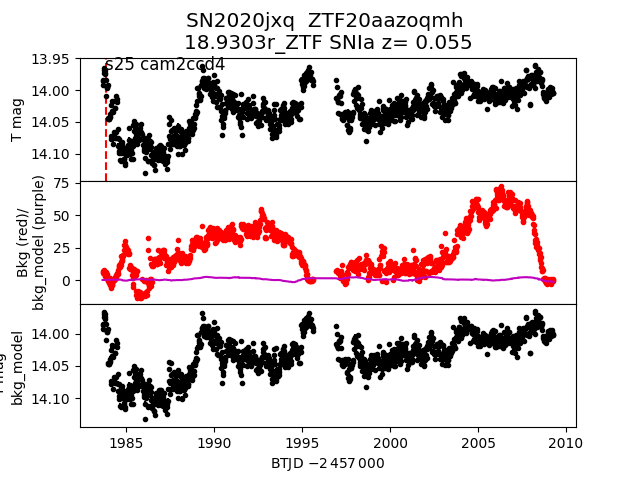
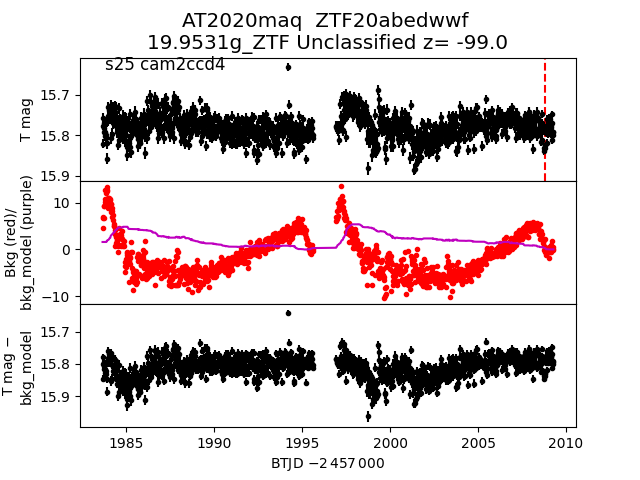
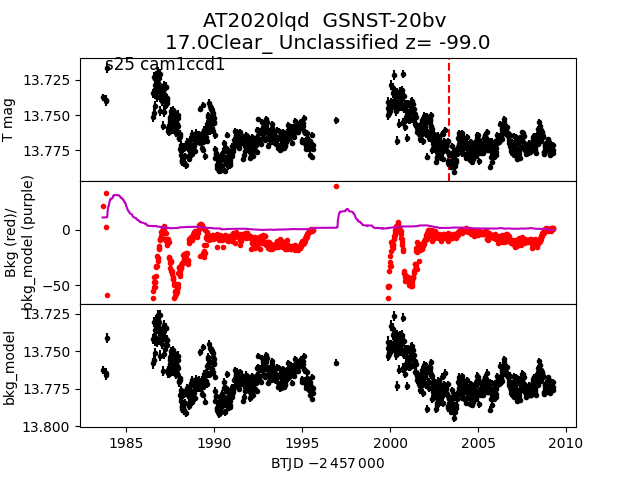
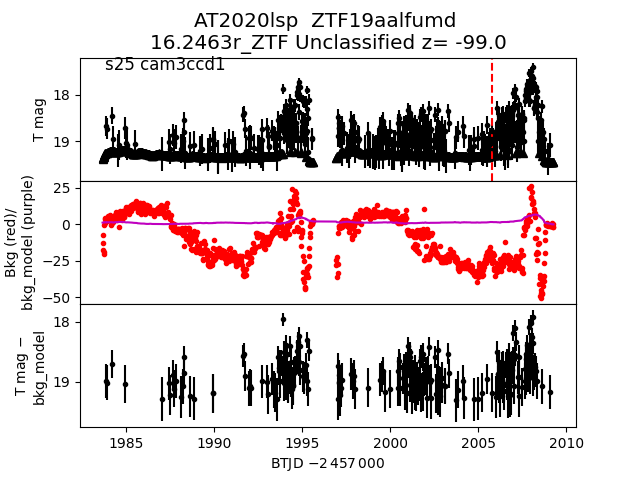
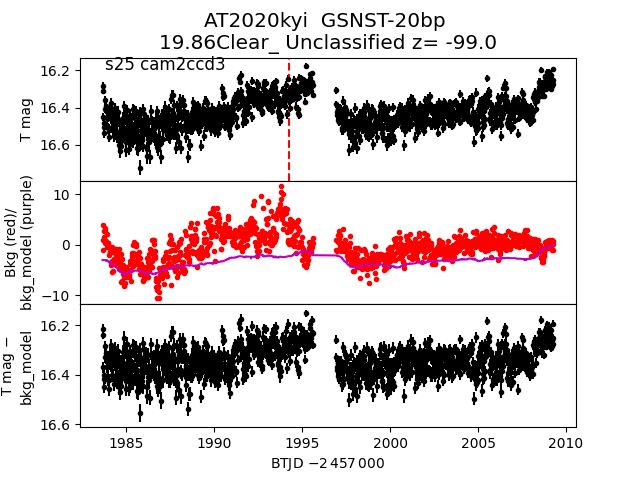
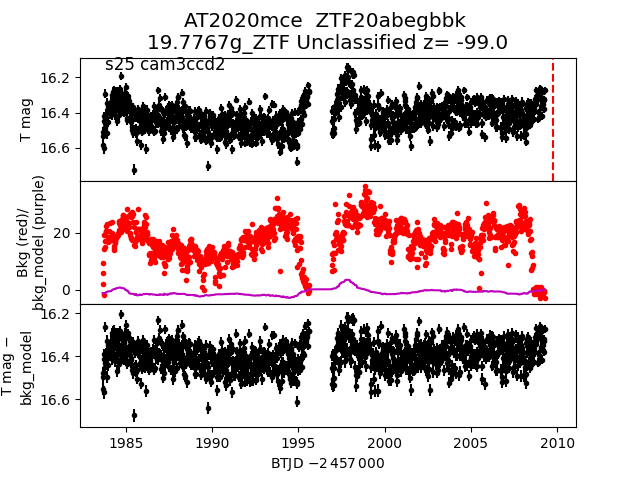
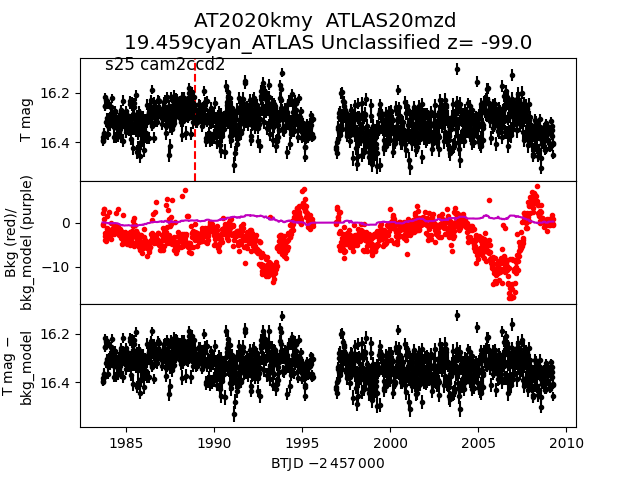
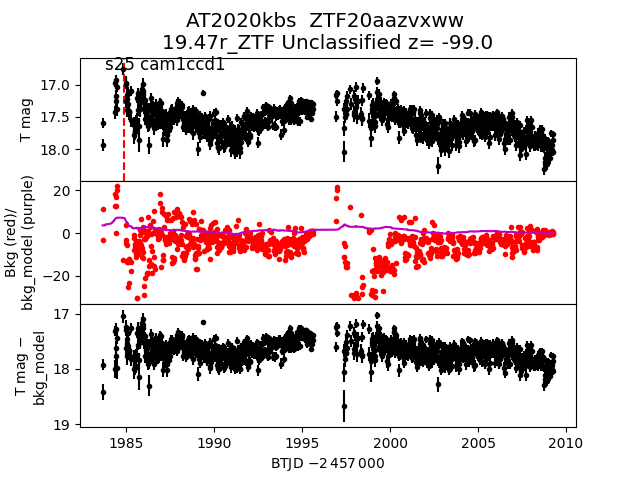
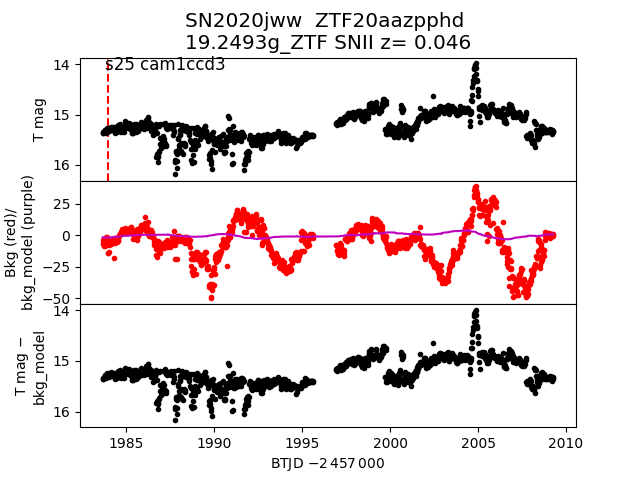
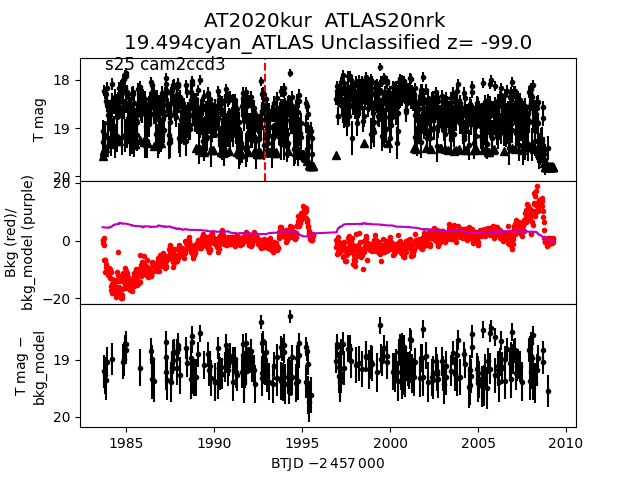
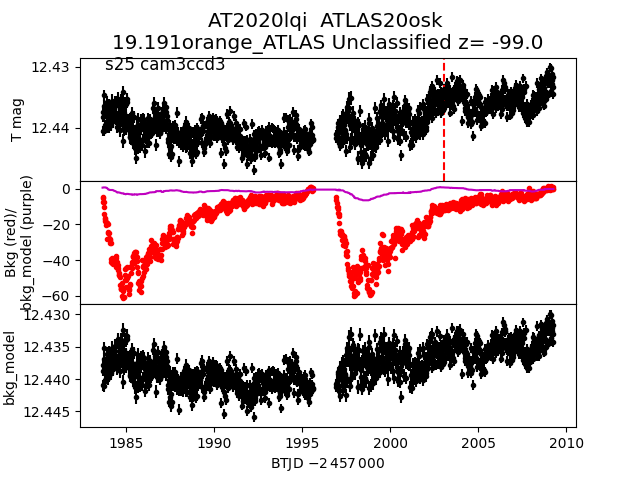
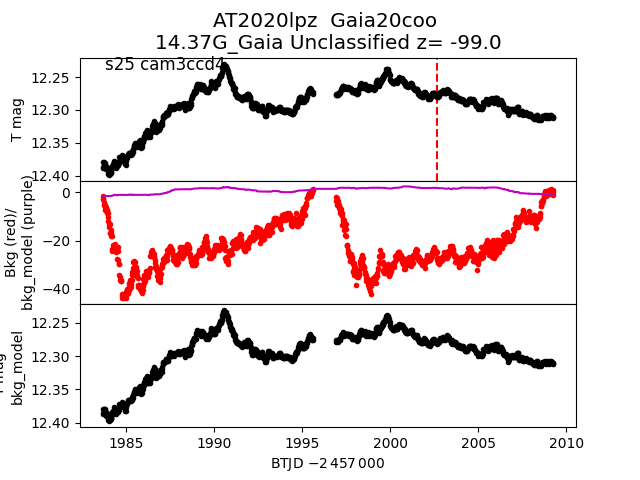
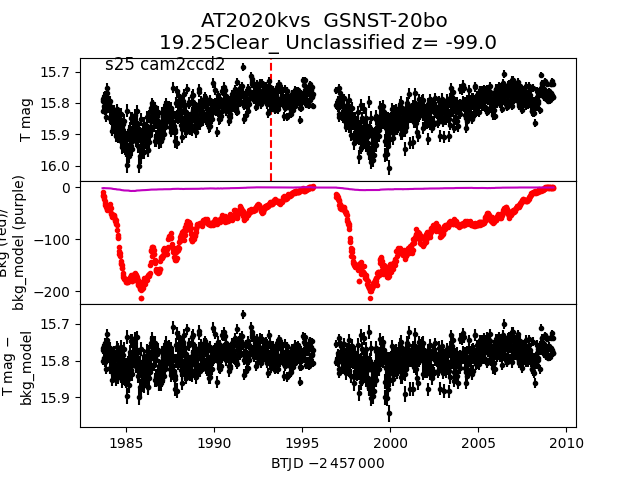
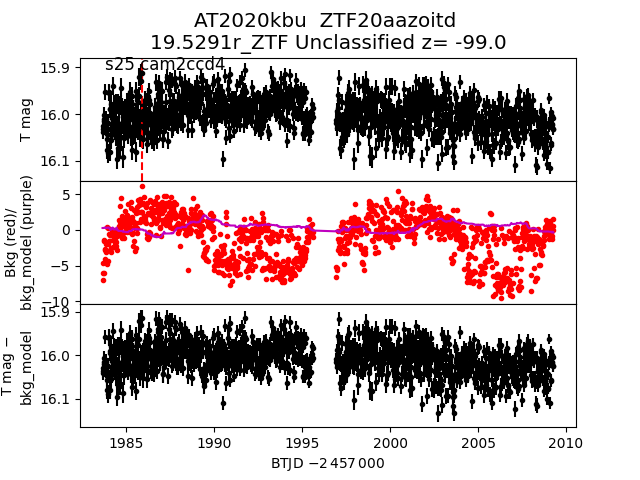
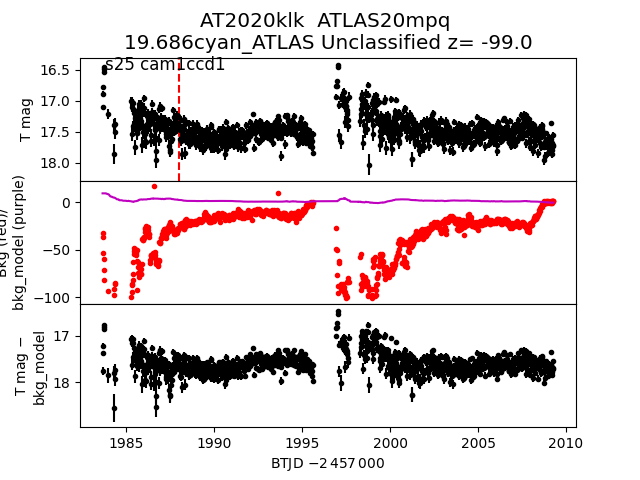
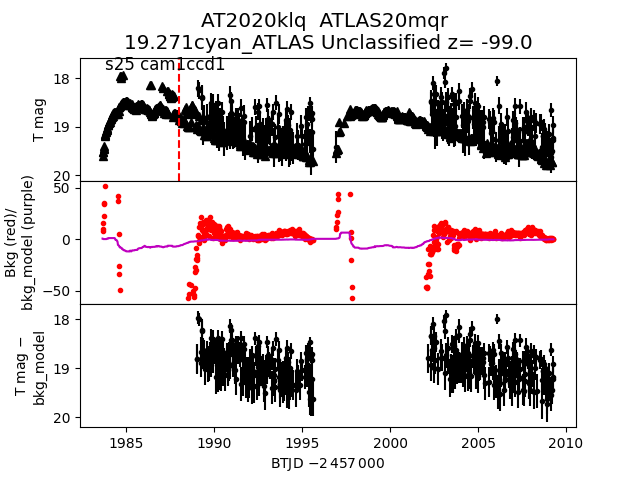
Each figure has three panels. The top panel shows the transient light curve, the middle panel shows the local background (estimated in an annulus), and the bottom panel shows a "background-model corrected" light curve. Details about the background model are in the README.
The vertical red line marks the time of discovery reported to TNS. Other useful metadata from TNS is in the figure title.
Note that the top and bottom panel are in magnitudes, while the middle panel is in differential flux units. The magnitudes are calibrated to the flux in the reference image used for image subtraction. Thus, flux from the host galaxy is included in these magnitudes.
3-sigma upper limits are plotted as triangles with no errorbars. A typical limiting magnitude is 19.6 in 30 minutes or 18.4 in 200 seconds (for low backgrounds).
The links allow you to download the light curve data as a text file.
More details in the README.
2020lao
 2020lls
 2020kbq_detrended
 2020lmv
 2020maw
 2020lit
 2020kxc
 2020kss
 2020kcw
 2020lnq
 2020kzr
 2020lli
 2020kte
 2020kda
 2020kbq
 2020lir
 2020mes
 2020mic
 2020jxq
 2020maq
 2020lqd
 2020lsp
 2020kyi
 2020mce
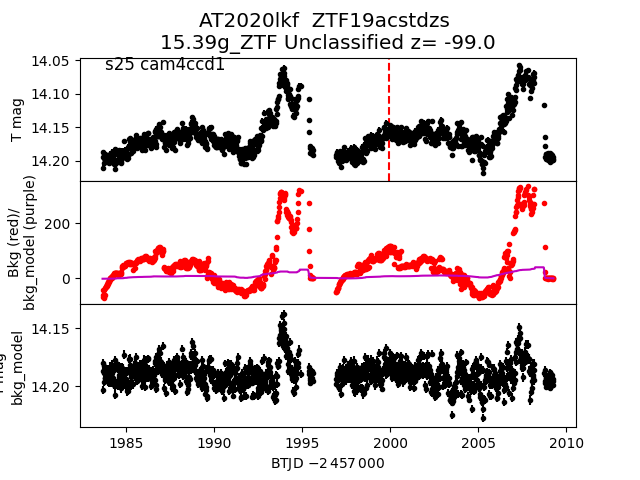
 2020lkf
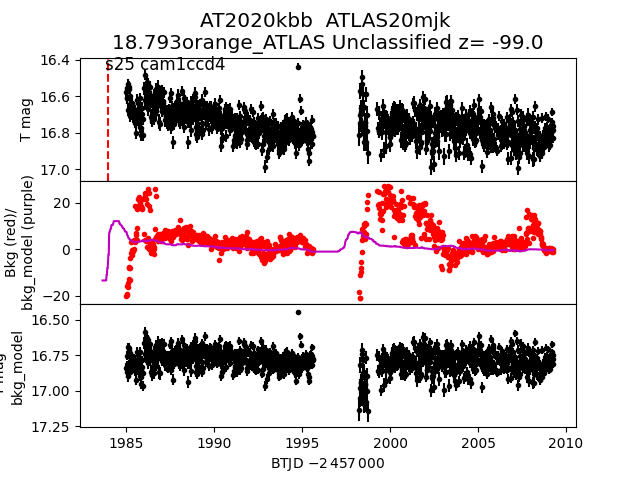
 2020kbb
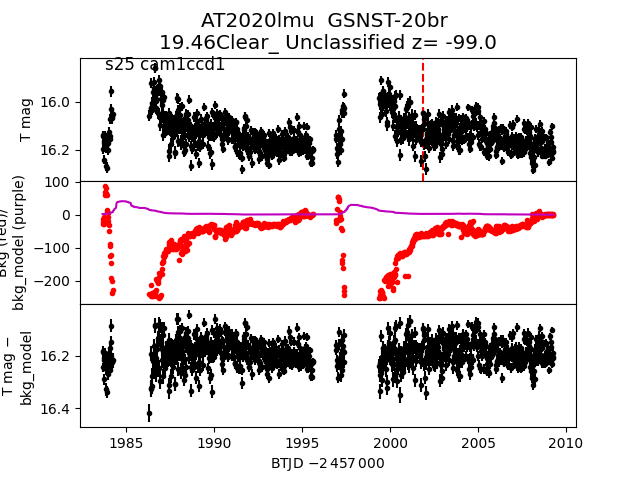
 2020lmu
 2020kmy
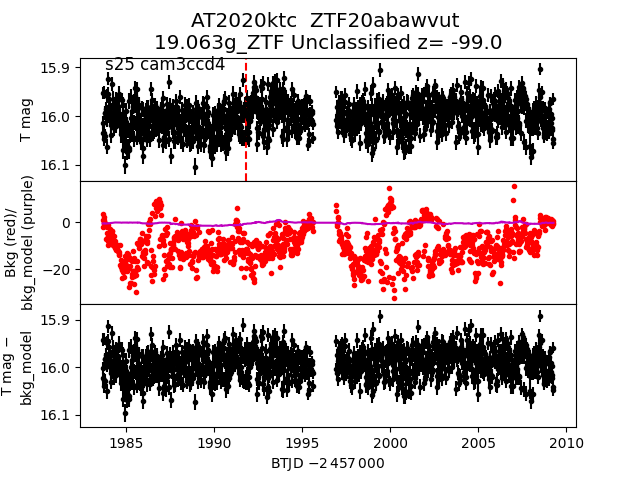
 2020ktc
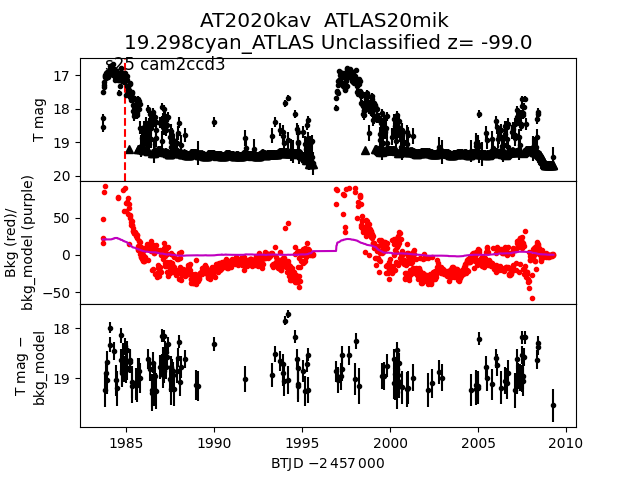
 2020kav
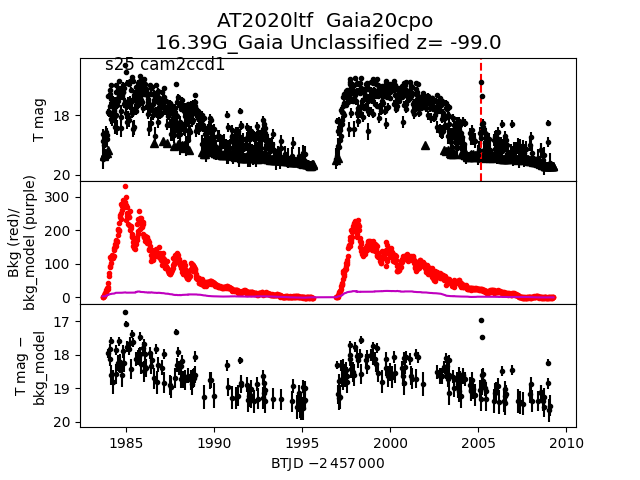
 2020ltf
 2020kbs
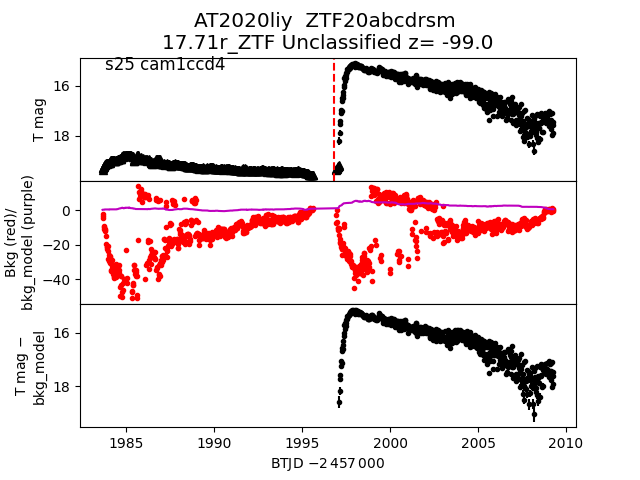
 2020liy
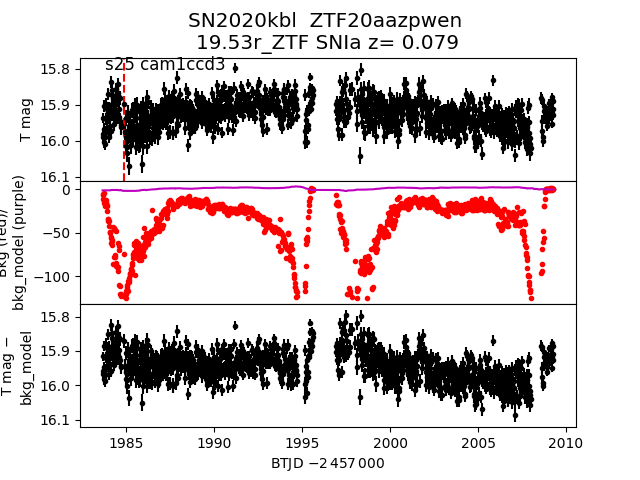
 2020kbl
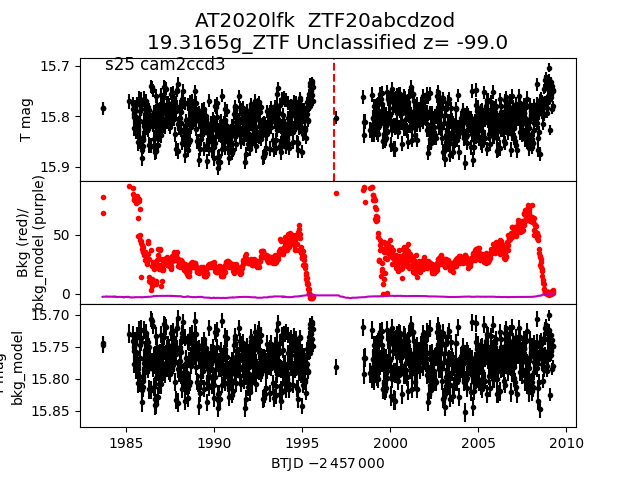
 2020lfk
 2020jww
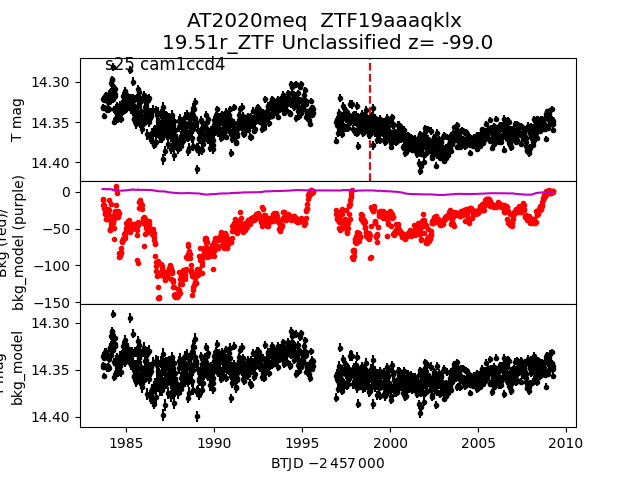
 2020meq
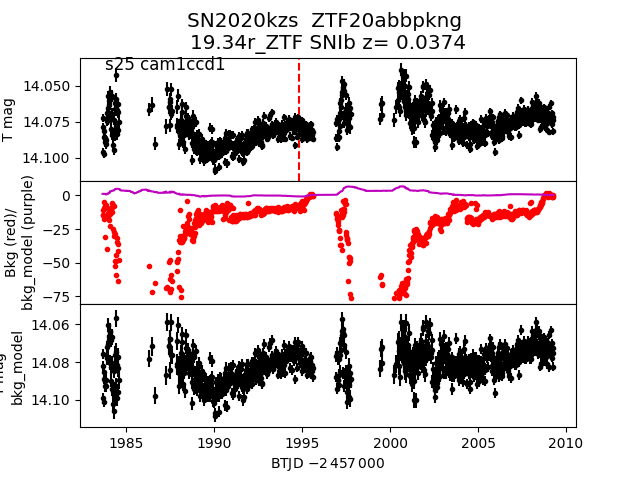
 2020kzs
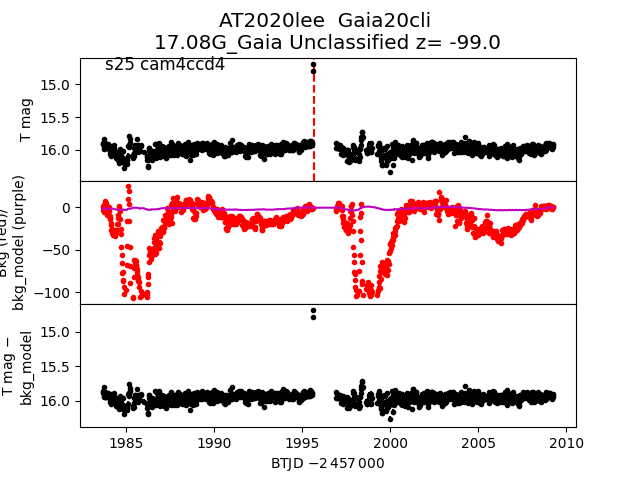
 2020lee
 2020kur
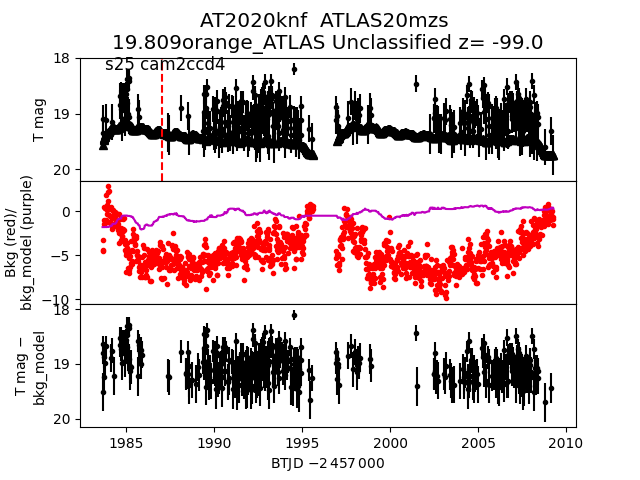
 2020knf
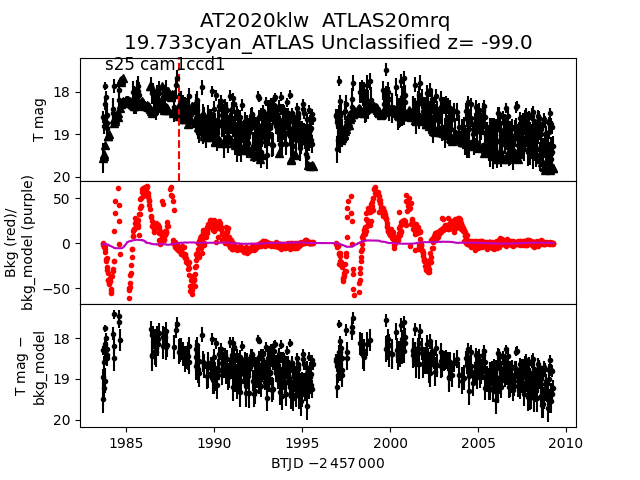
 2020klw
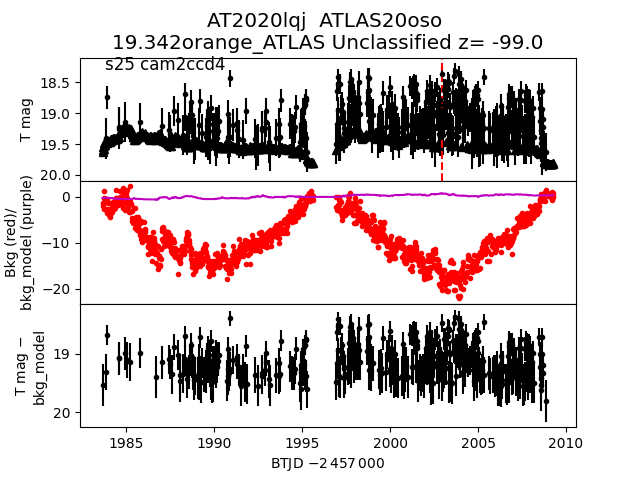
 2020lqj
 2020lqi
 2020lpz
 2020kvs
 2020kbu
 2020klk
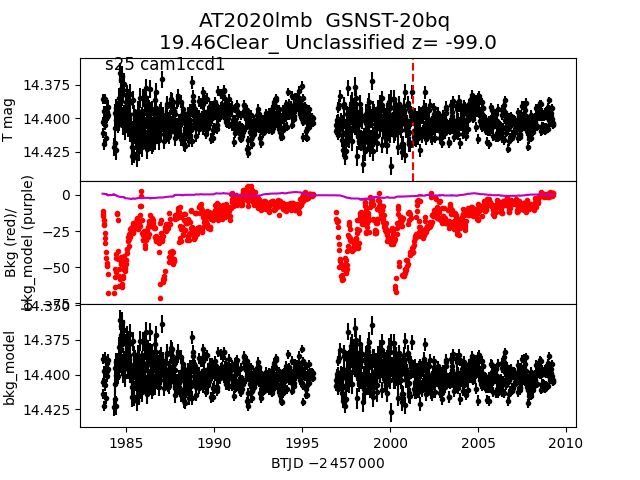
 2020lmb
 2020llg
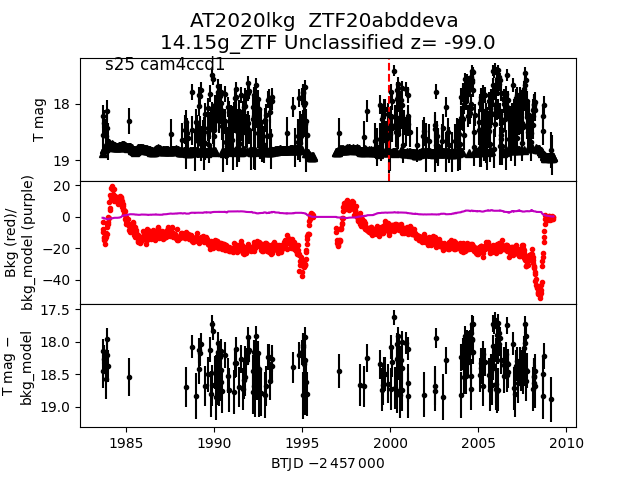
 2020lkg
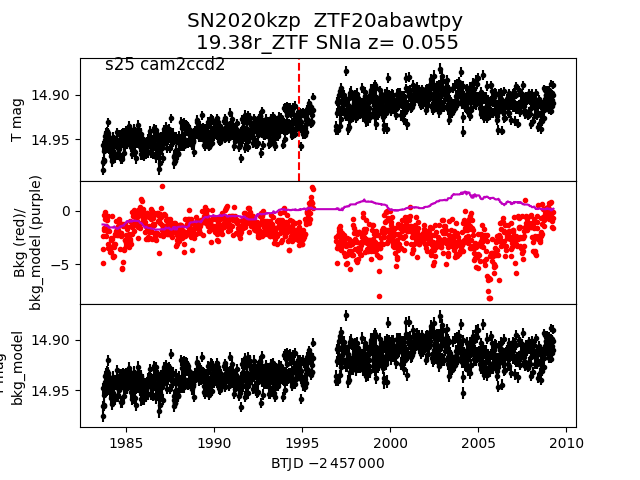
 2020kzp
 2020klq
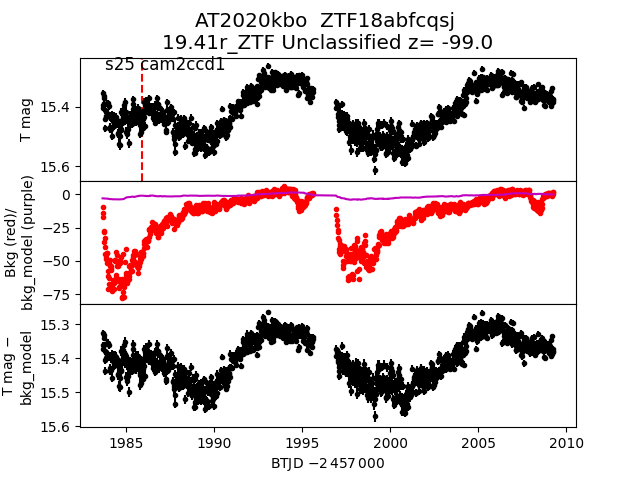
 2020kbo
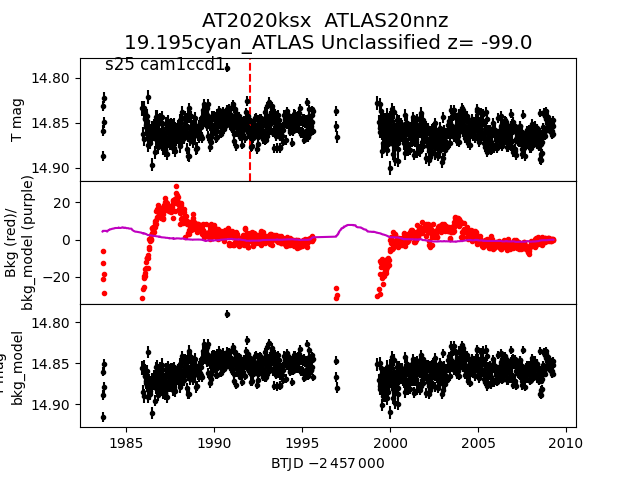
 2020ksx
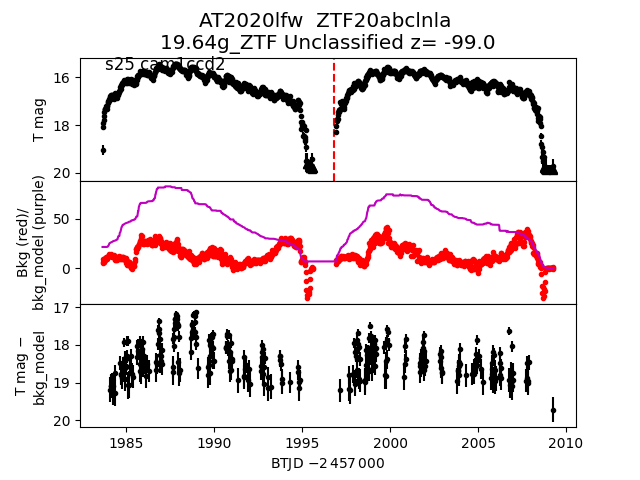
 2020lfw
 2020kbp