all transients in sector24 (61 total)
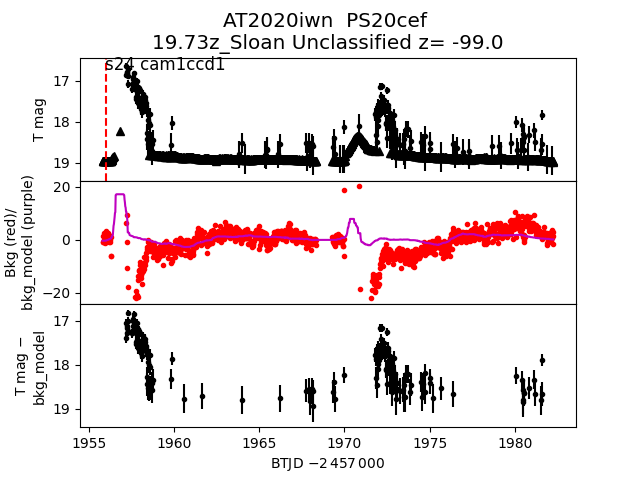
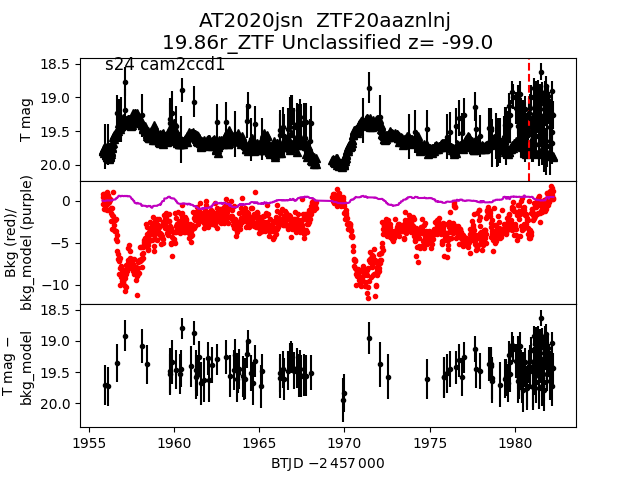
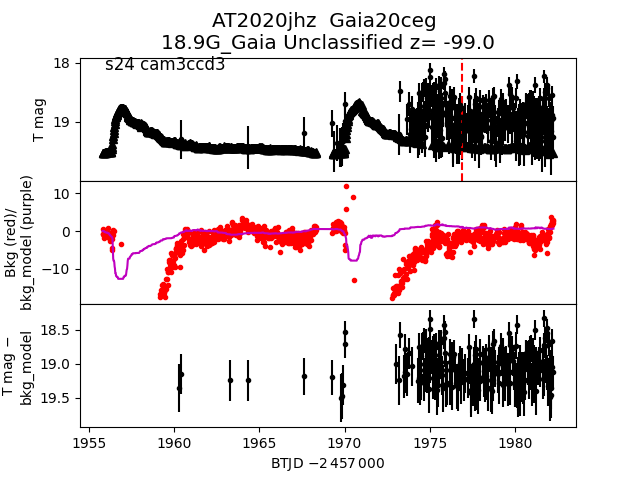
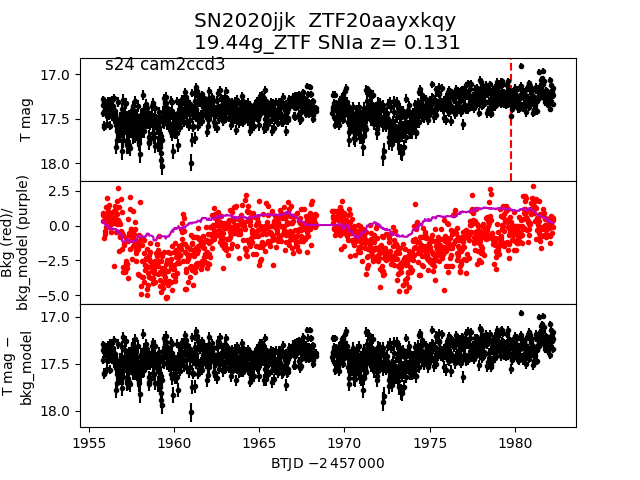
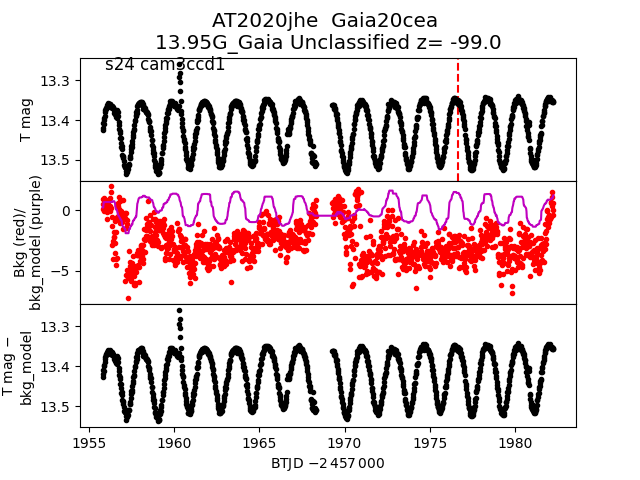
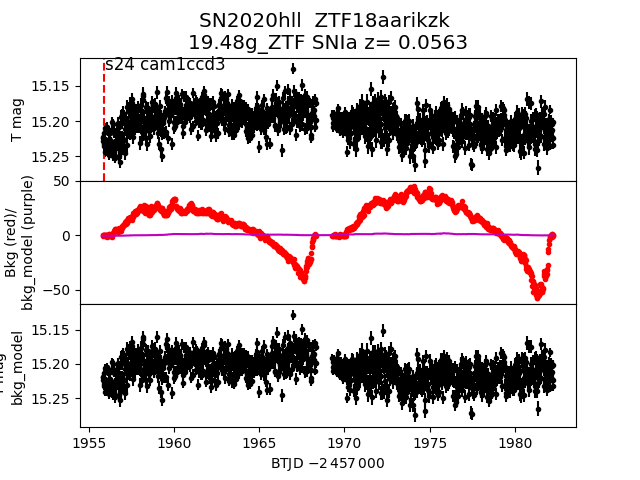
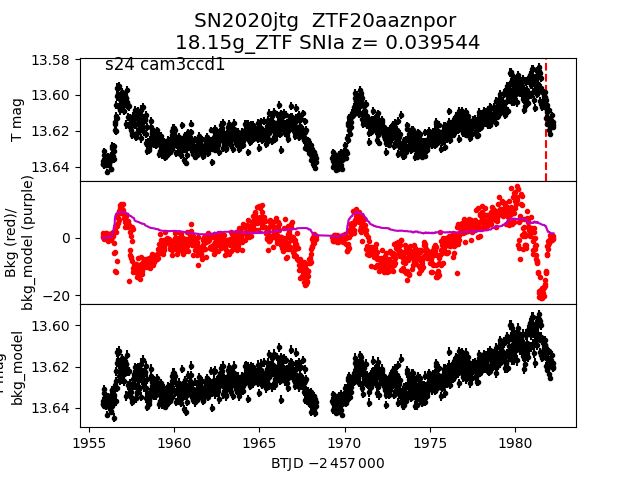
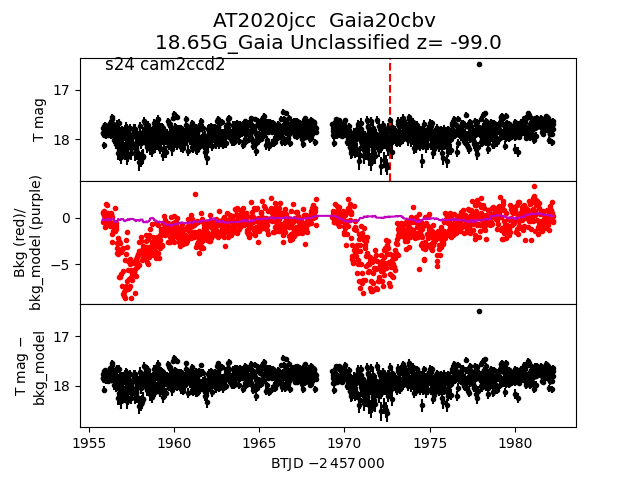
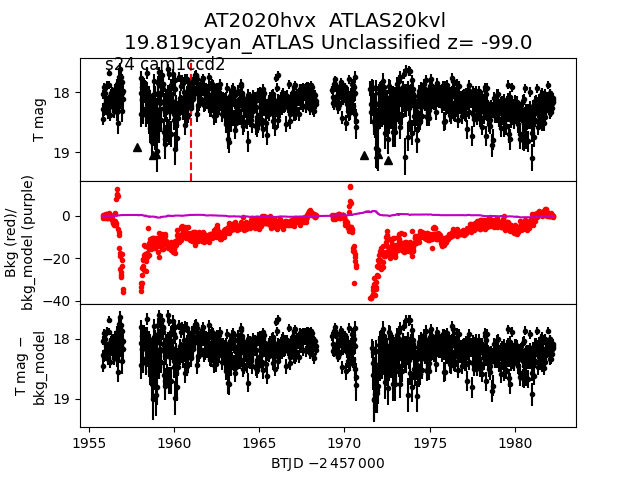
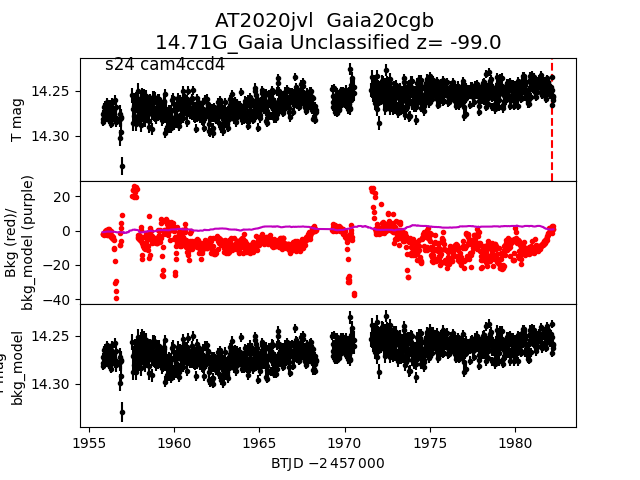
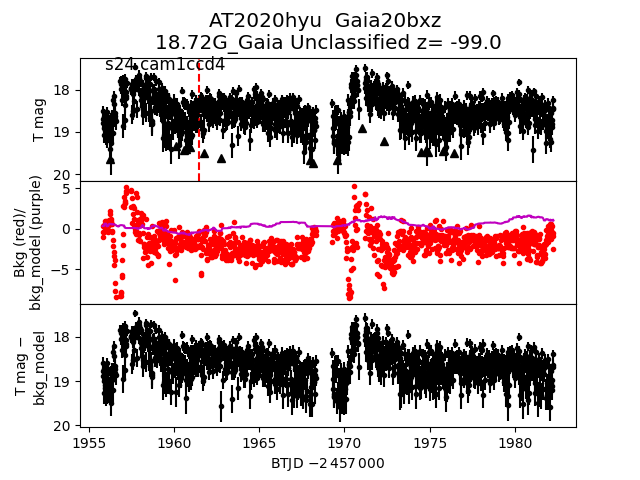
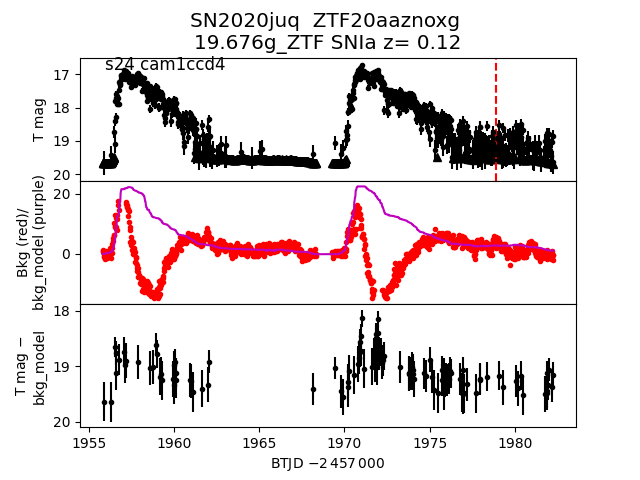
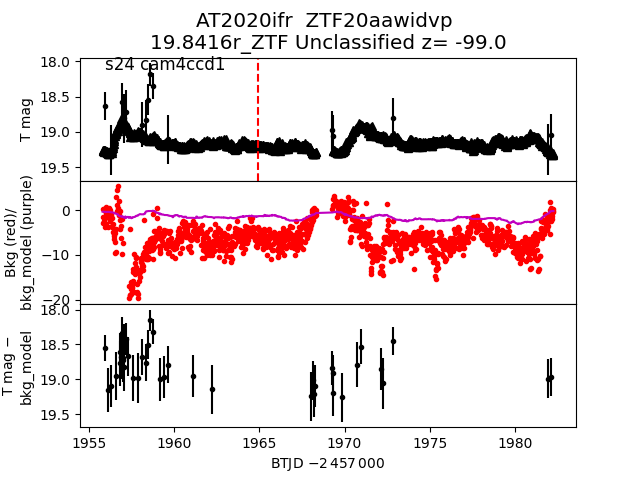
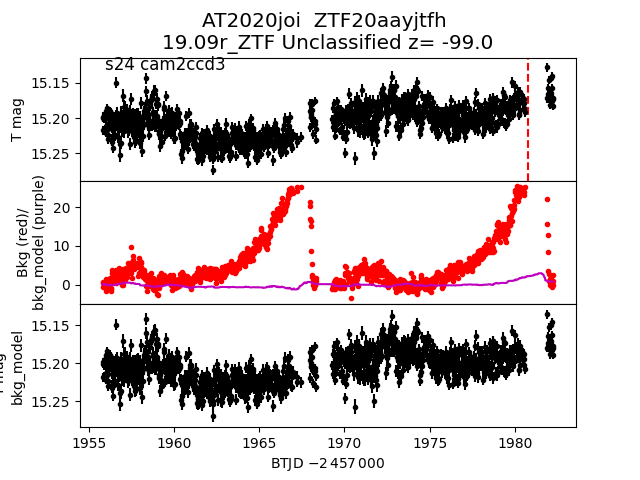
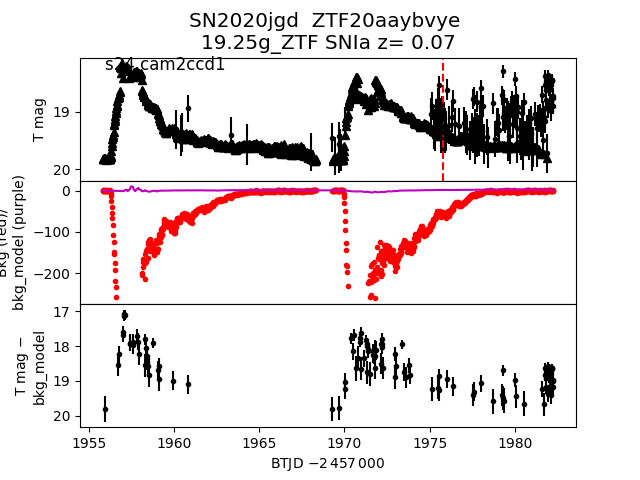
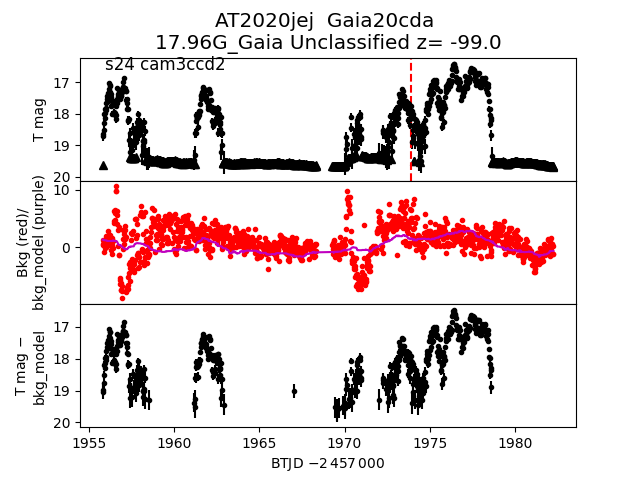
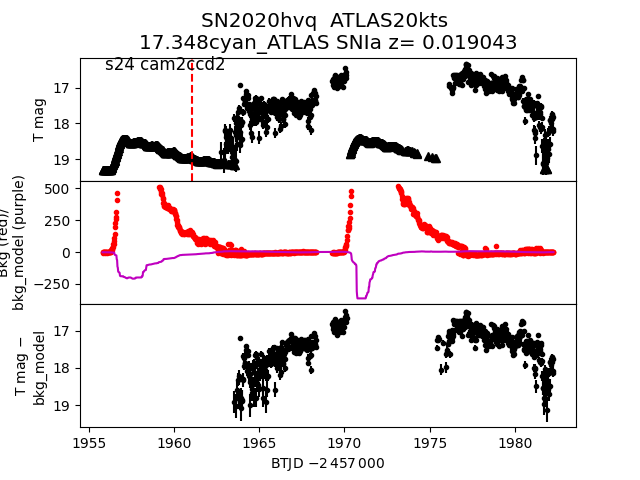
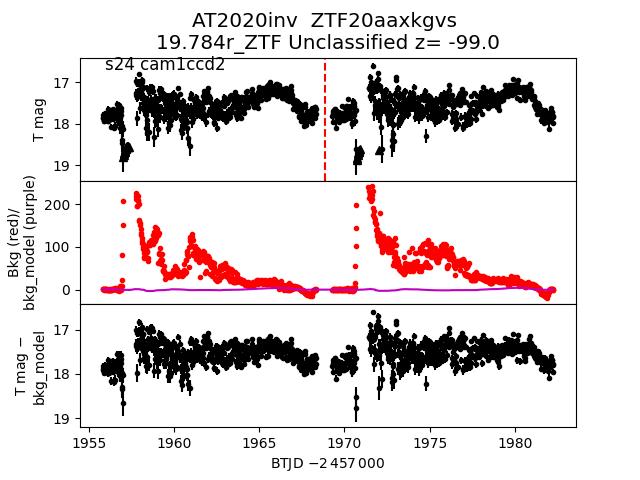
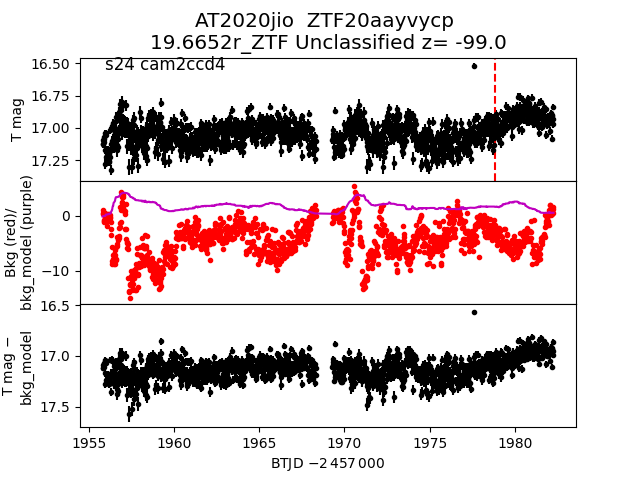
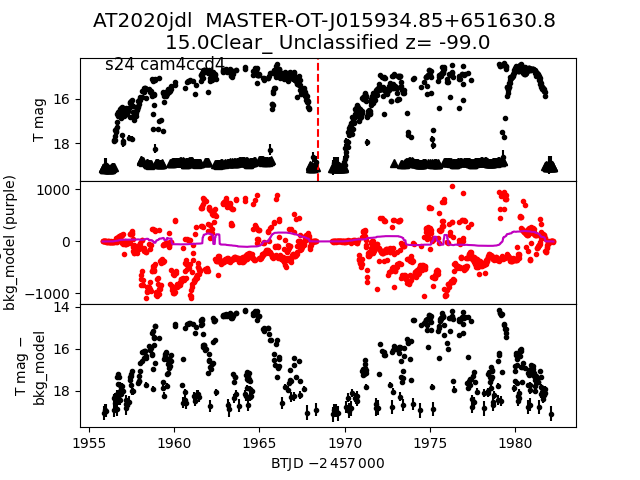
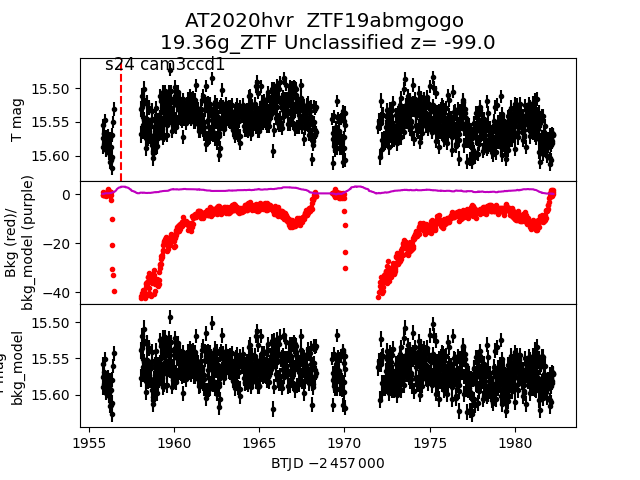
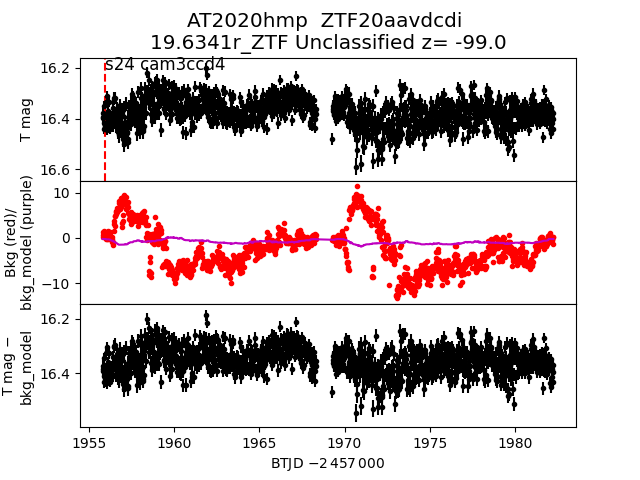
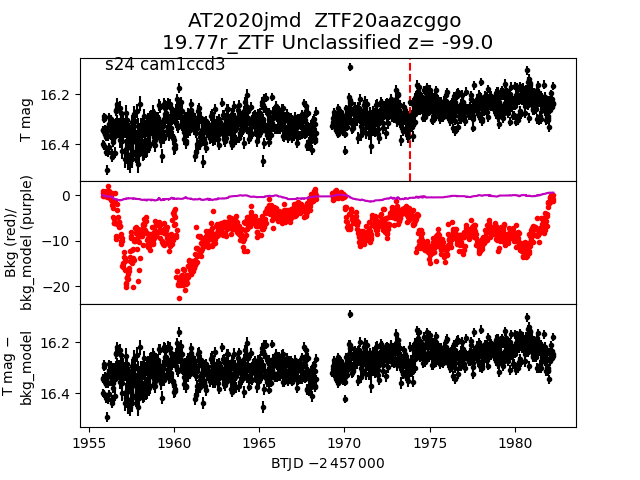
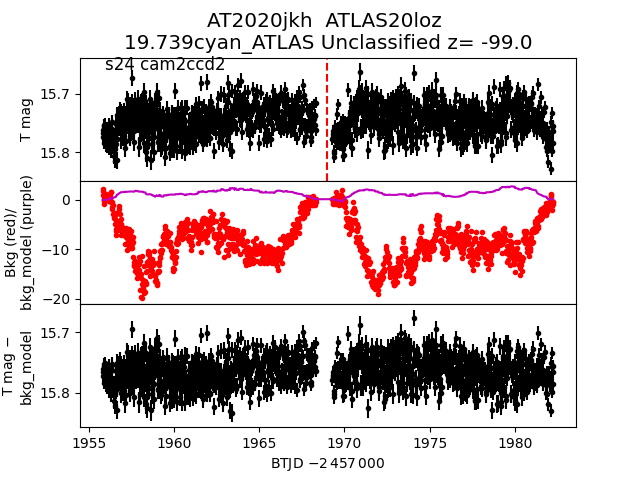
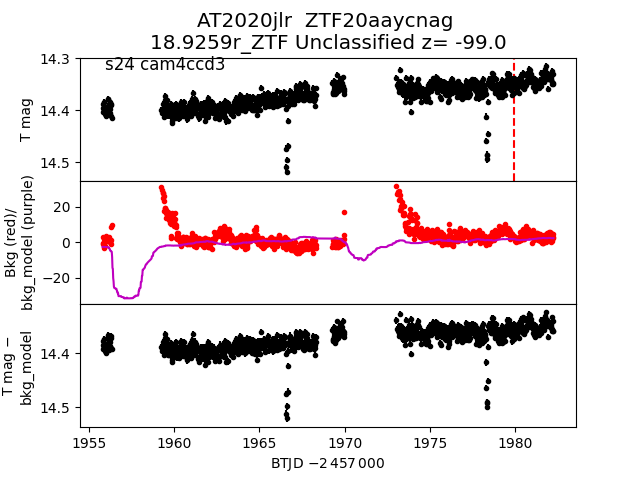
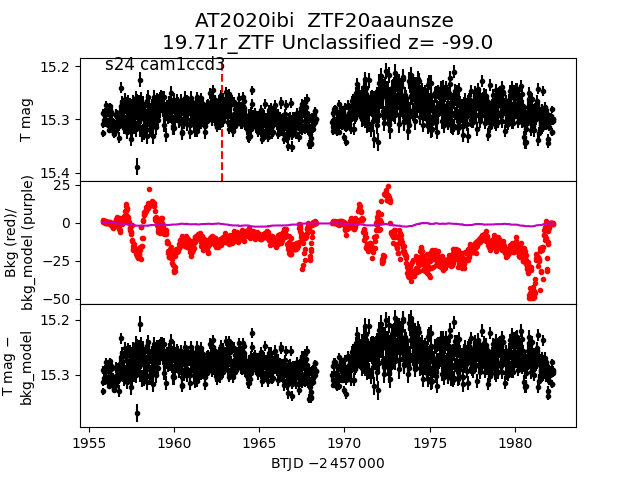
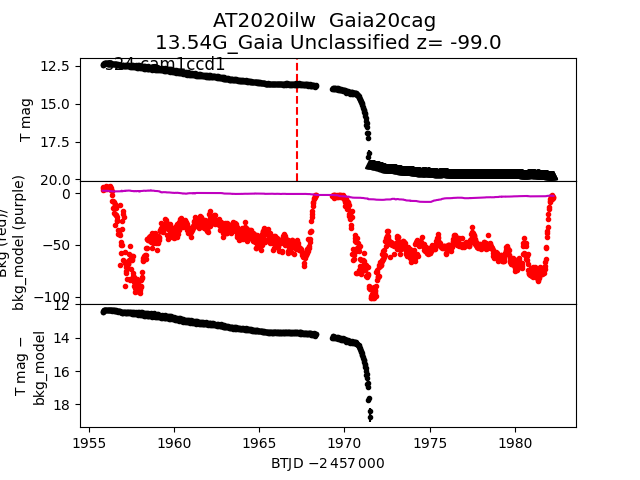
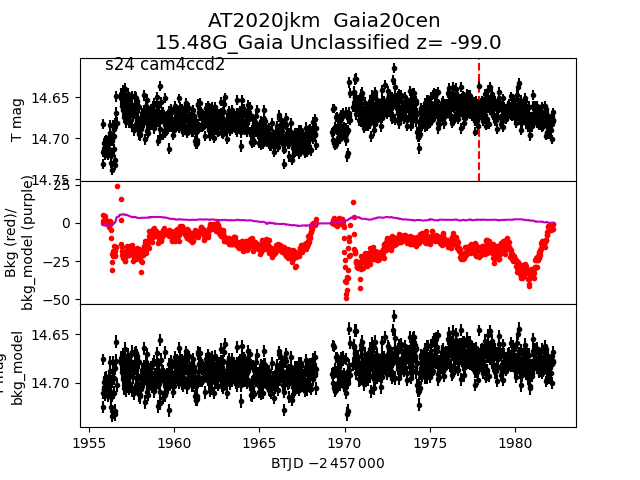
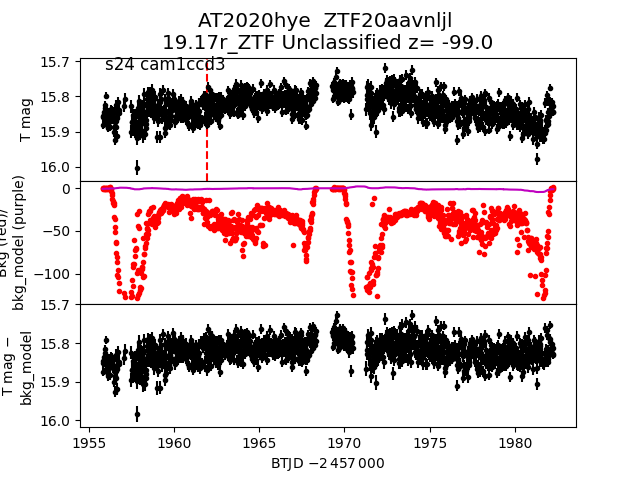
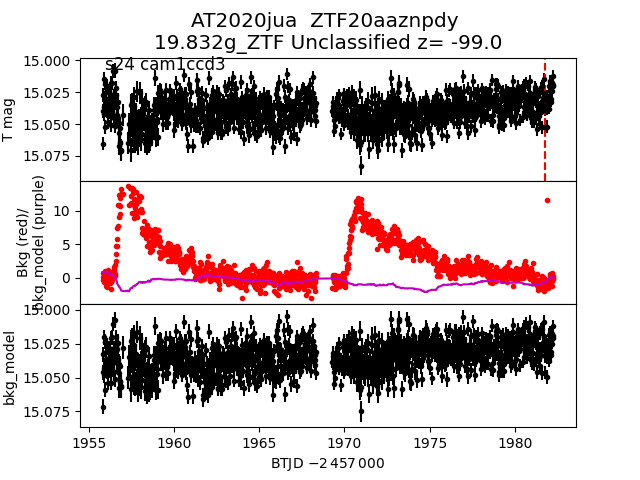
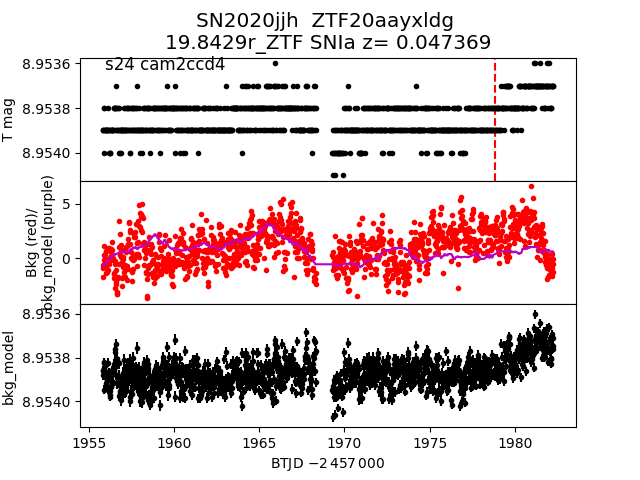
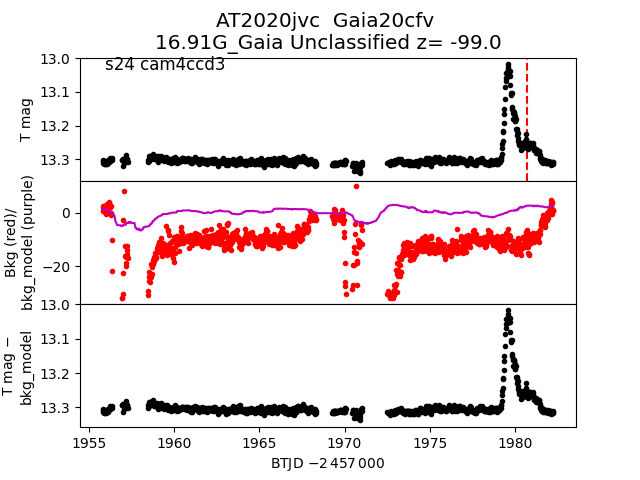
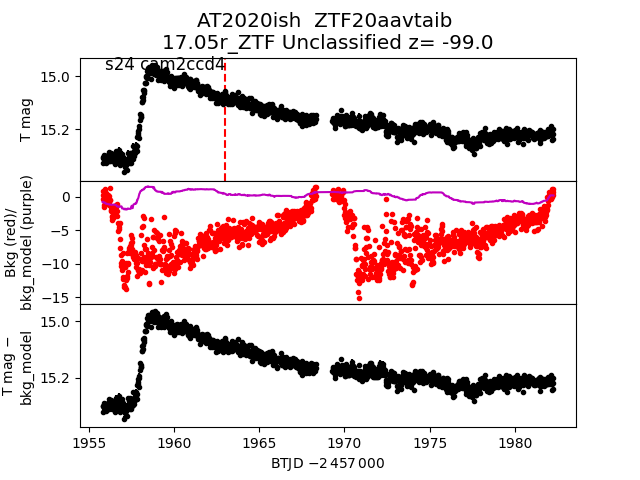
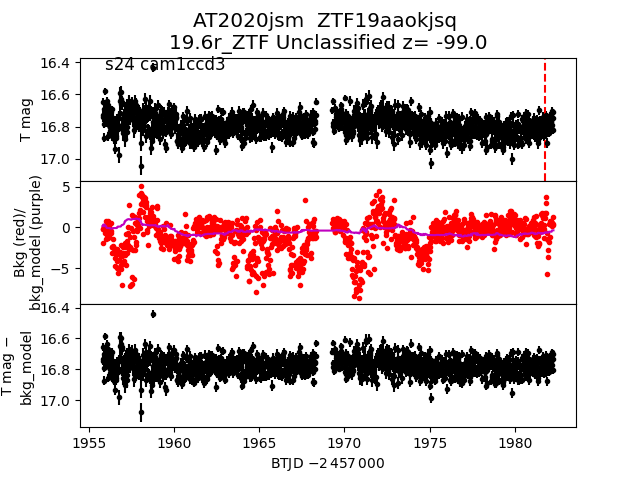
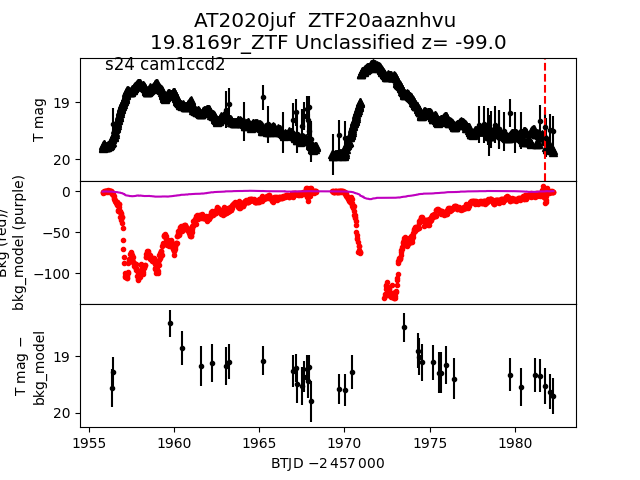
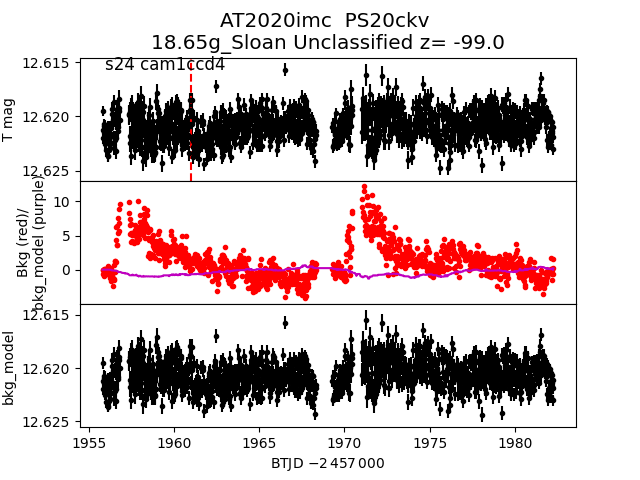
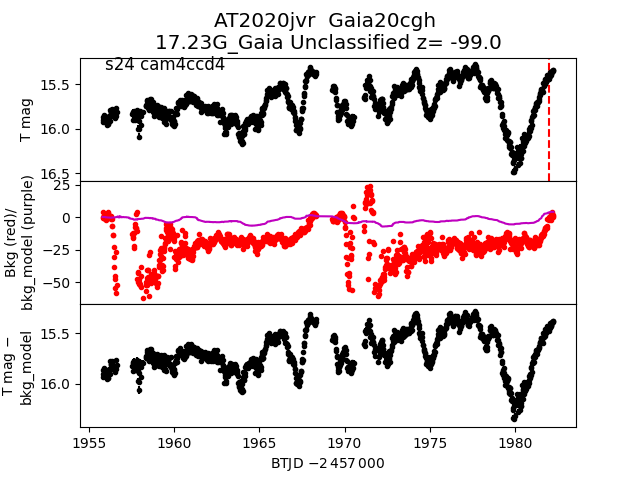
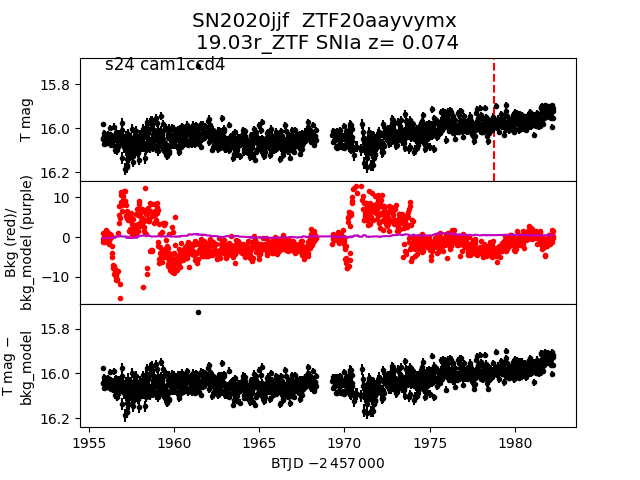
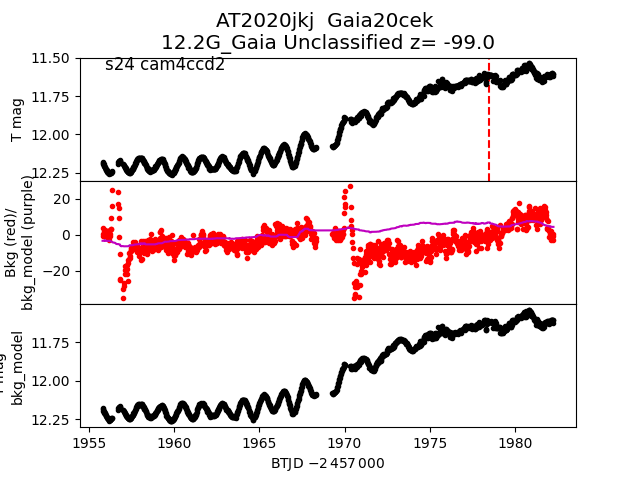
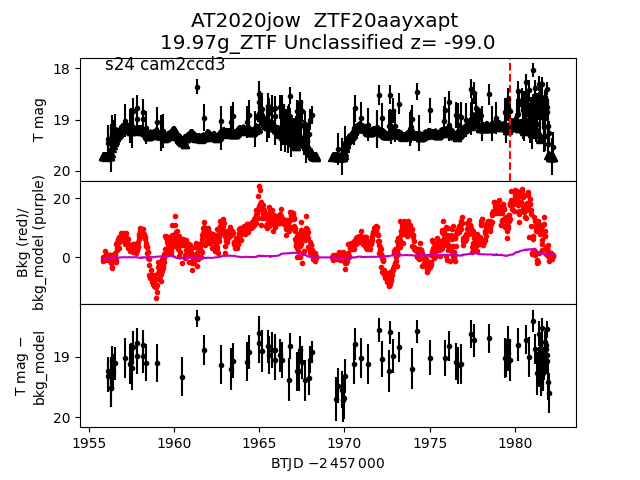
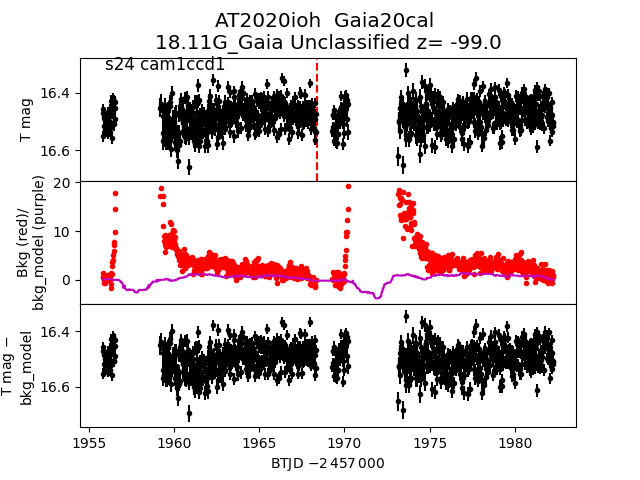
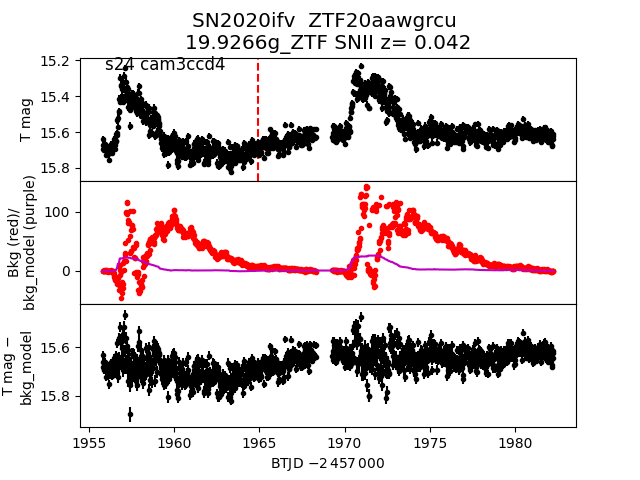
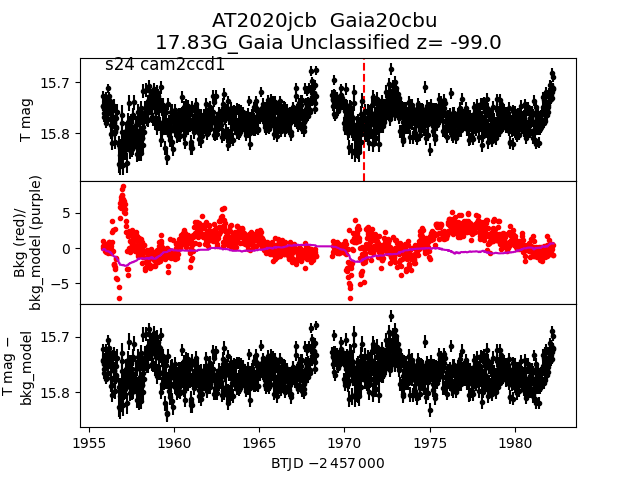
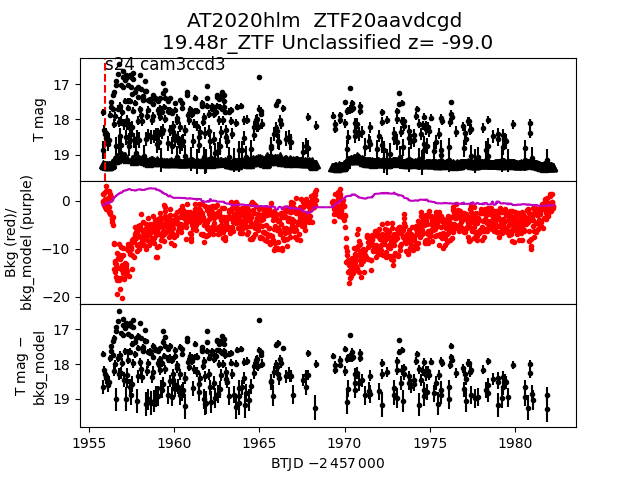
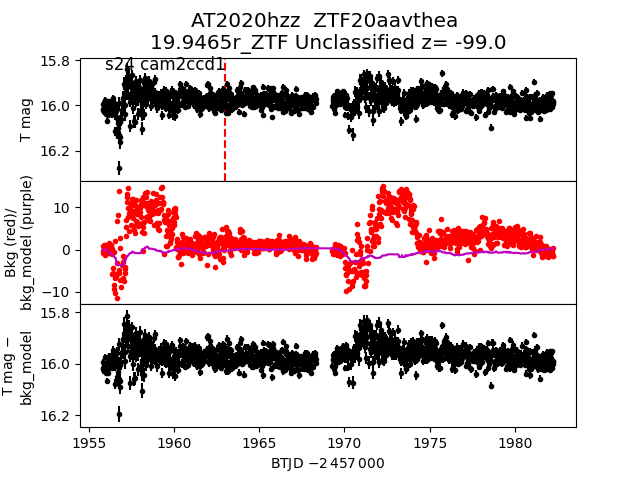
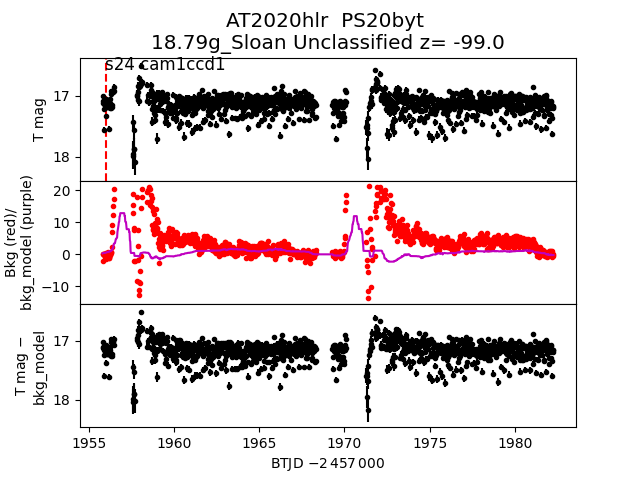
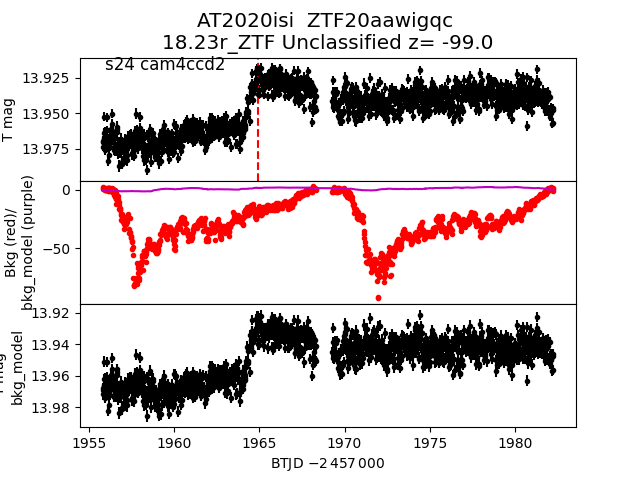
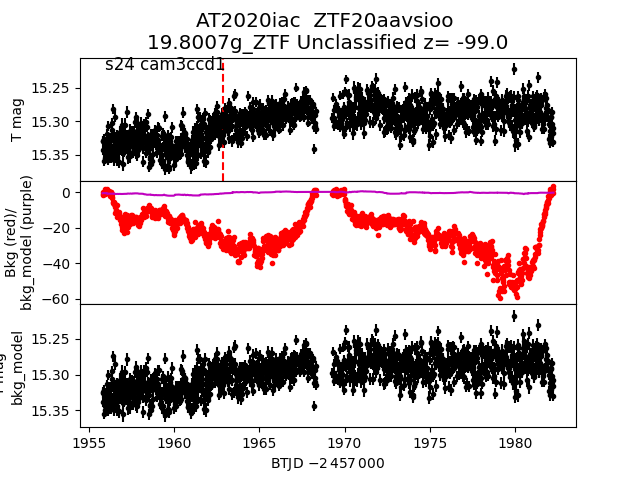
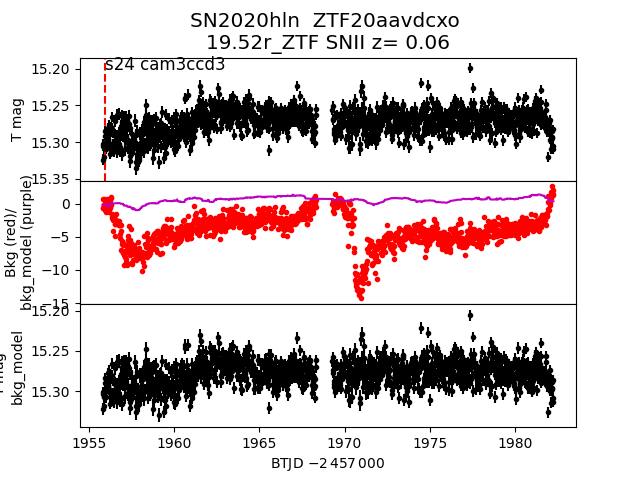
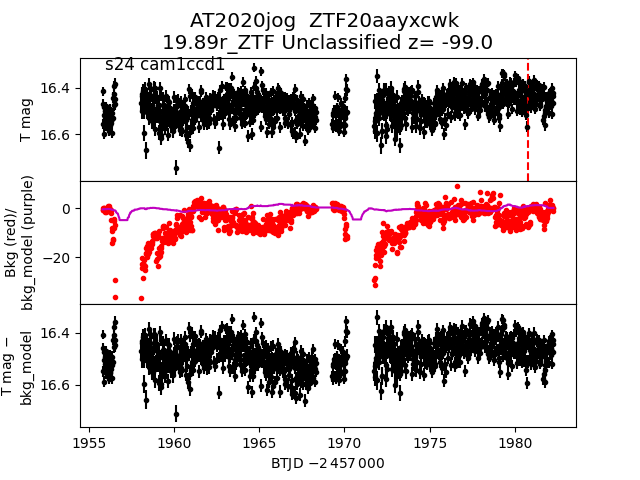
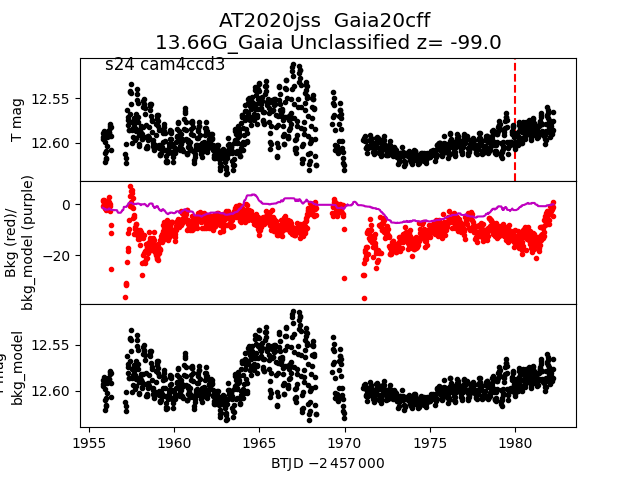
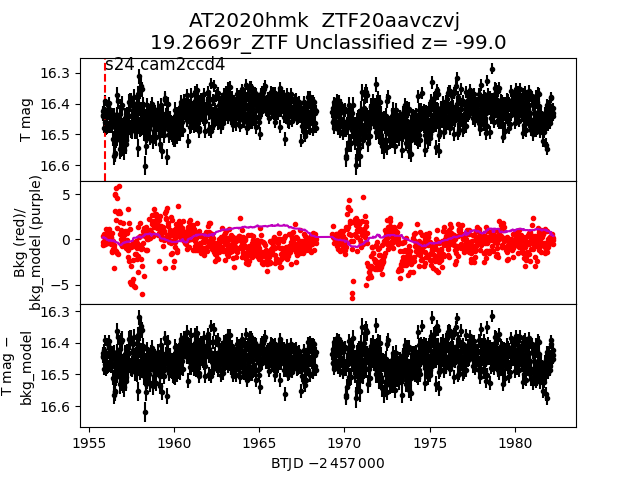
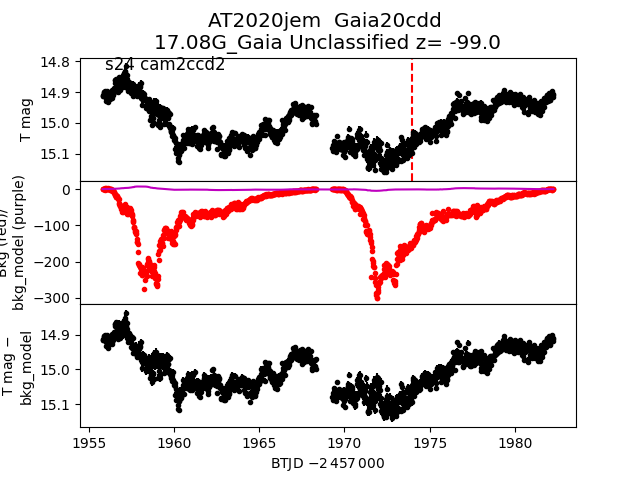
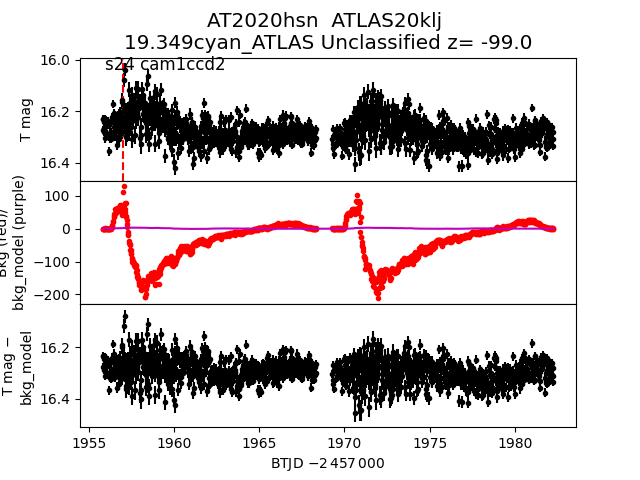
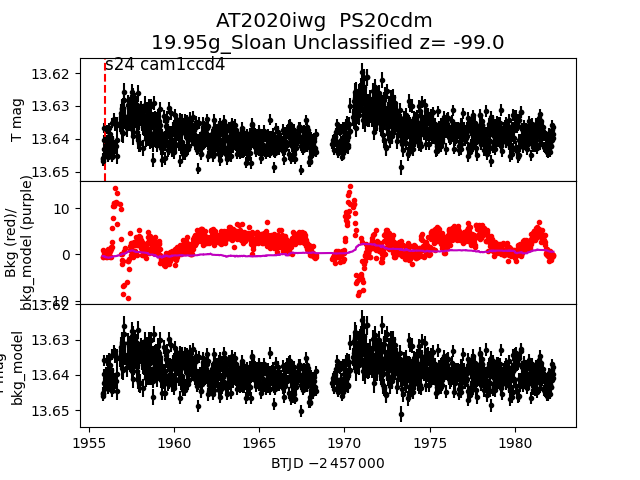
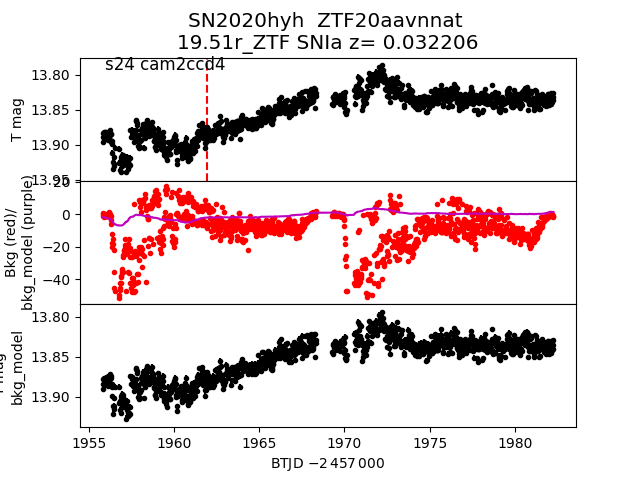
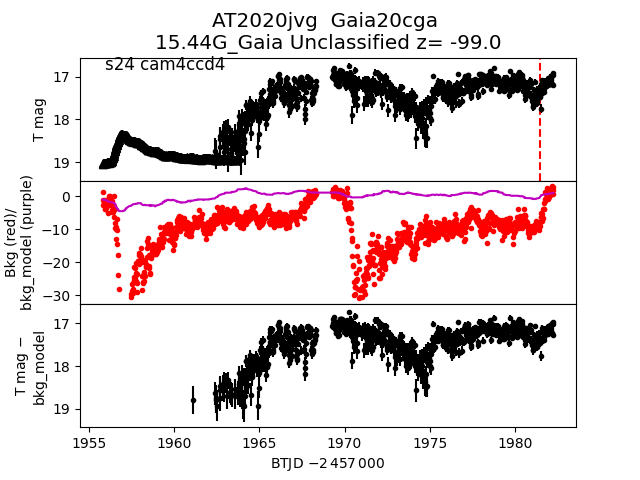
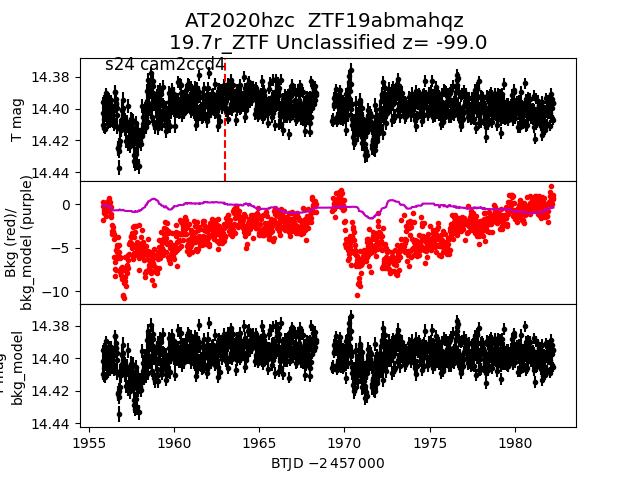
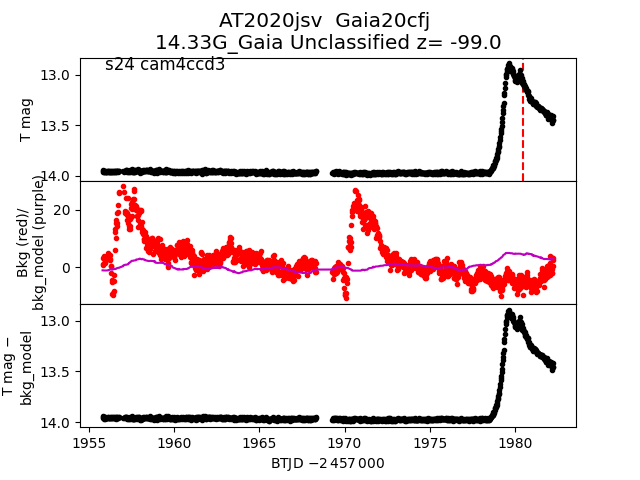
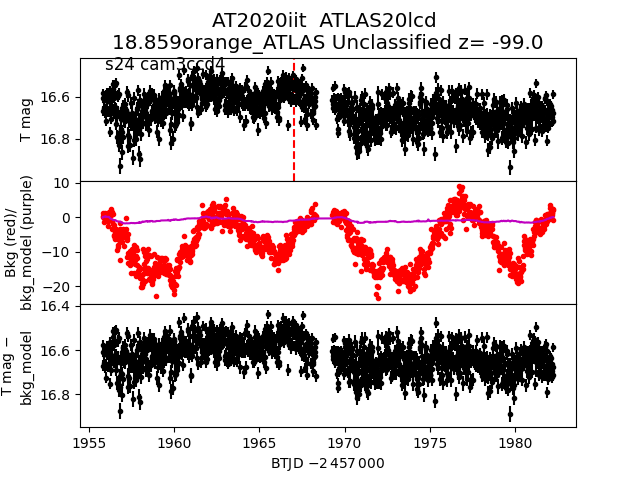
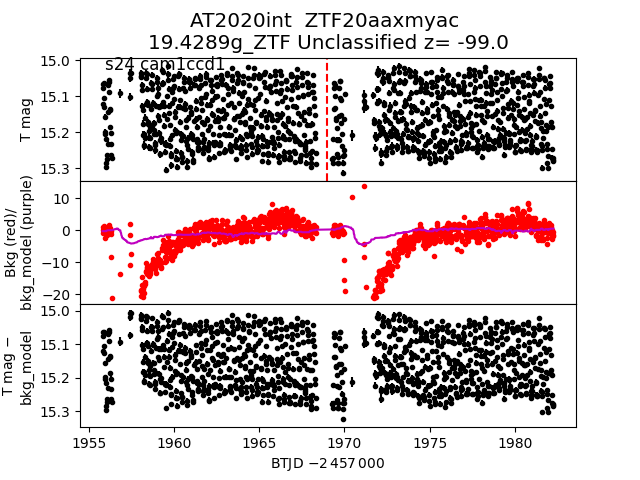
Each figure has three panels. The top panel shows the transient light curve, the middle panel shows the local background (estimated in an annulus), and the bottom panel shows a "background-model corrected" light curve. Details about the background model are in the README.
The vertical red line marks the time of discovery reported to TNS. Other useful metadata from TNS is in the figure title.
Note that the top and bottom panel are in magnitudes, while the middle panel is in differential flux units. The magnitudes are calibrated to the flux in the reference image used for image subtraction. Thus, flux from the host galaxy is included in these magnitudes.
3-sigma upper limits are plotted as triangles with no errorbars. A typical limiting magnitude is 19.6 in 30 minutes or 18.4 in 200 seconds (for low backgrounds).
The links allow you to download the light curve data as a text file.
More details in the README.
2020jsn
 2020jhz
 2020jjk
 2020jhe
 2020hll
 2020jtg
 2020jcc
 2020hvx
 2020jvl
 2020hyu
 2020juq
 2020ifr
 2020joi
 2020jgd
 2020jej
 2020hvq
 2020inv
 2020jio
 2020jdl
 2020hvr
 2020hmp
 2020jmd
 2020jkh
 2020jlr
 2020ibi
 2020ilw
 2020jkm
 2020hye
 2020jua
 2020jjh
 2020jvc
 2020ish
 2020jsm
 2020juf
 2020imc
 2020jvr
 2020jjf
 2020jkj
 2020jow
 2020ioh
 2020ifv
 2020jcb
 2020hlm
 2020hzz
 2020hlr
 2020isi
 2020iac
 2020hln
 2020jog
 2020jss
 2020hmk
 2020jem
 2020hsn
 2020iwg
 2020hyh
 2020jvg
 2020hzc
 2020jsv
 2020iit
 2020int
 2020iwn