sector23 supernovae (23 total)
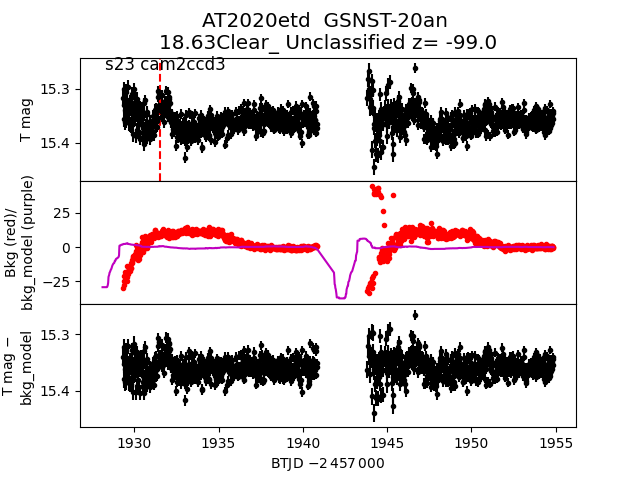
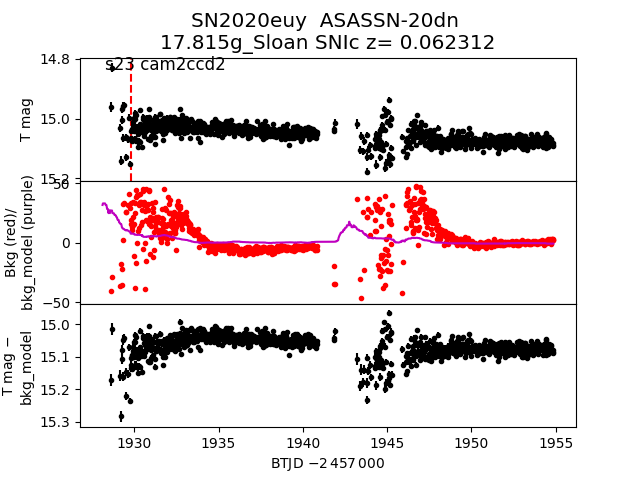
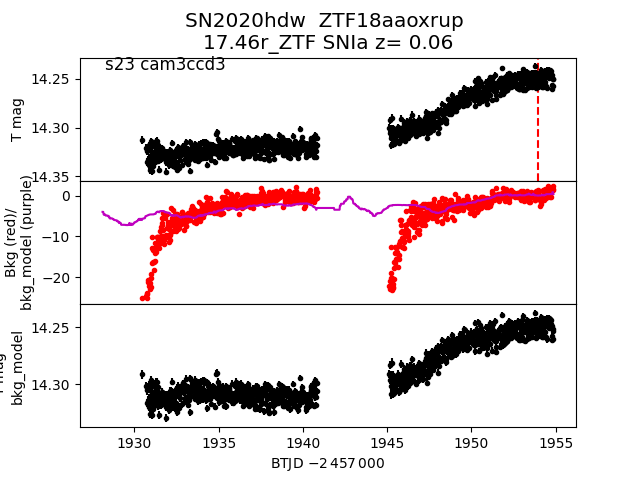
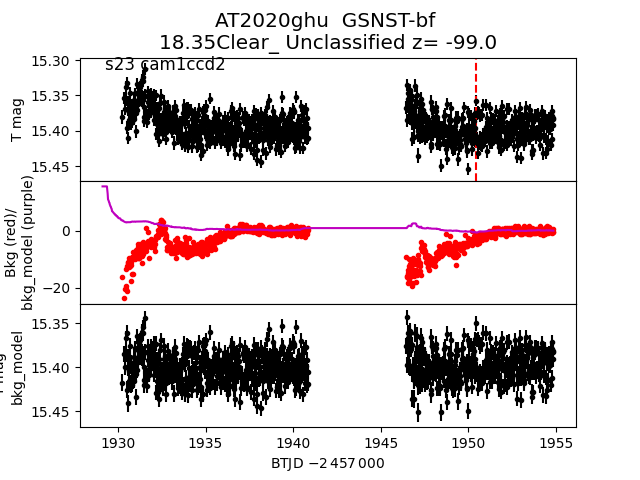
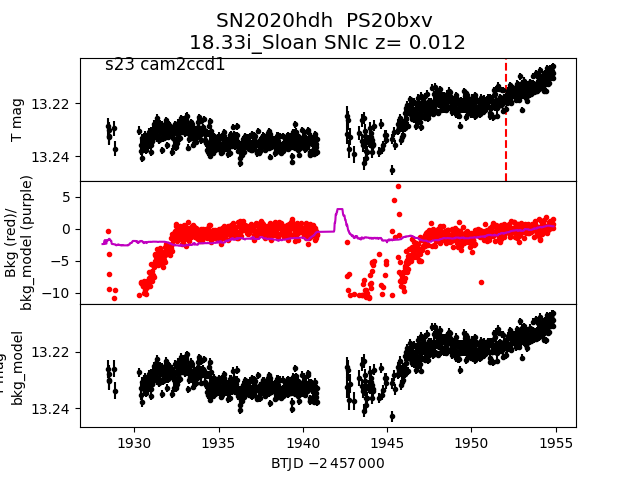
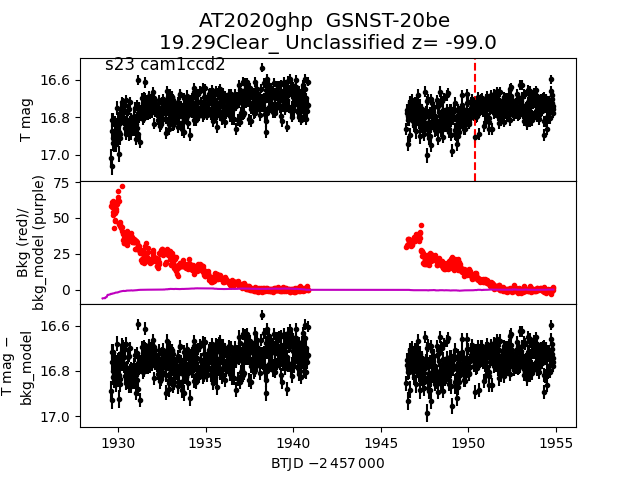
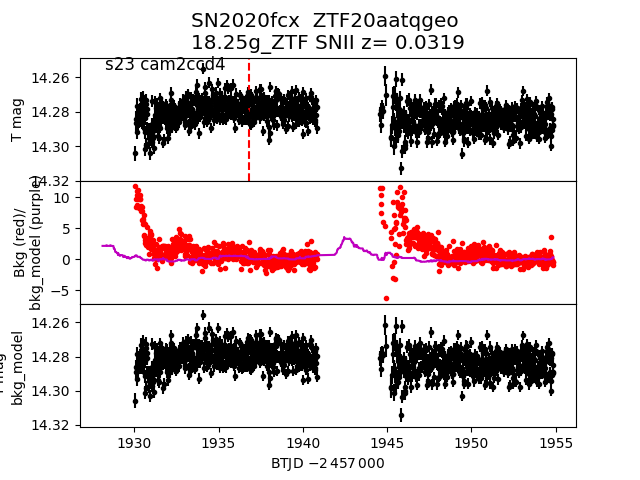
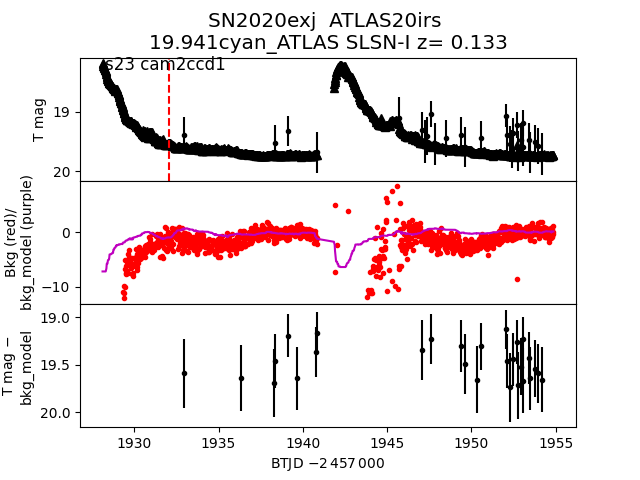
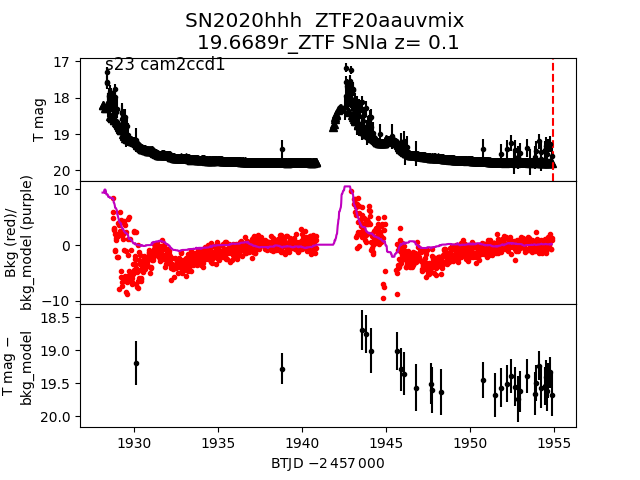
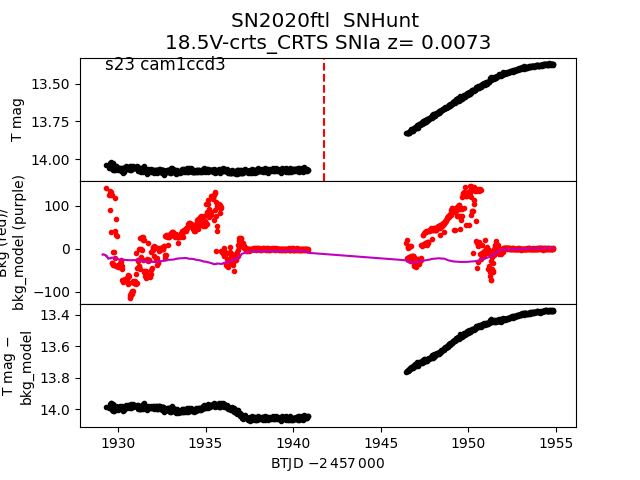
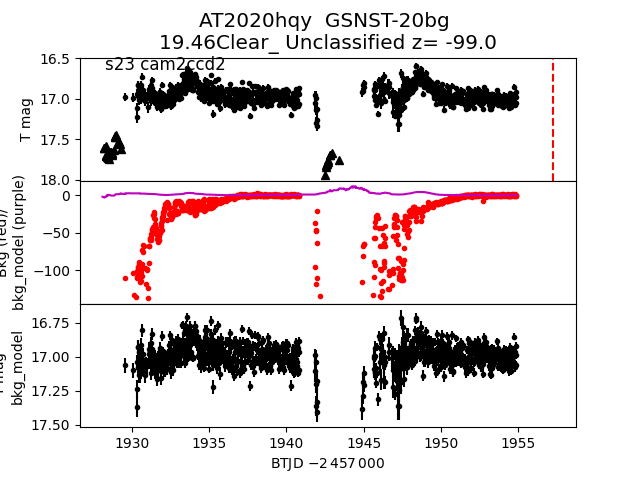
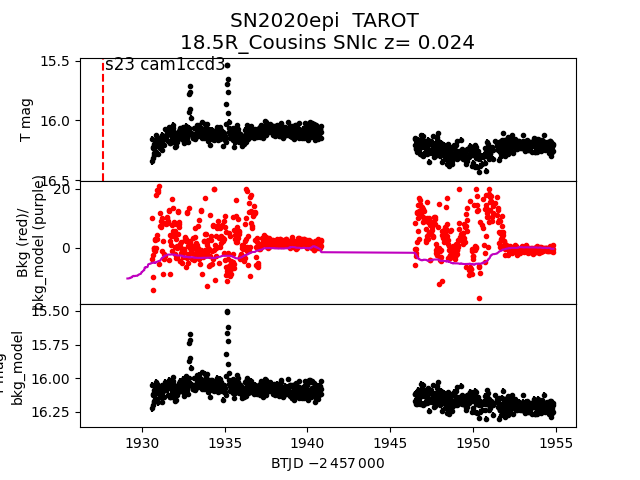
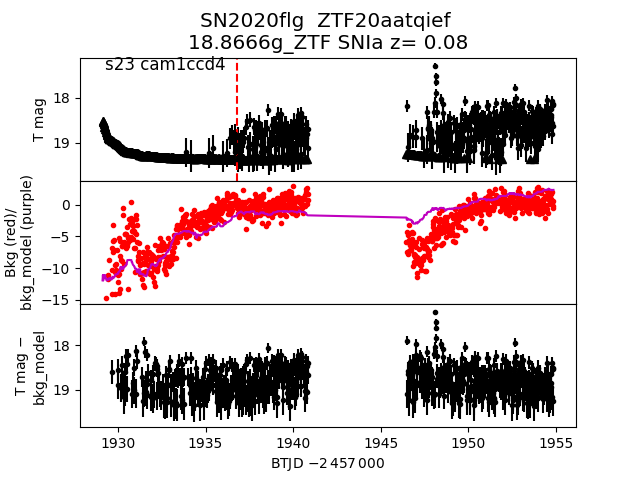
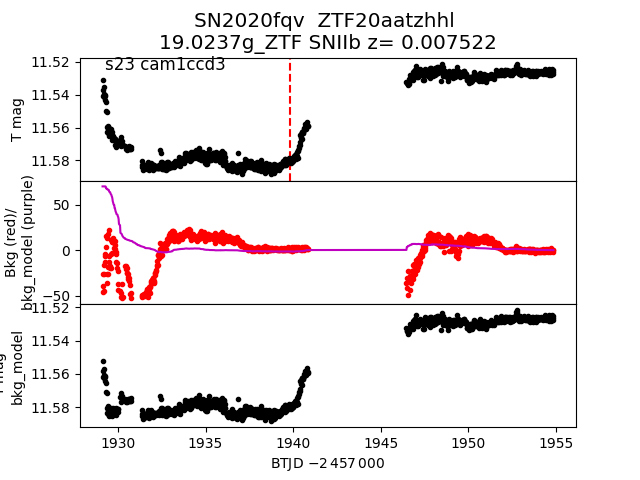
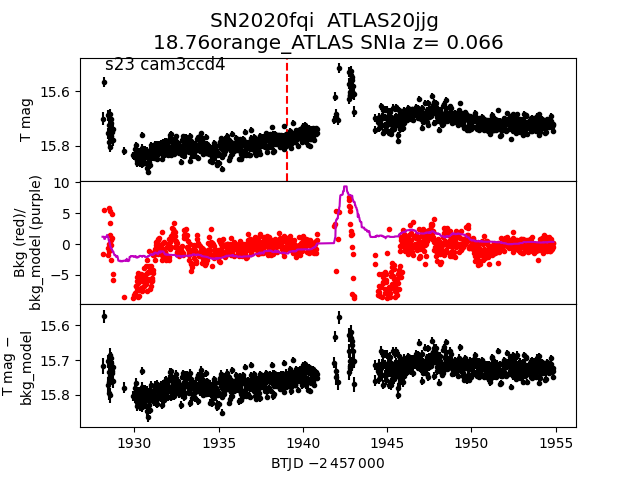
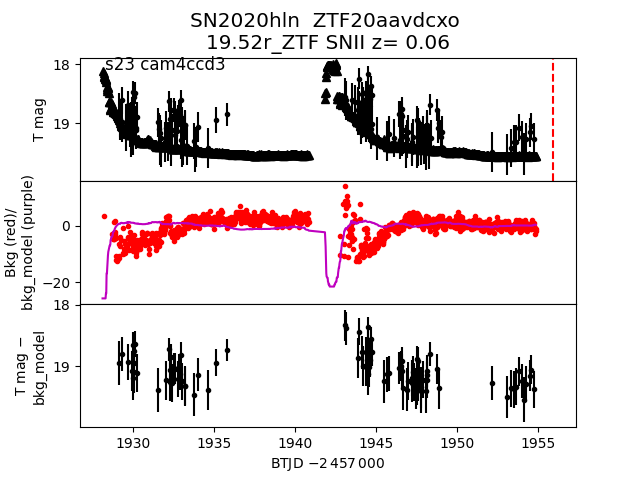
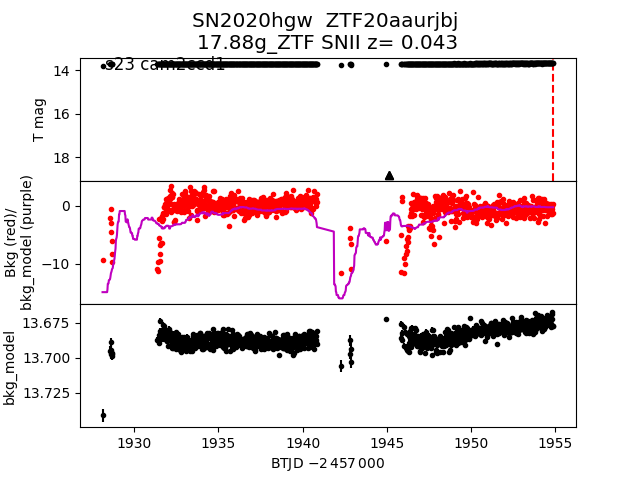
Each figure has three panels. The top panel shows the transient light curve, the middle panel shows the local background (estimated in an annulus), and the bottom panel shows a "background-model corrected" light curve. Details about the background model are in the README.
The vertical red line marks the time of discovery reported to TNS. Other useful metadata from TNS is in the figure title.
Note that the top and bottom panel are in magnitudes, while the middle panel is in differential flux units. The magnitudes are calibrated to the flux in the reference image used for image subtraction. Thus, flux from the host galaxy is included in these magnitudes.
3-sigma upper limits are plotted as triangles with no errorbars. A typical limiting magnitude is 19.6 in 30 minutes or 18.4 in 200 seconds (for low backgrounds).
The links allow you to download the light curve data as a text file.
More details in the README.
2020euy
 2020hdw
 2020ghu
 2020hdh
 2020ghp
 2020fcx
 2020exj
 2020hhh
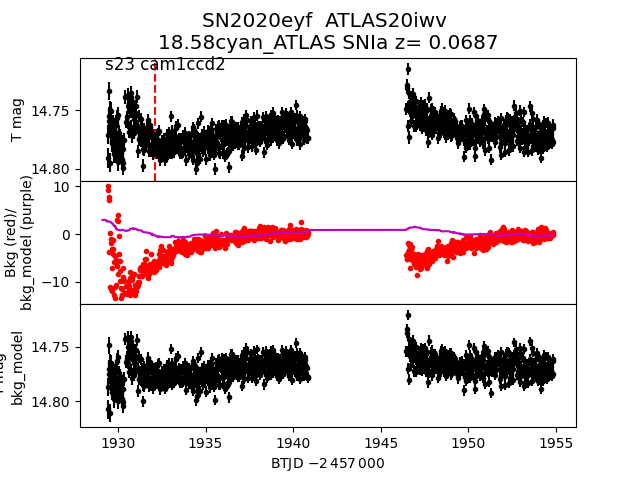
 2020eyf
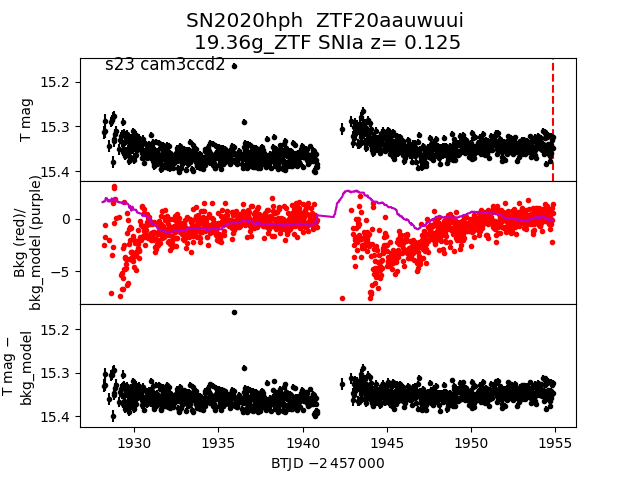
 2020hph
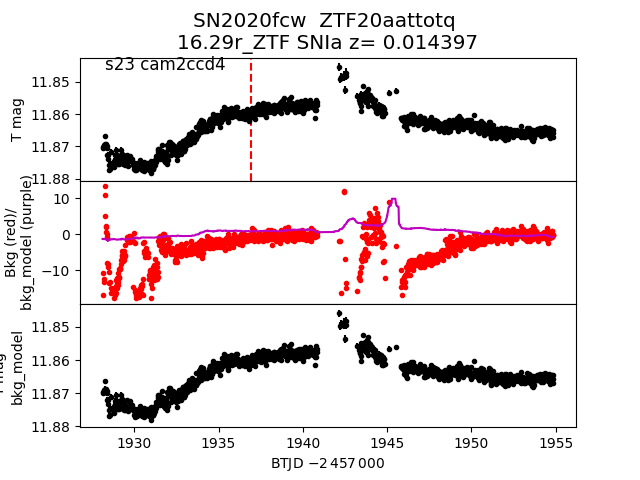
 2020fcw
 2020ftl
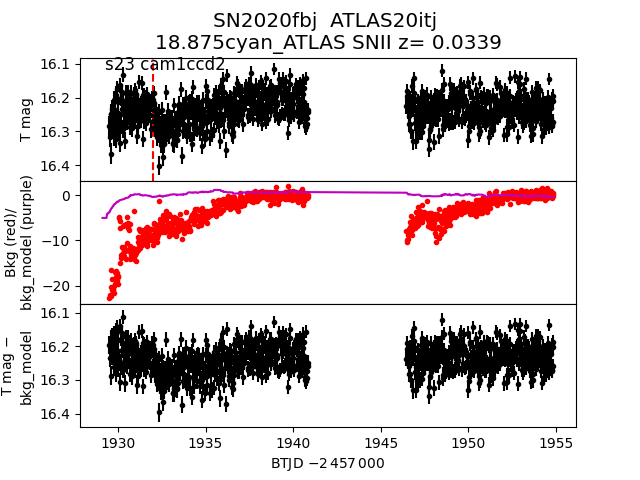
 2020fbj
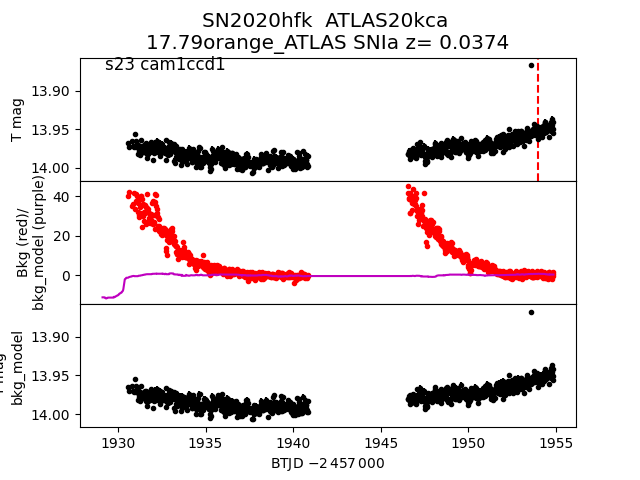
 2020hfk
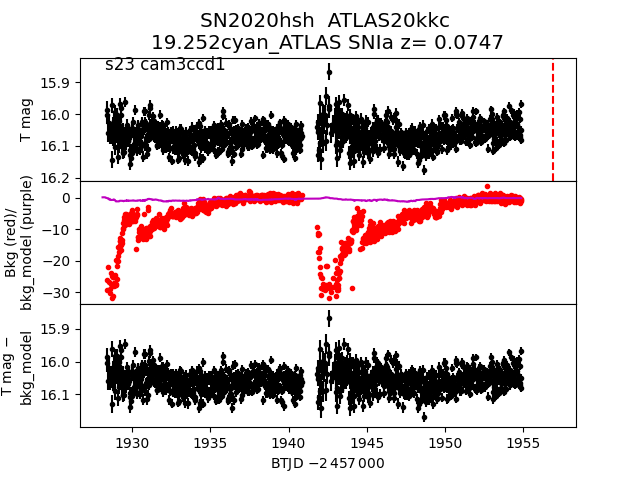
 2020hsh
 2020hqy
 2020epi
 2020flg
 2020fqv
 2020fqi
 2020hln
 2020hgw
 2020etd