all transients in sector22 (60 total)
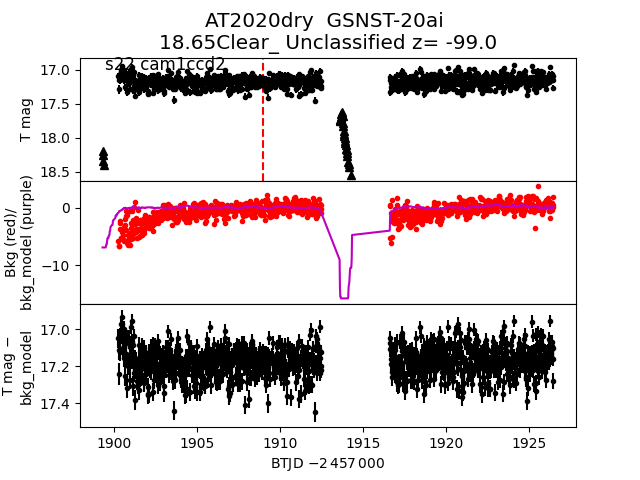
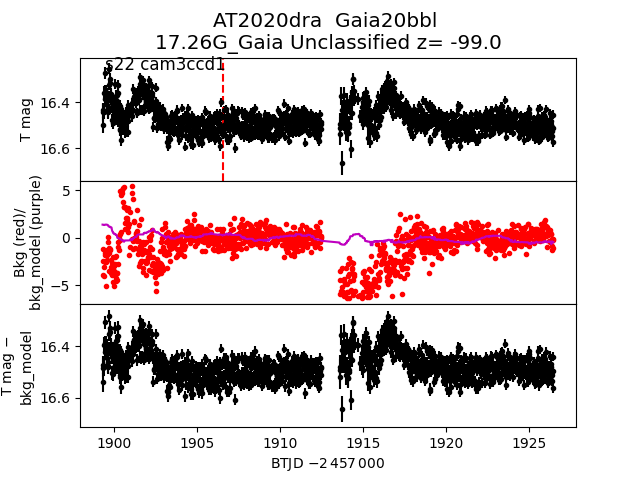
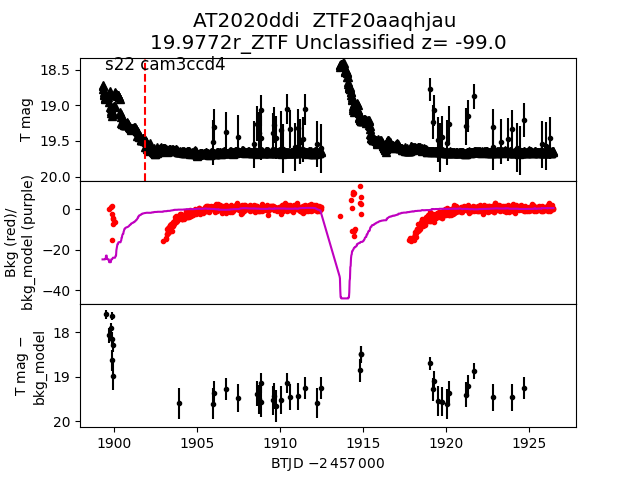
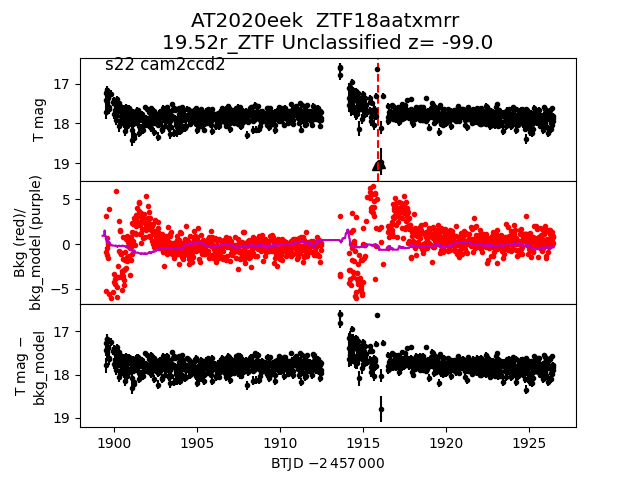
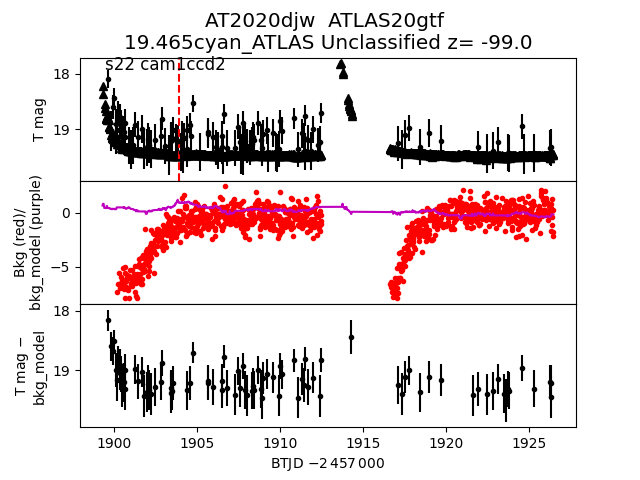
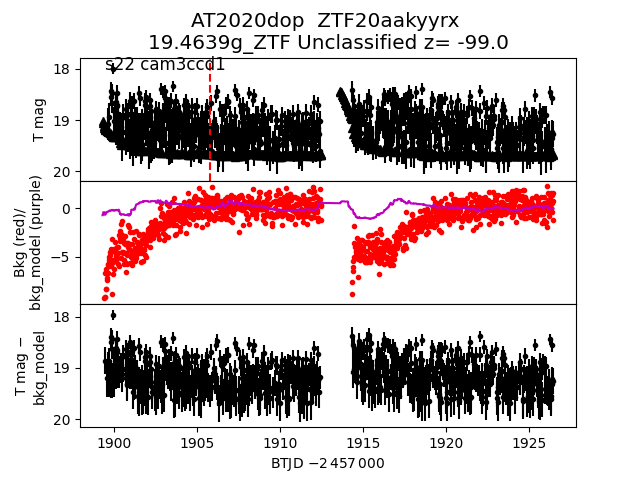
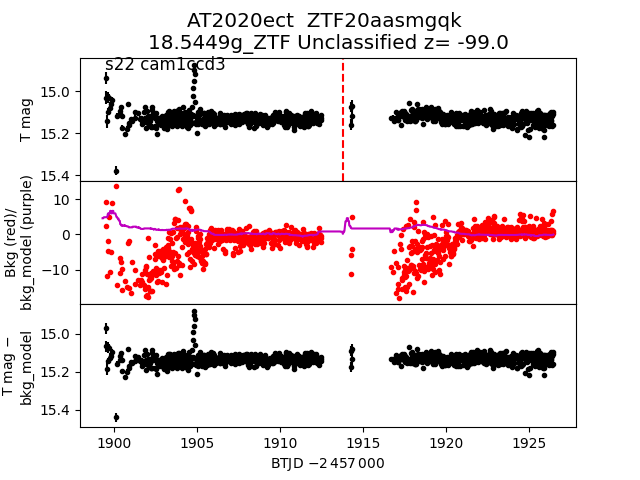
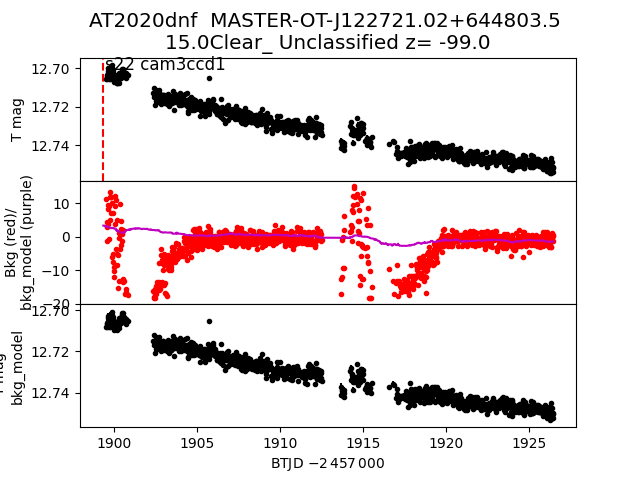
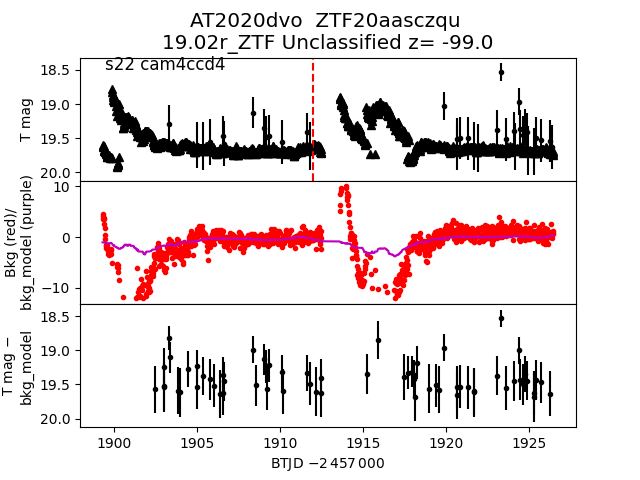
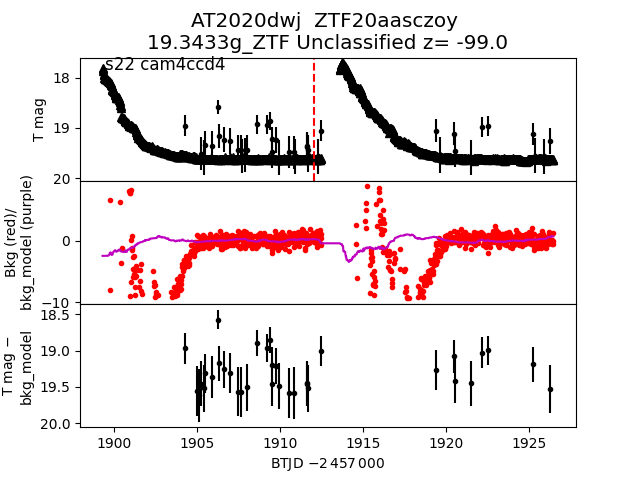
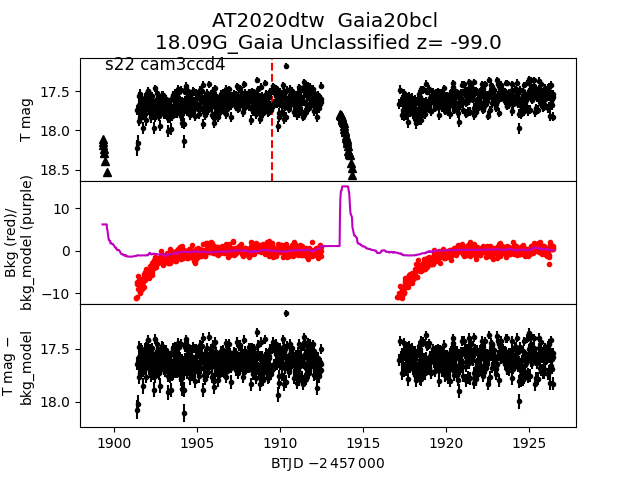
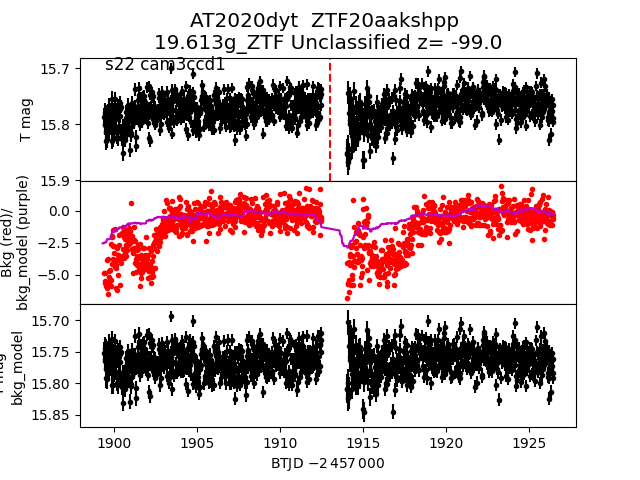
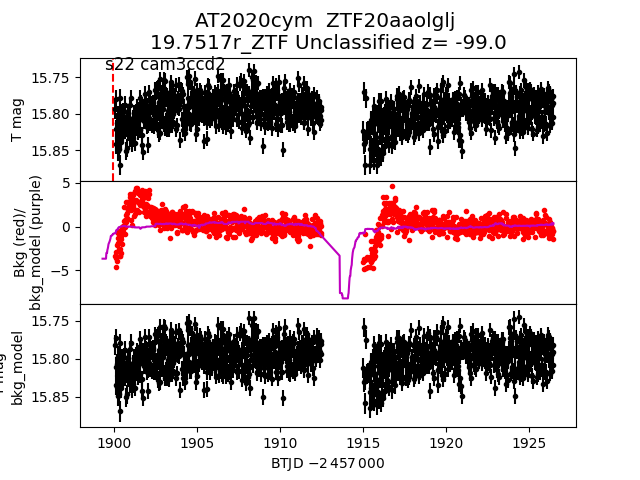
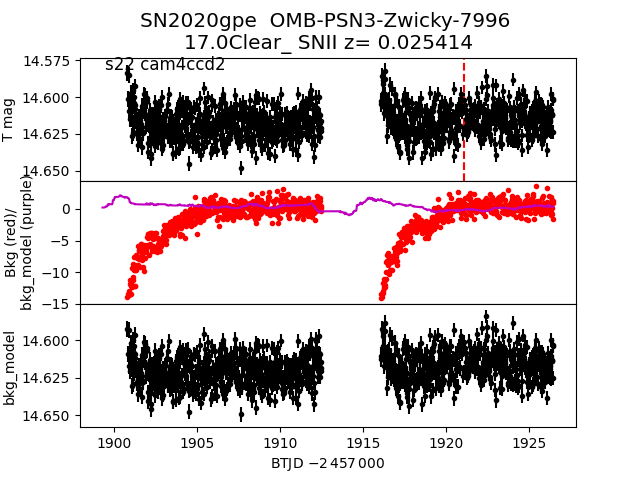
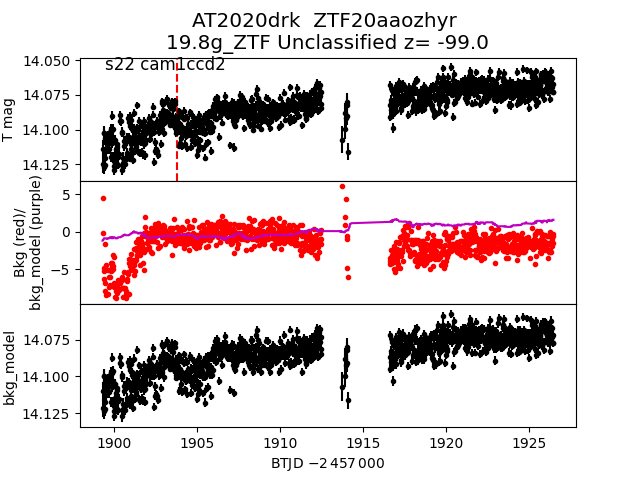
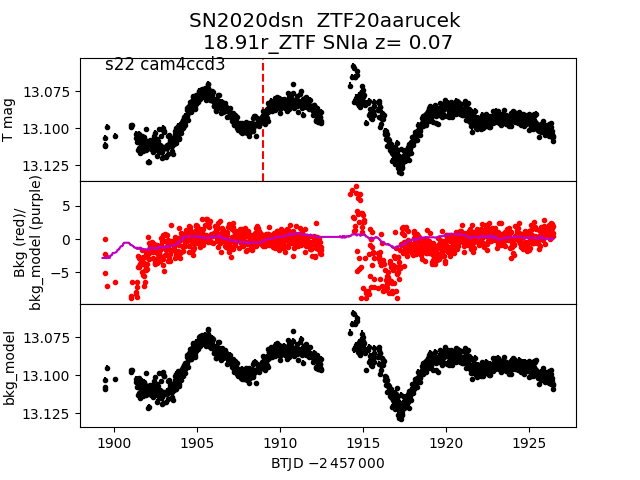
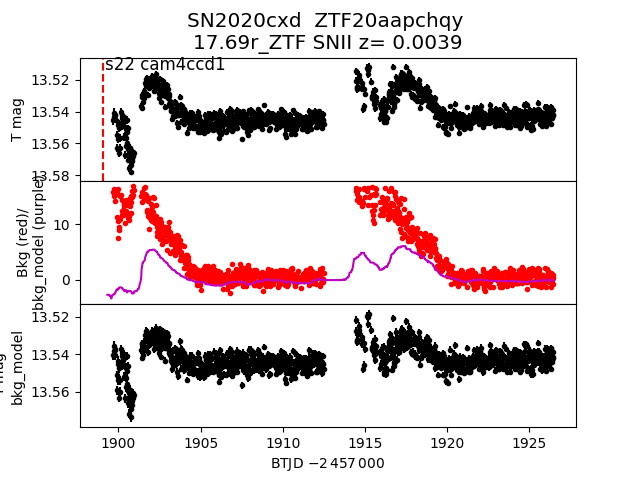
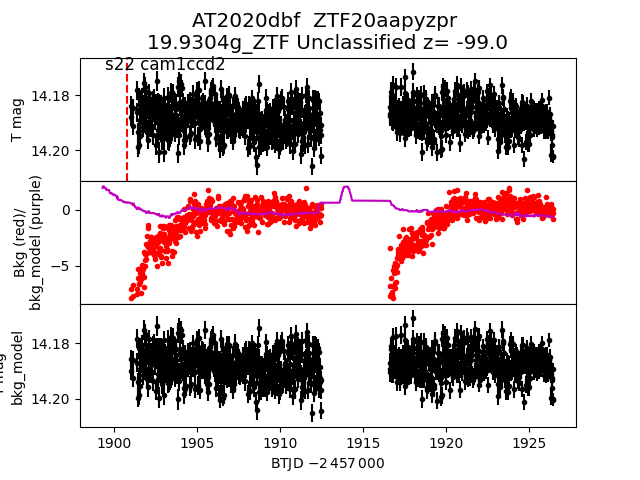
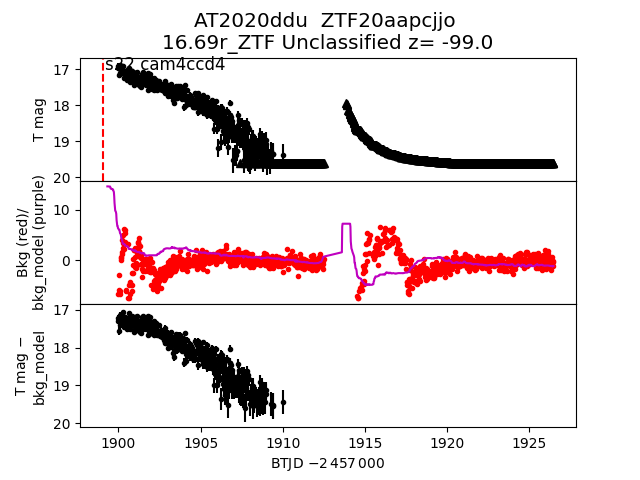
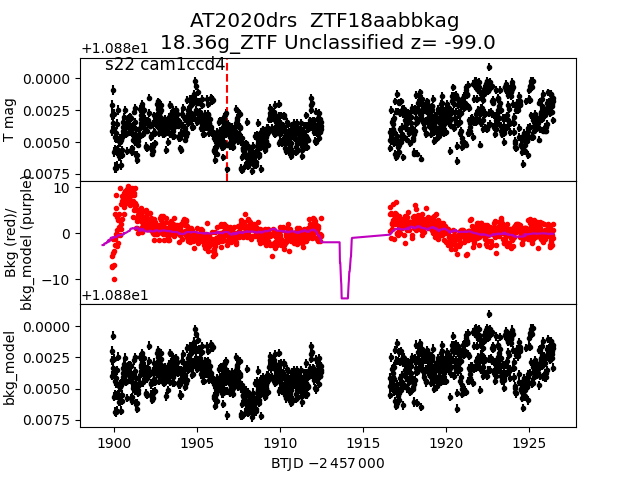
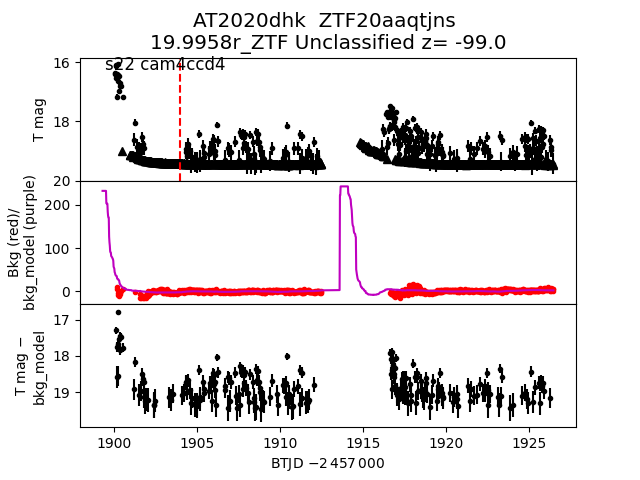
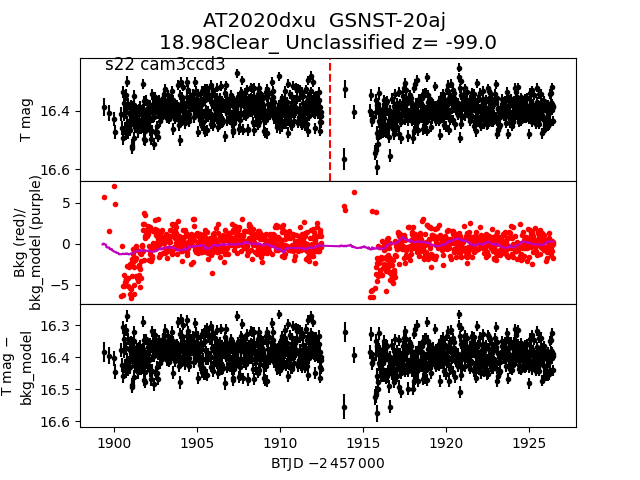
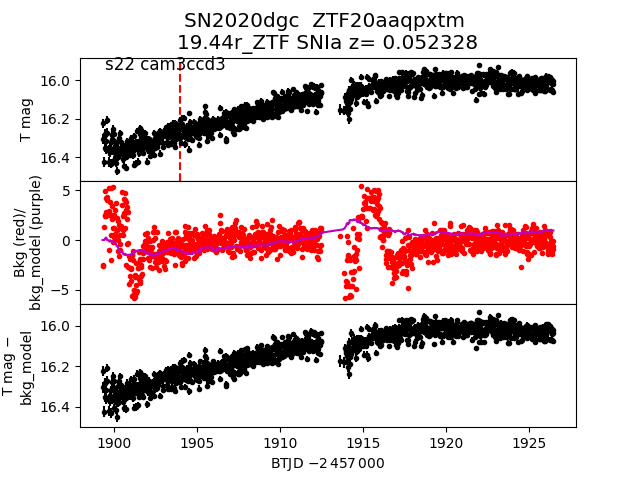
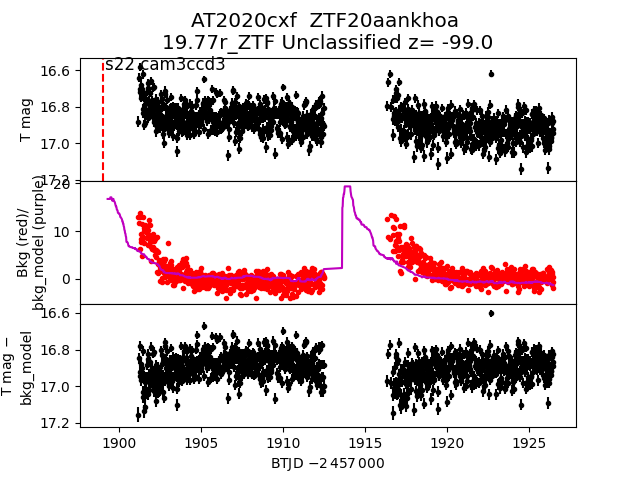
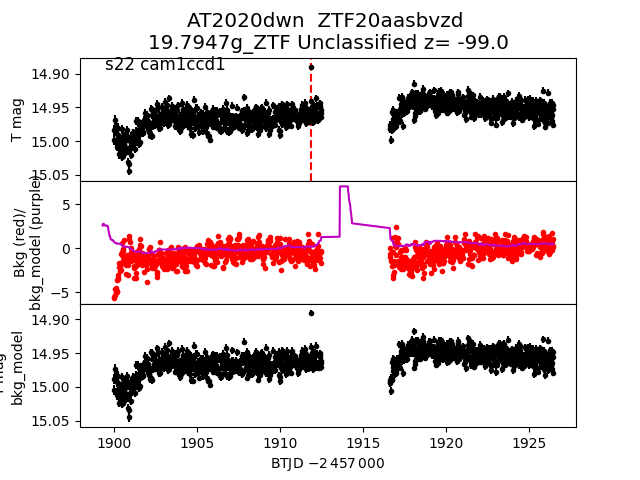
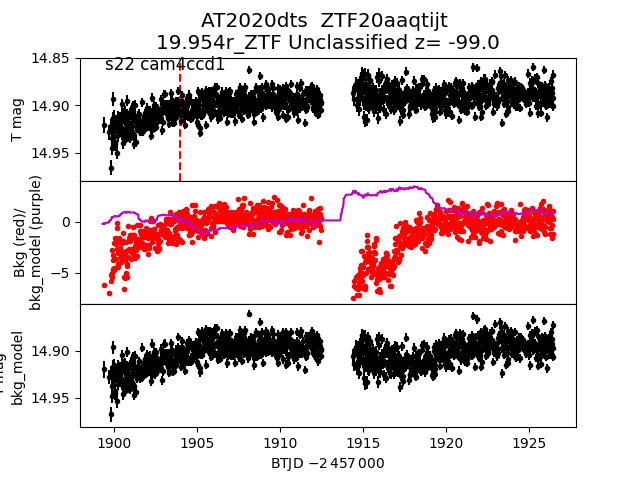
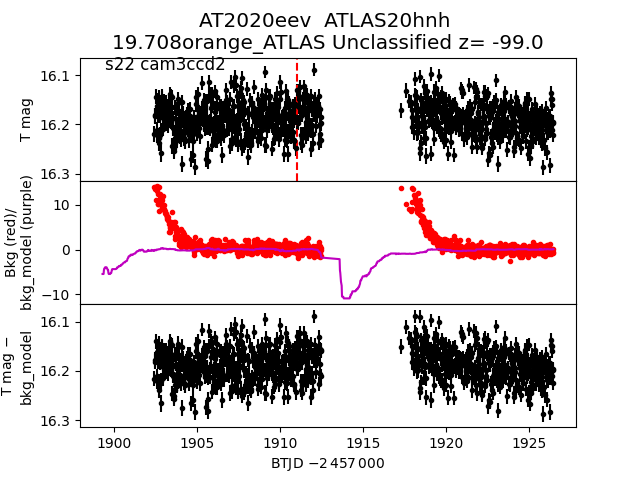
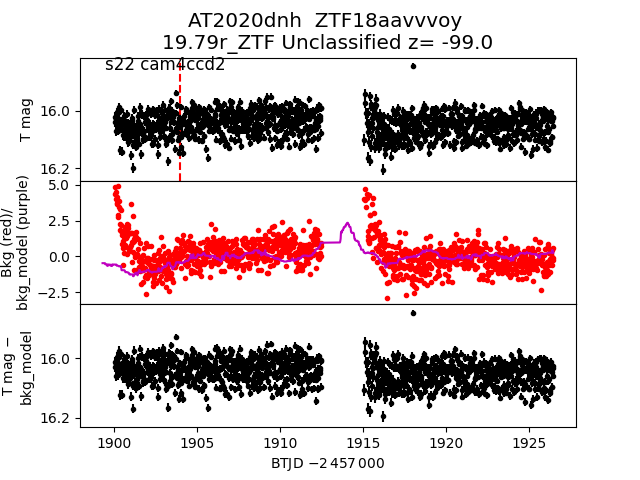
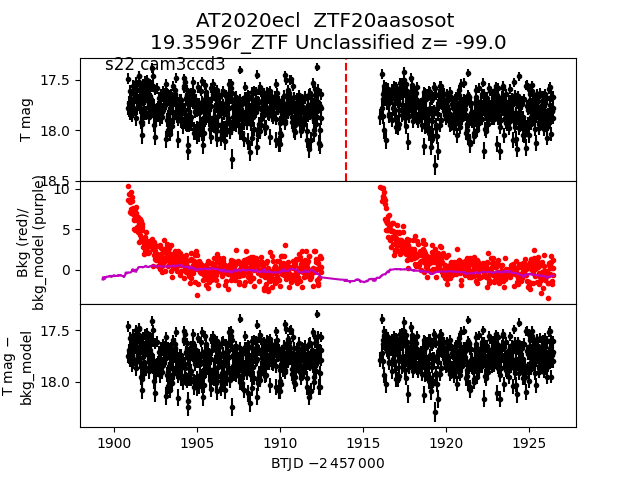
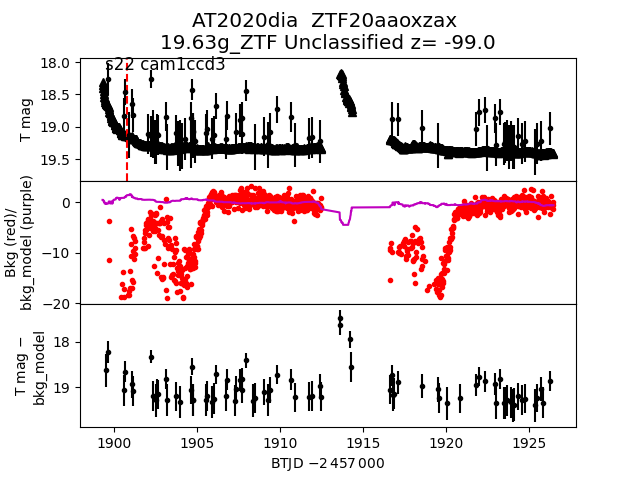
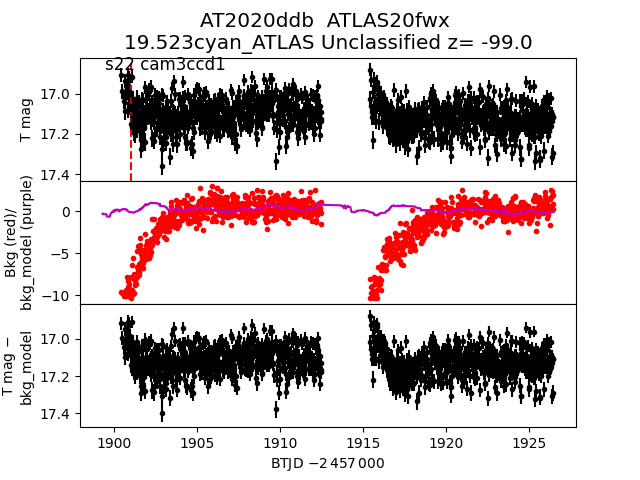
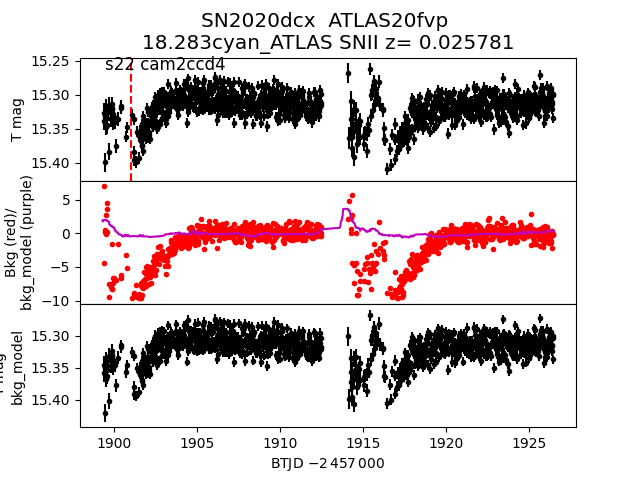
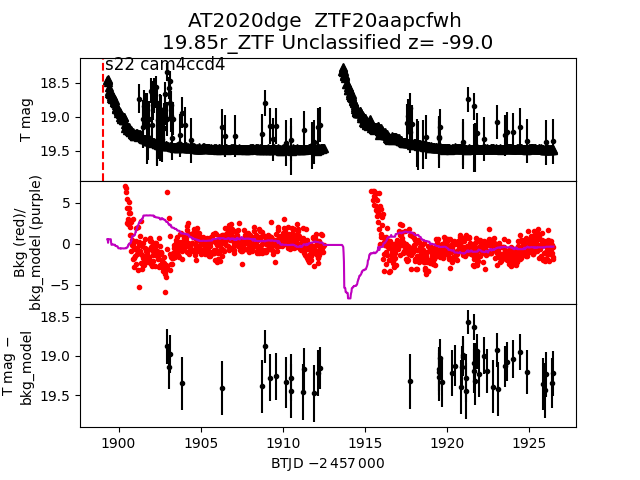
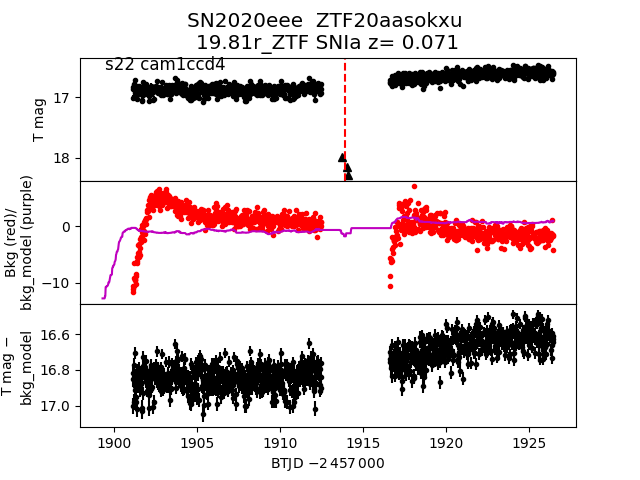
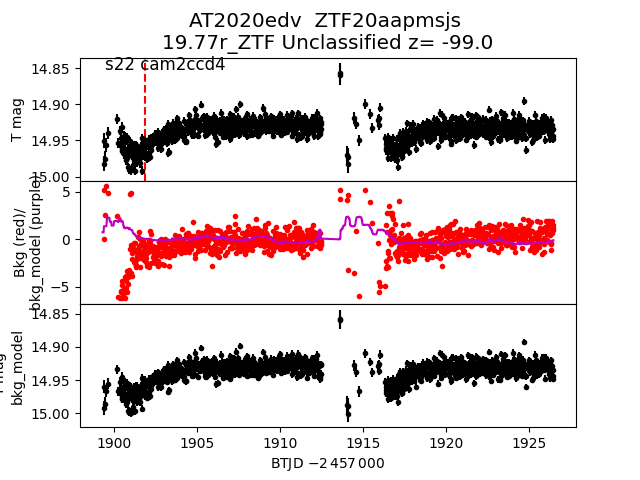
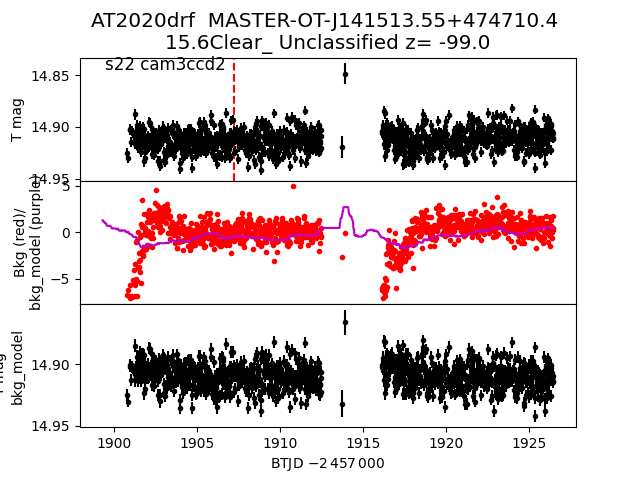
Each figure has three panels. The top panel shows the transient light curve, the middle panel shows the local background (estimated in an annulus), and the bottom panel shows a "background-model corrected" light curve. Details about the background model are in the README.
The vertical red line marks the time of discovery reported to TNS. Other useful metadata from TNS is in the figure title.
Note that the top and bottom panel are in magnitudes, while the middle panel is in differential flux units. The magnitudes are calibrated to the flux in the reference image used for image subtraction. Thus, flux from the host galaxy is included in these magnitudes.
3-sigma upper limits are plotted as triangles with no errorbars. A typical limiting magnitude is 19.6 in 30 minutes or 18.4 in 200 seconds (for low backgrounds).
The links allow you to download the light curve data as a text file.
More details in the README.
2020dra
 2020ddi
 2020eek
 2020djw
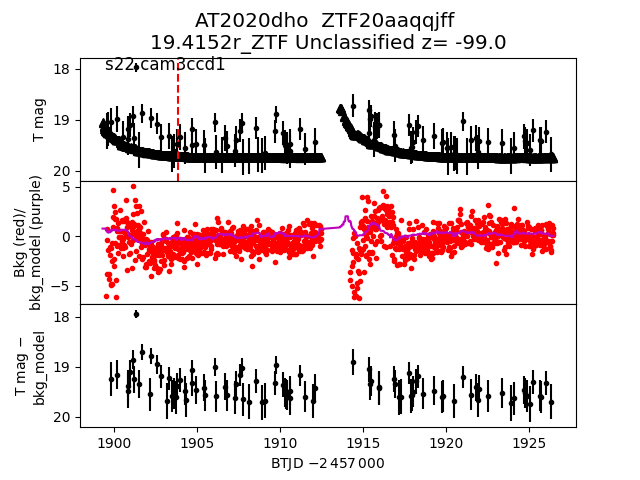
 2020dho
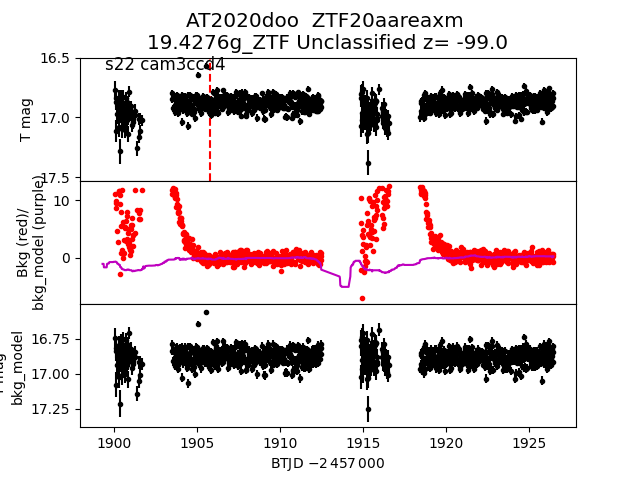
 2020doo
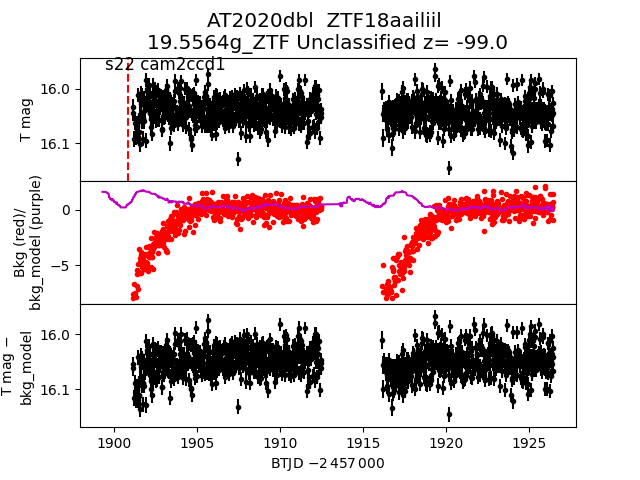
 2020dbl
 2020dop
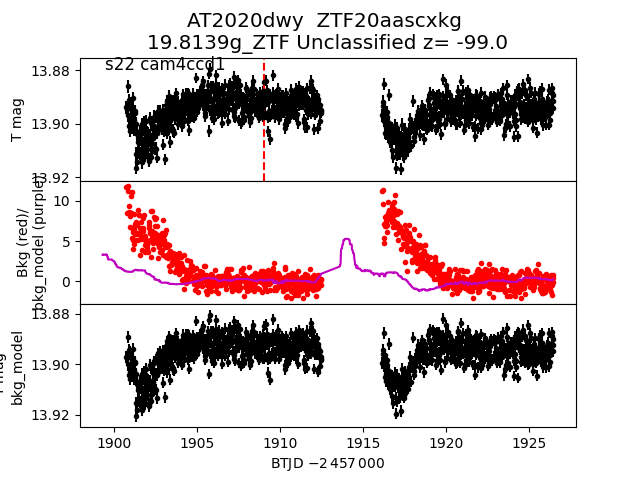
 2020dwy
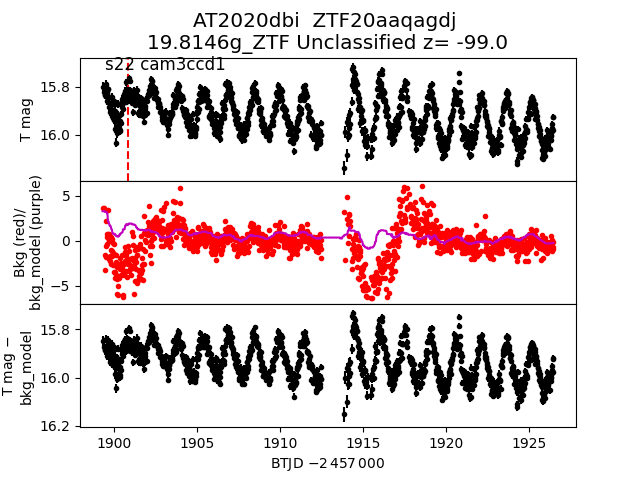
 2020dbi
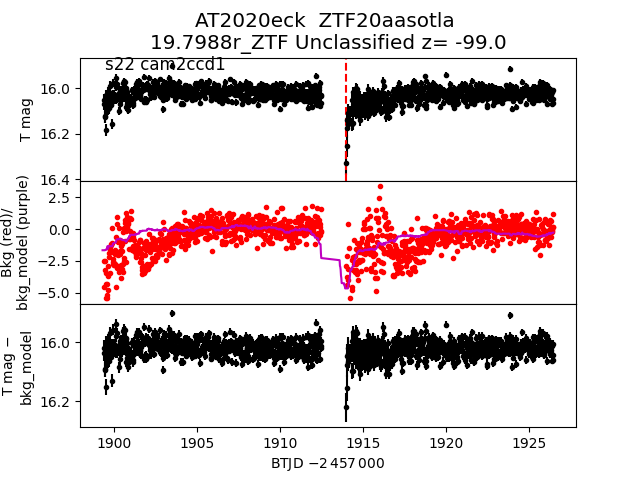
 2020eck
 2020ect
 2020dnf
 2020dvo
 2020dwj
 2020dtw
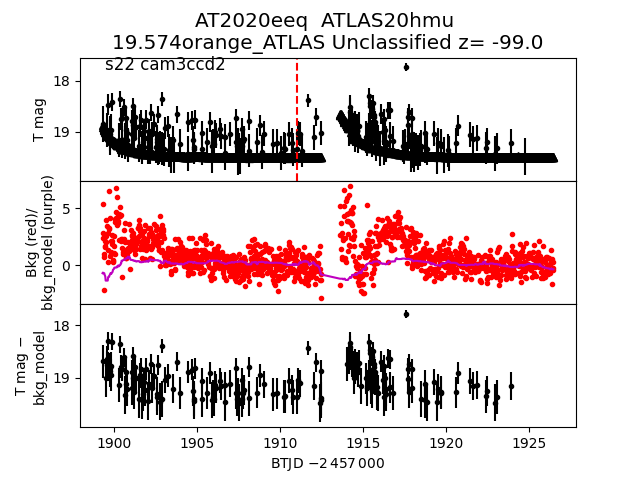
 2020eeq
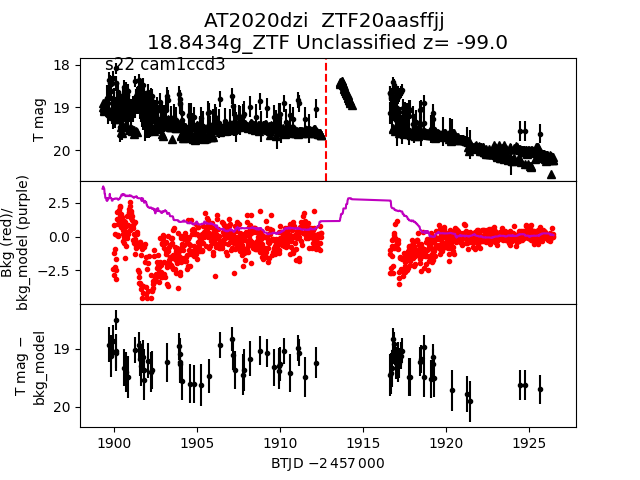
 2020dzi
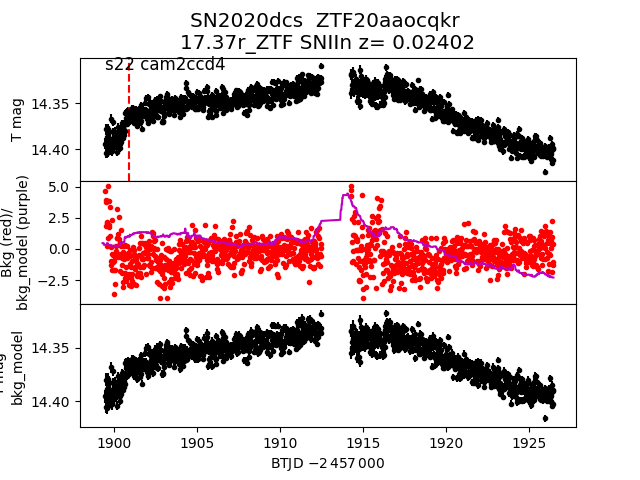
 2020dcs
 2020dyt
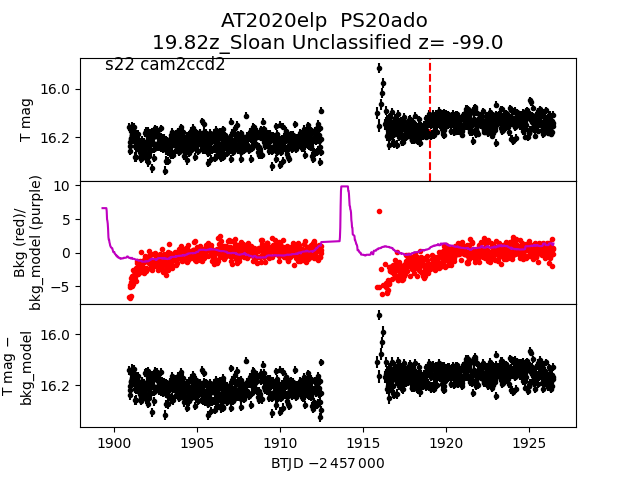
 2020elp
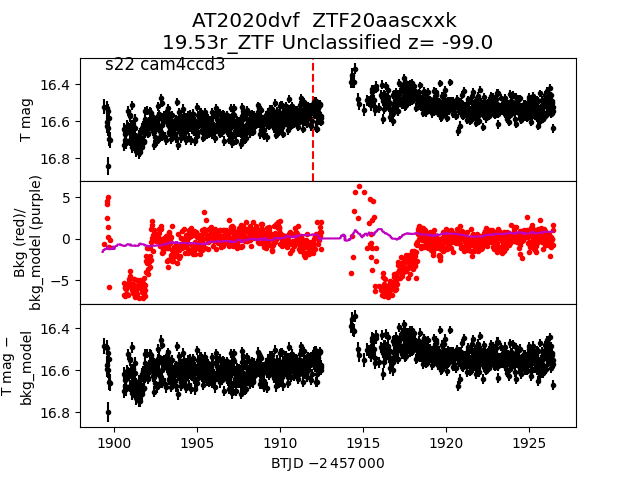
 2020dvf
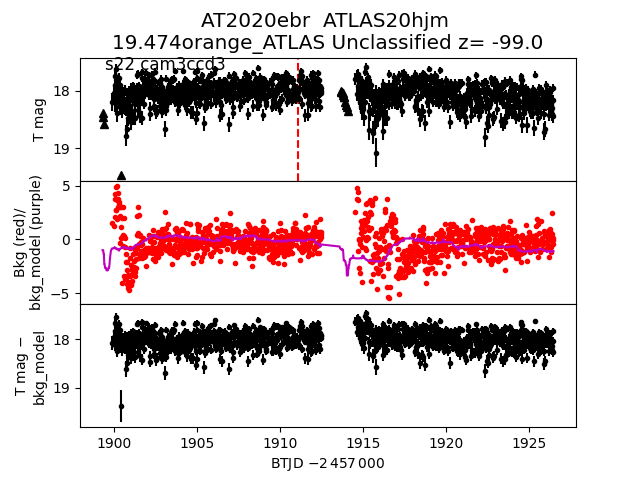
 2020ebr
 2020cym
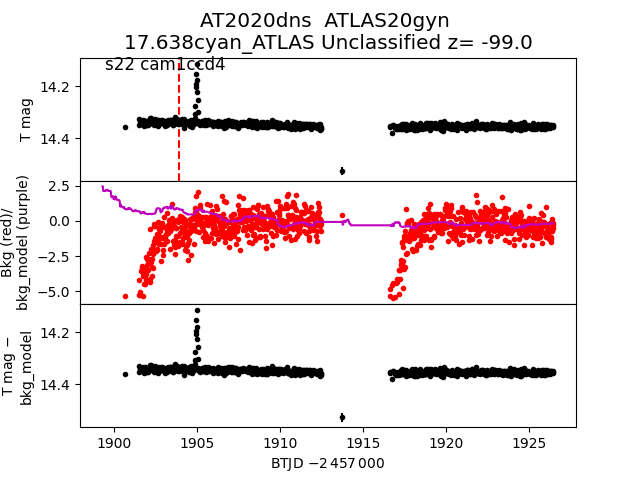
 2020dns
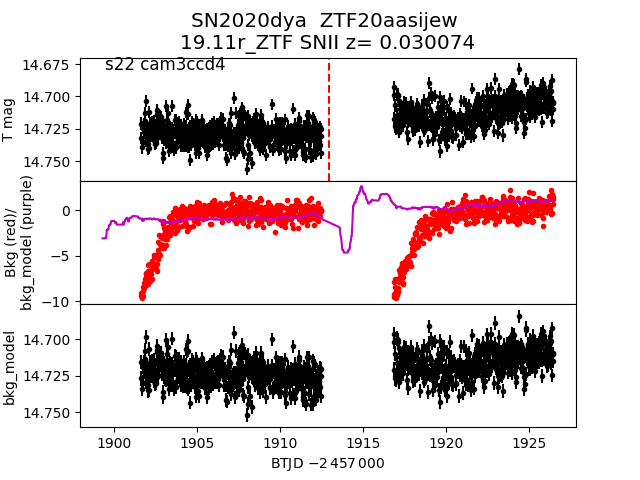
 2020dya
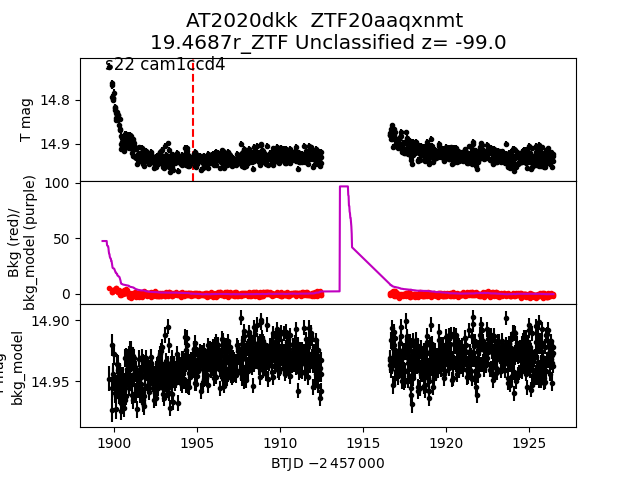
 2020dkk
 2020gpe
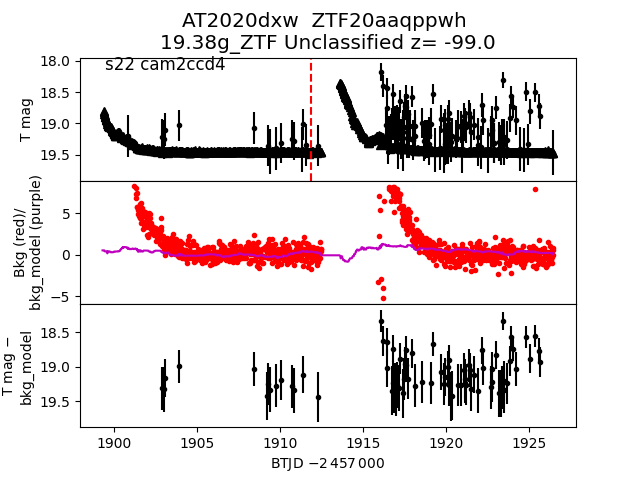
 2020dxw
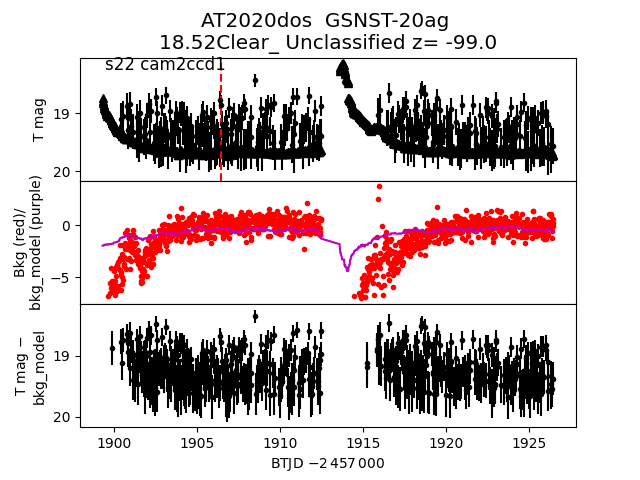
 2020dos
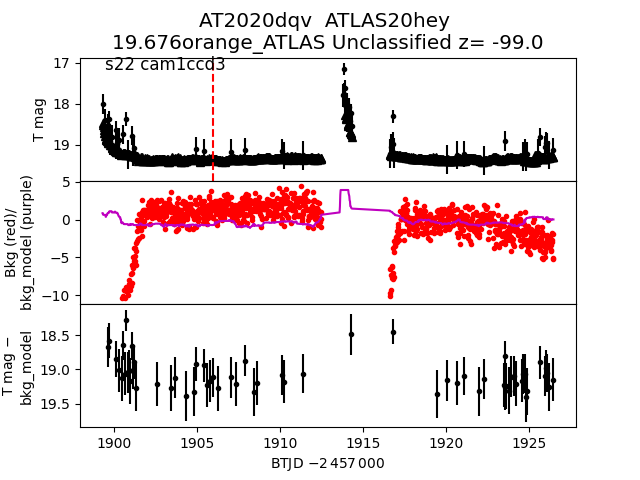
 2020dqv
 2020drk
 2020dsn
 2020cxd
 2020dbf
 2020ddu
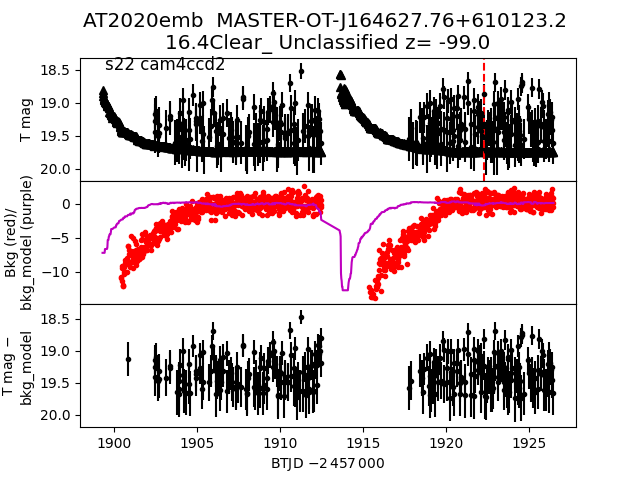
 2020emb
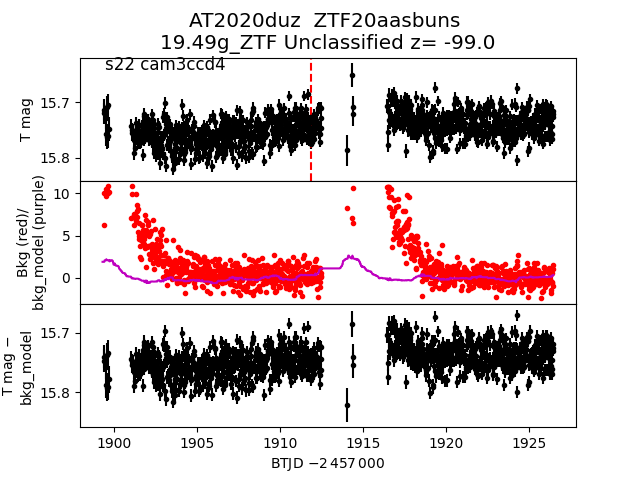
 2020duz
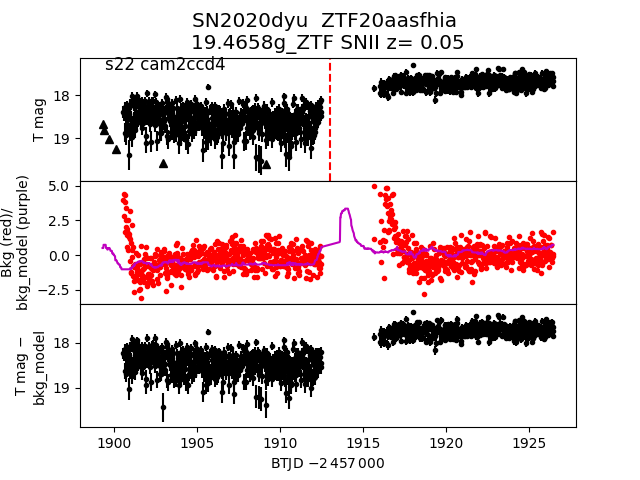
 2020dyu
 2020drs
 2020dhk
 2020dxu
 2020dgc
 2020cxf
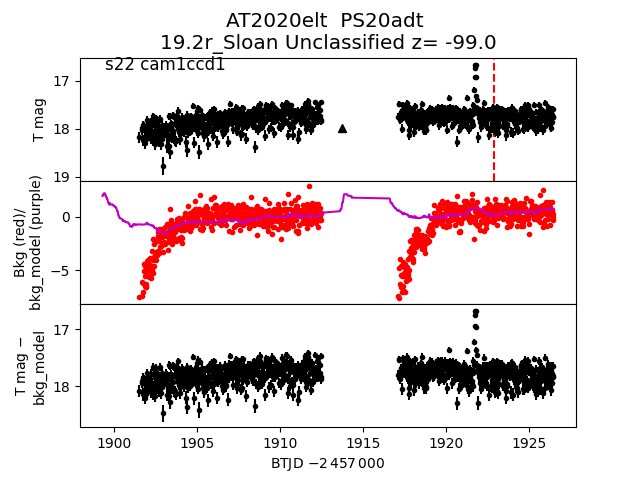
 2020elt
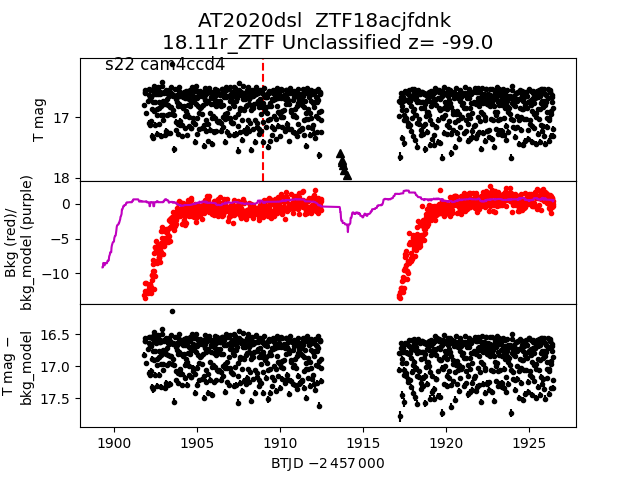
 2020dsl
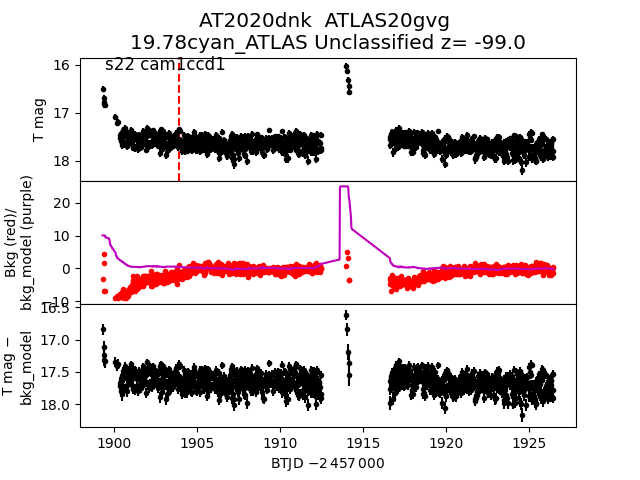
 2020dnk
 2020dwn
 2020dts
 2020eev
 2020dnh
 2020ecl
 2020dia
 2020ddb
 2020dcx
 2020dge
 2020eee
 2020edv
 2020drf
 2020dry