all transients in sector20 (121 total)
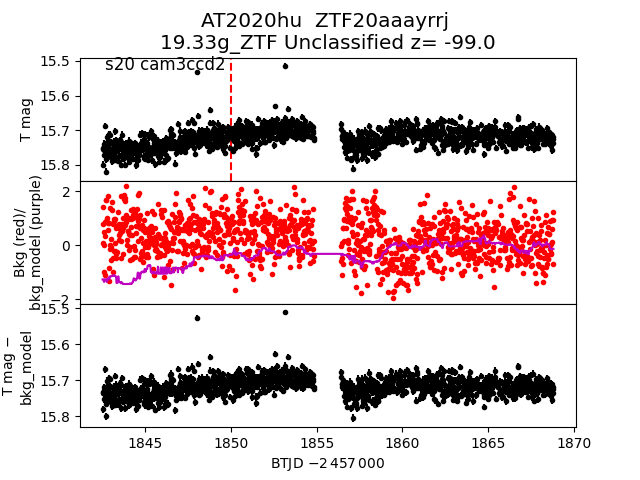
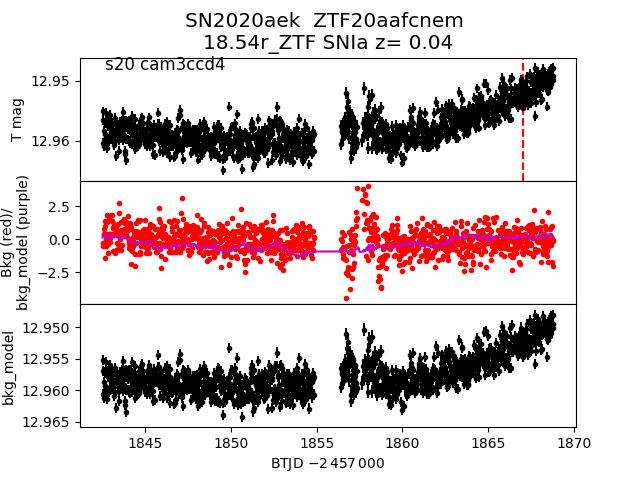
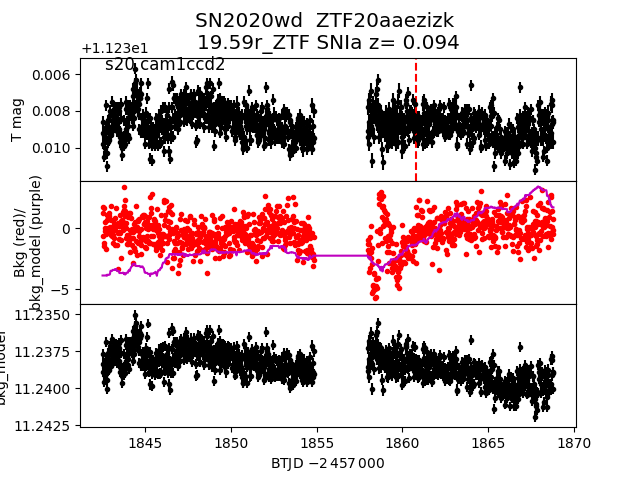
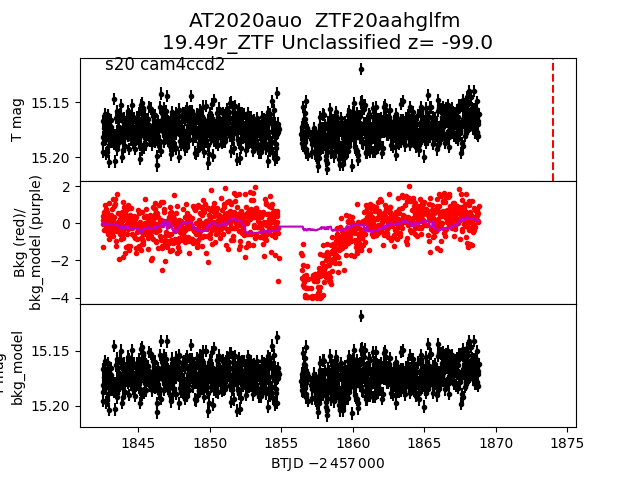
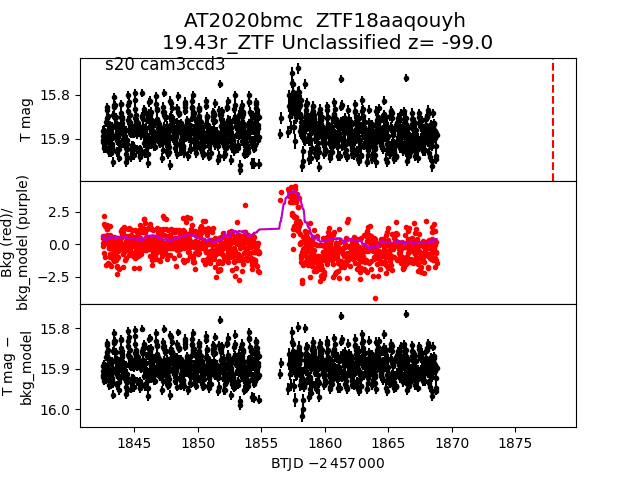
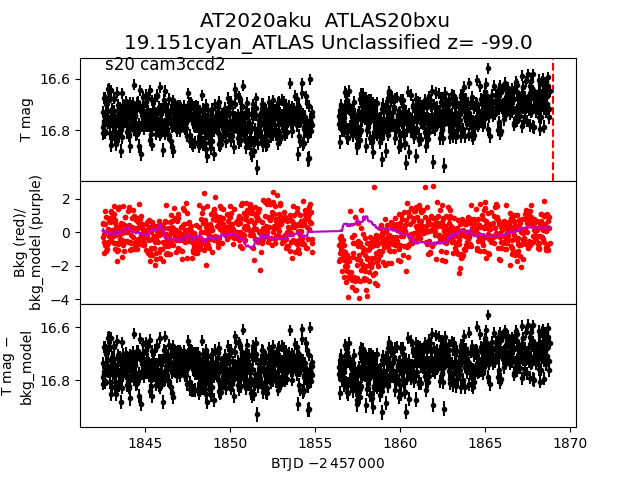
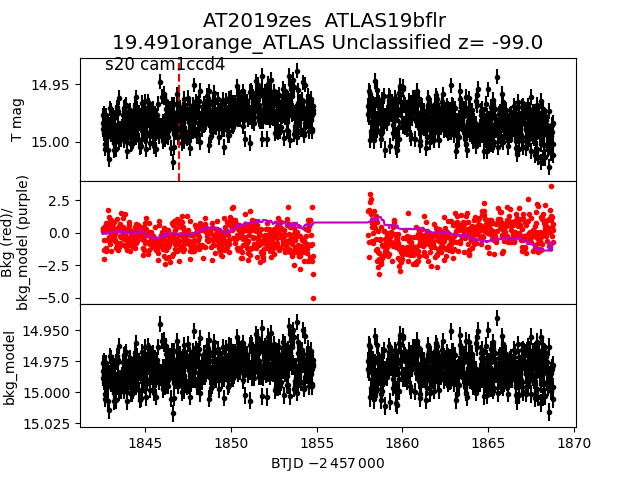
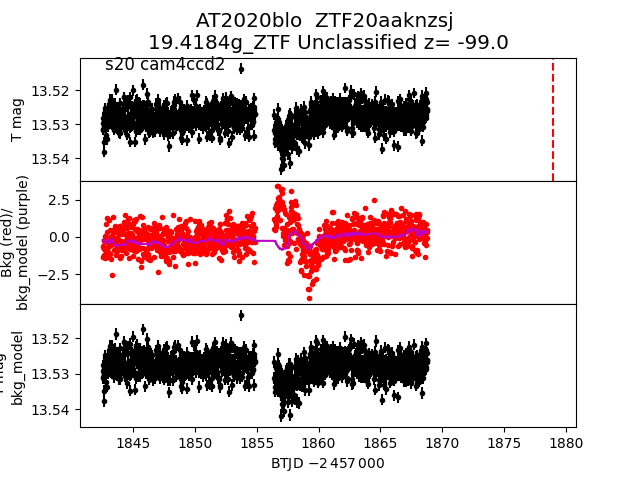
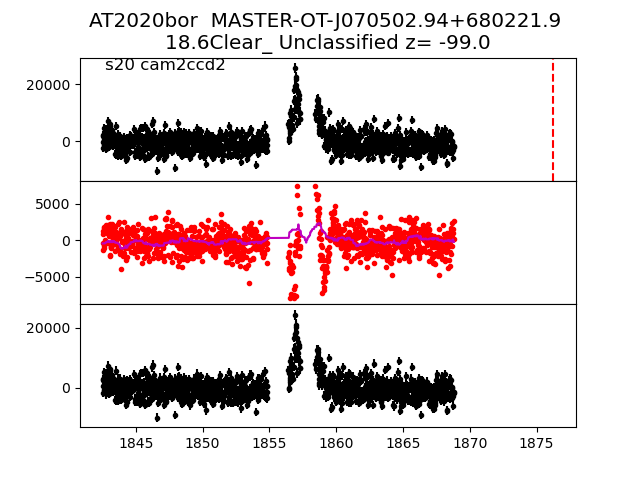
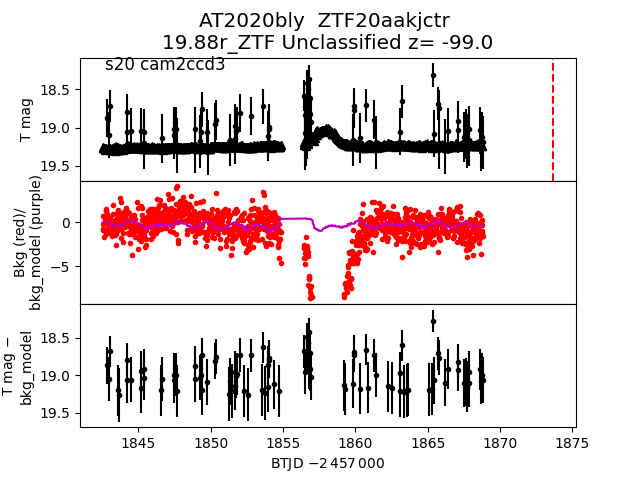
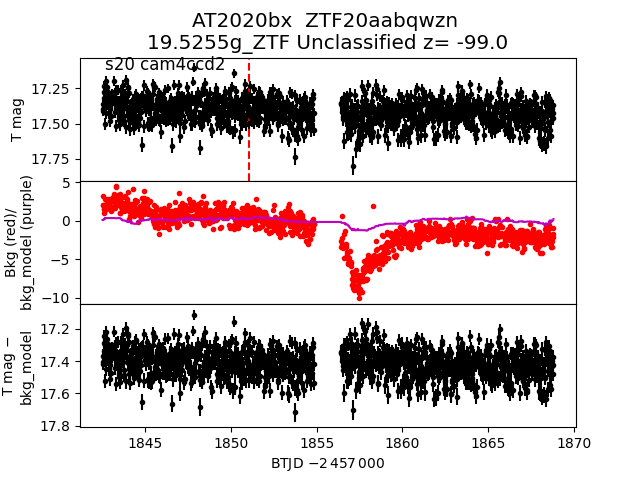
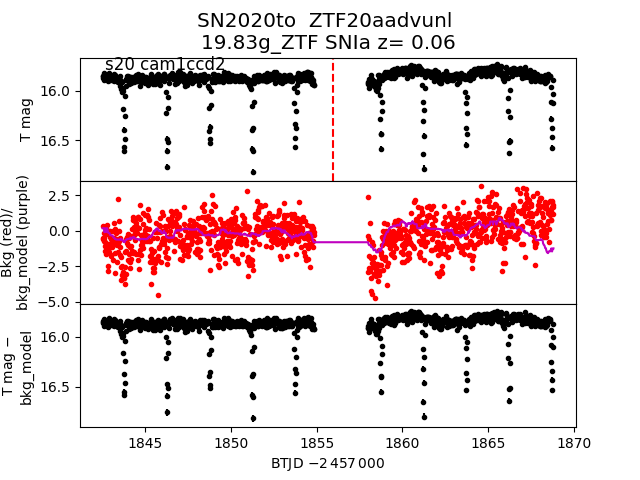
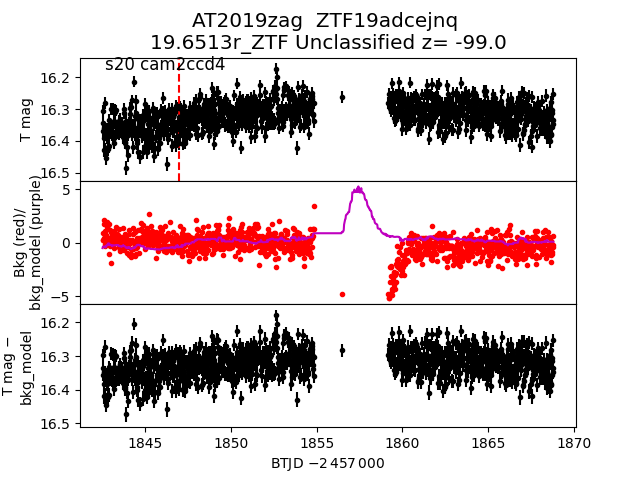
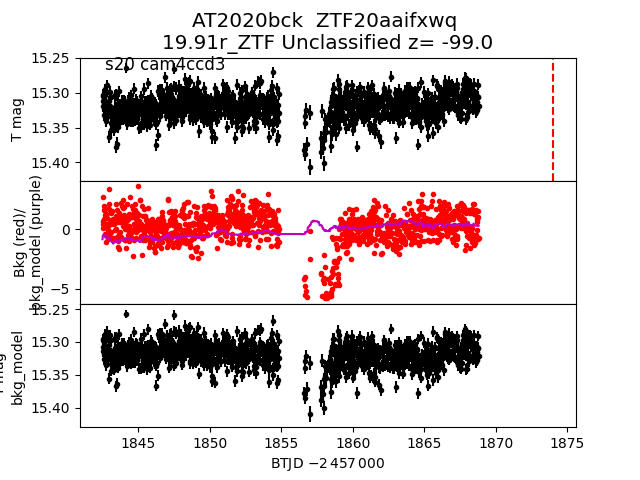
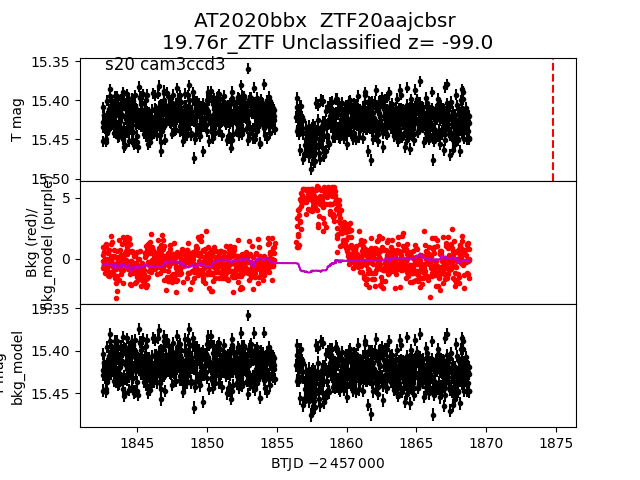
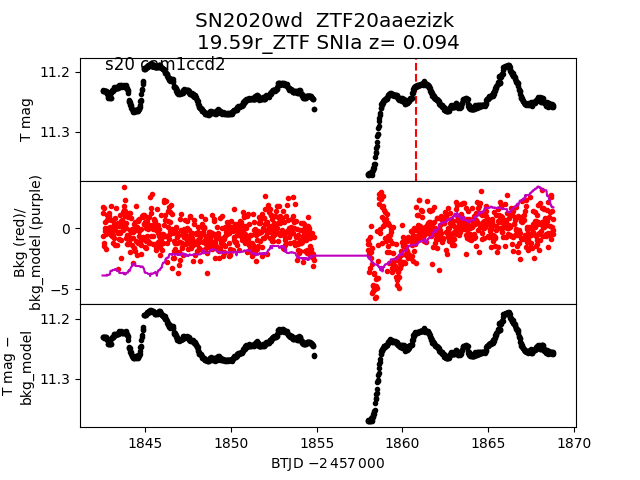
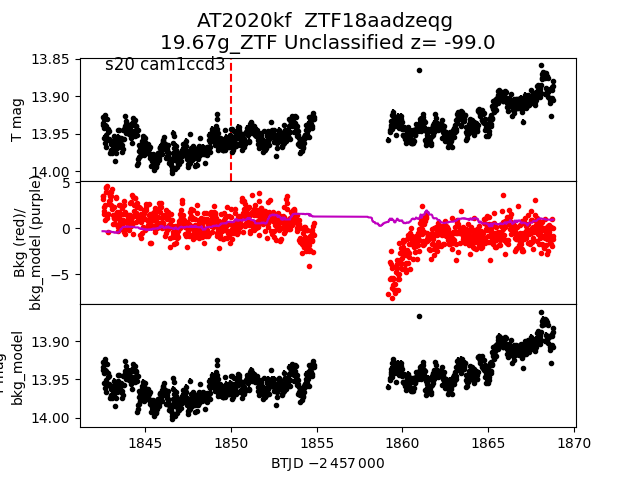
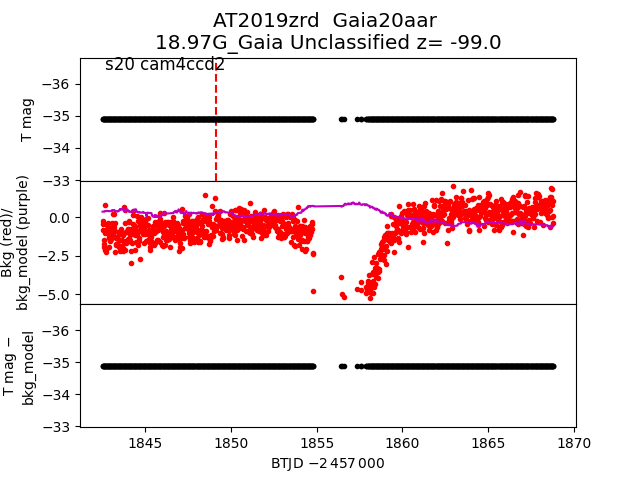
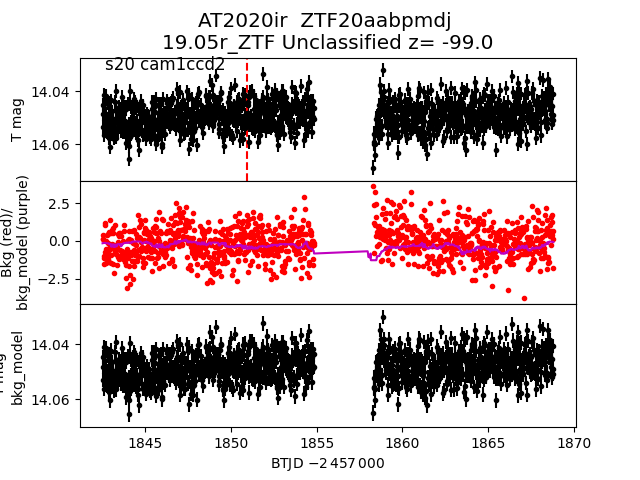
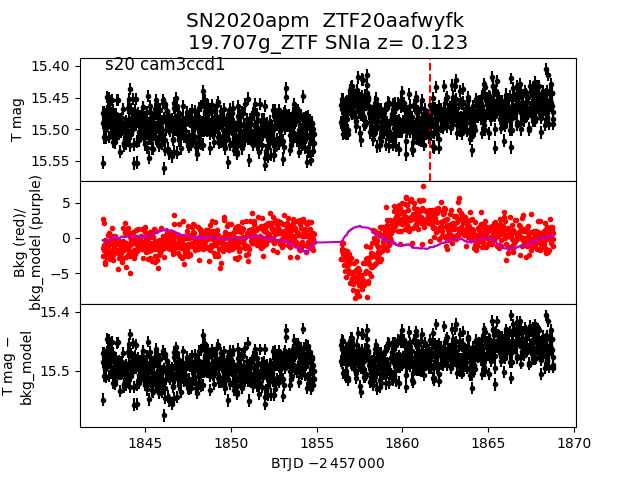
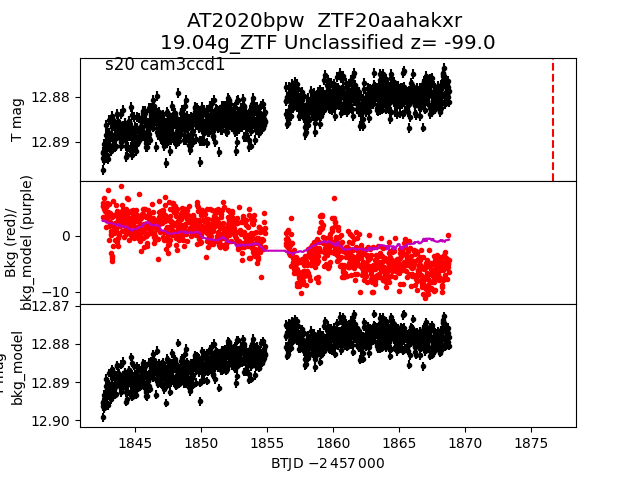
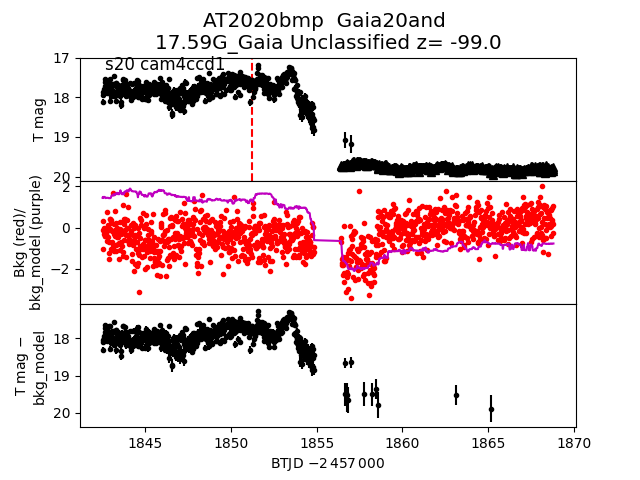
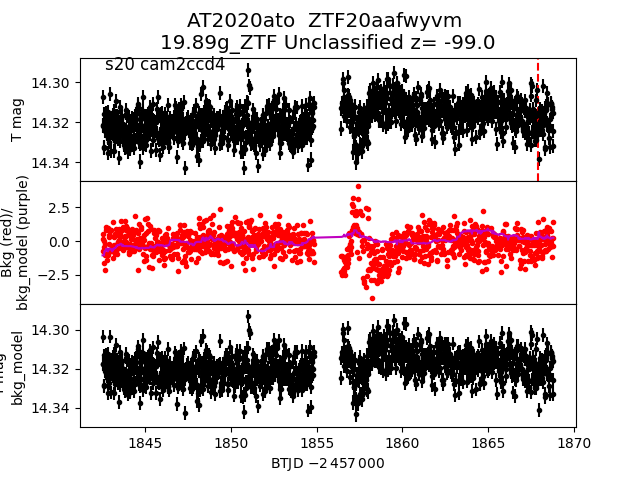
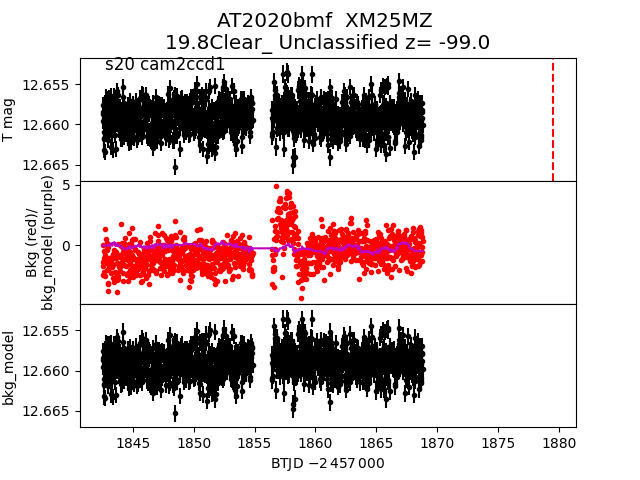
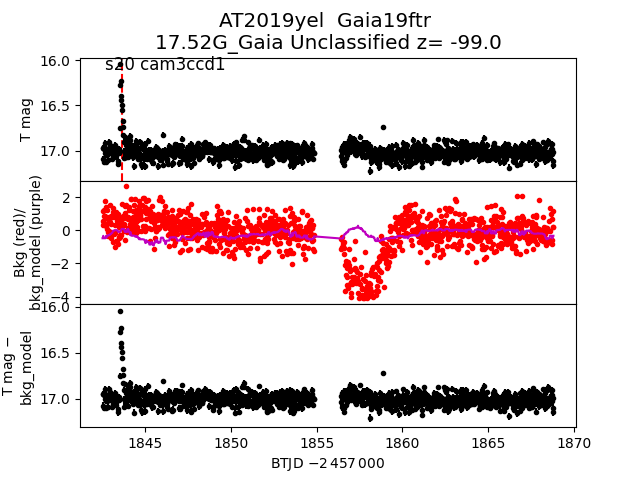
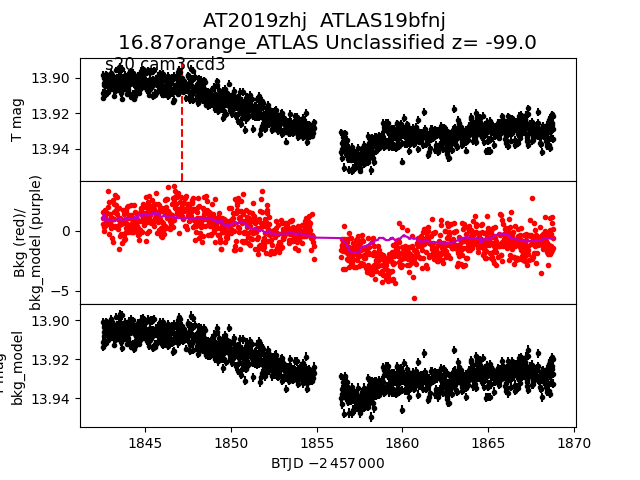
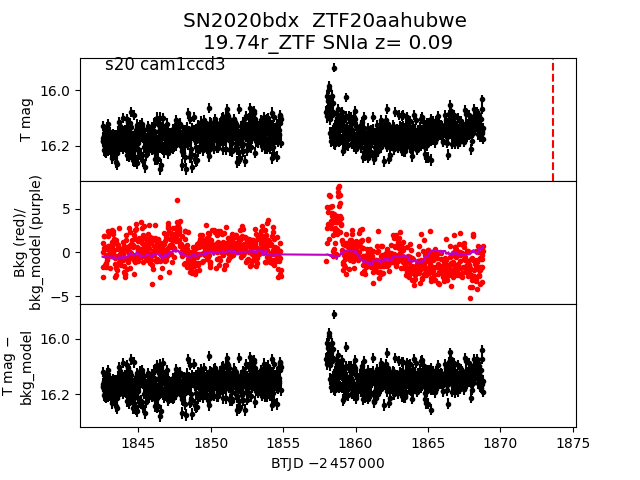
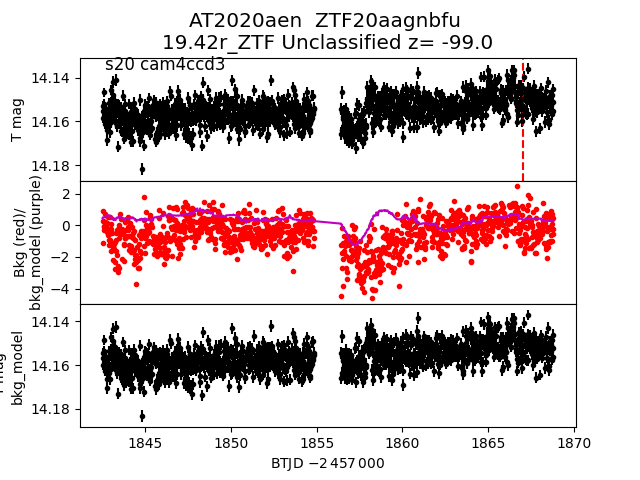
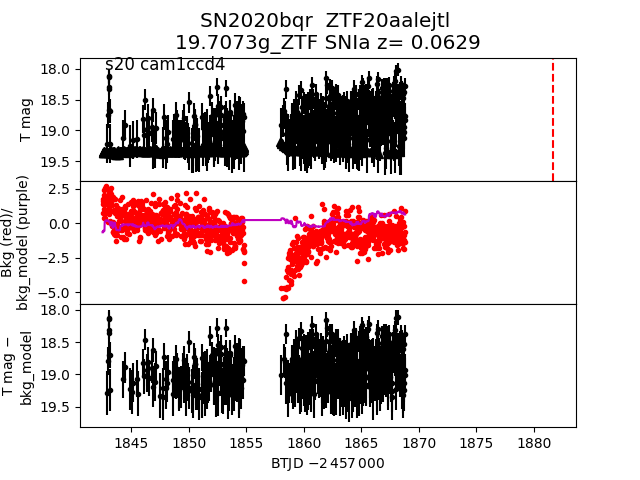
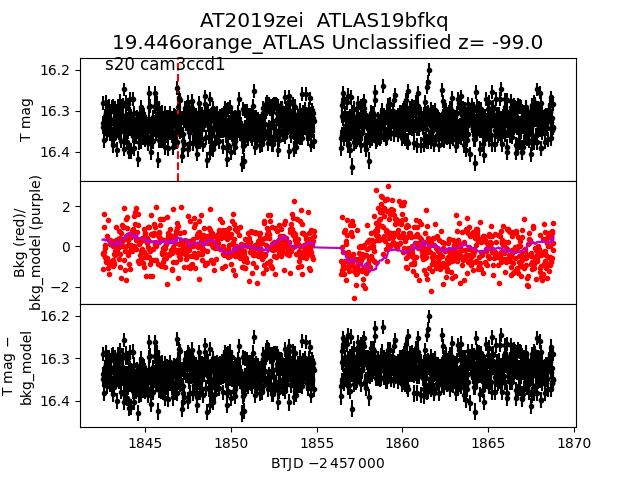
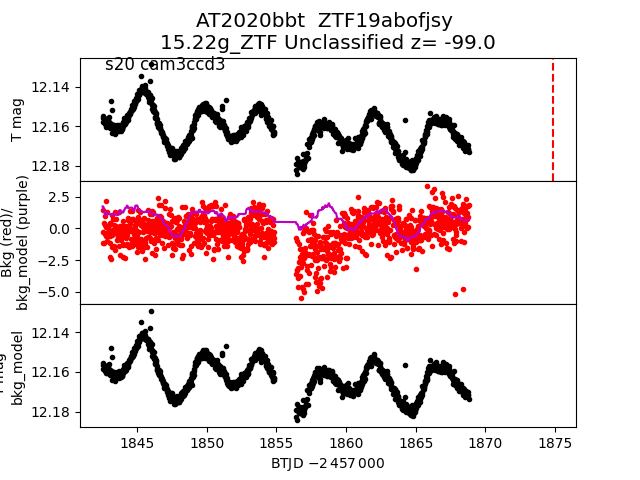
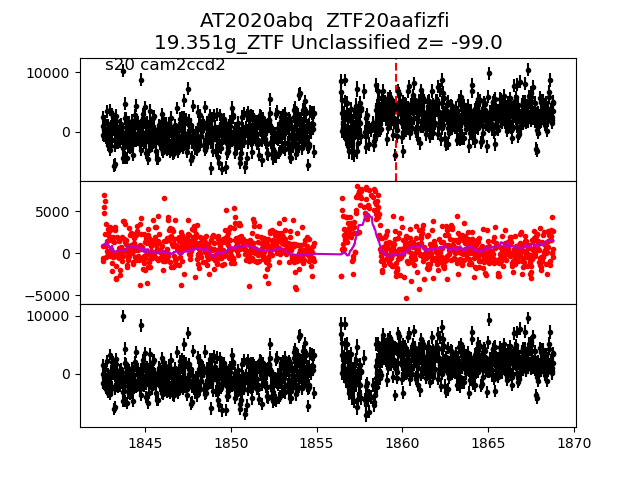
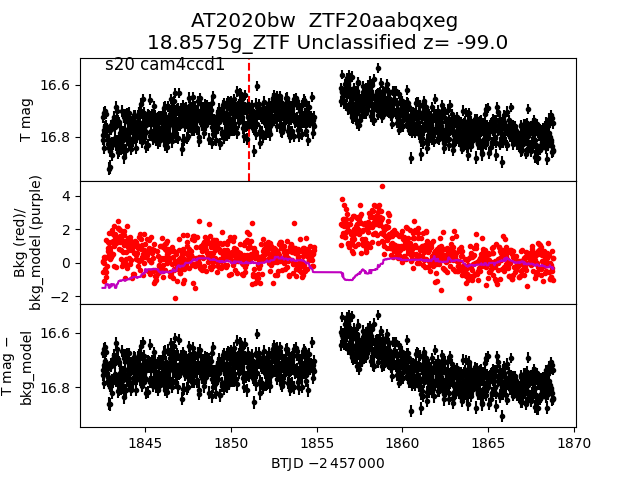
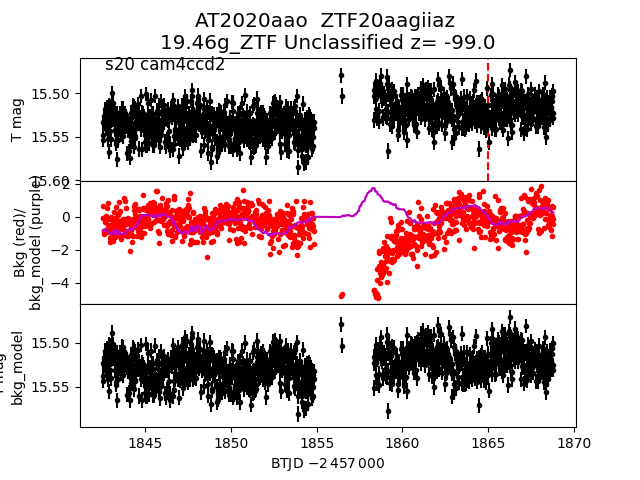
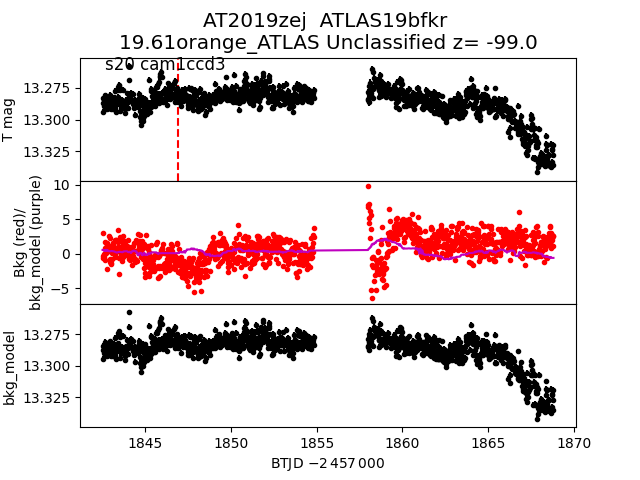
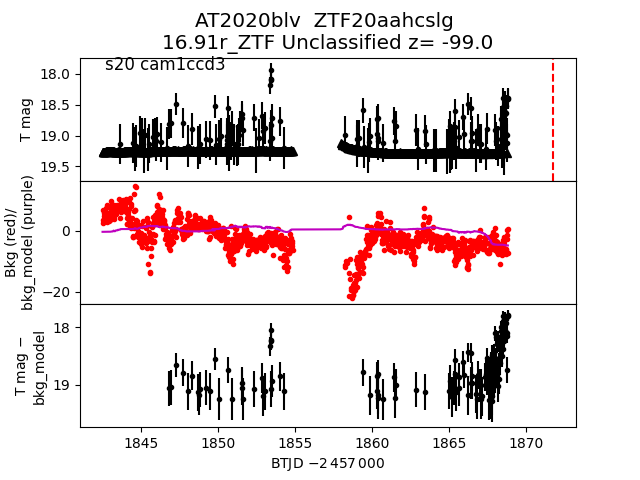
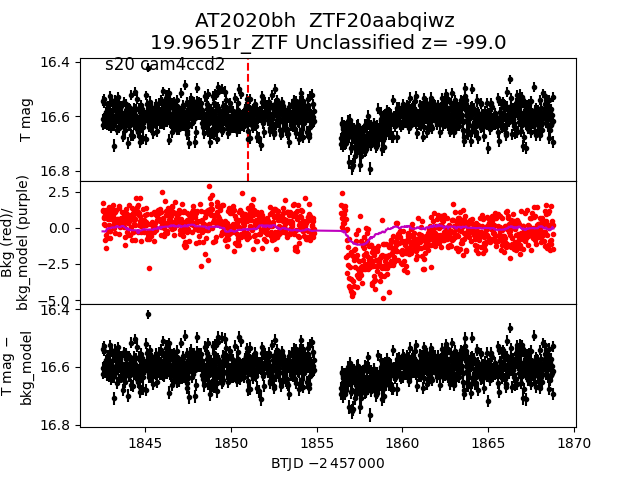
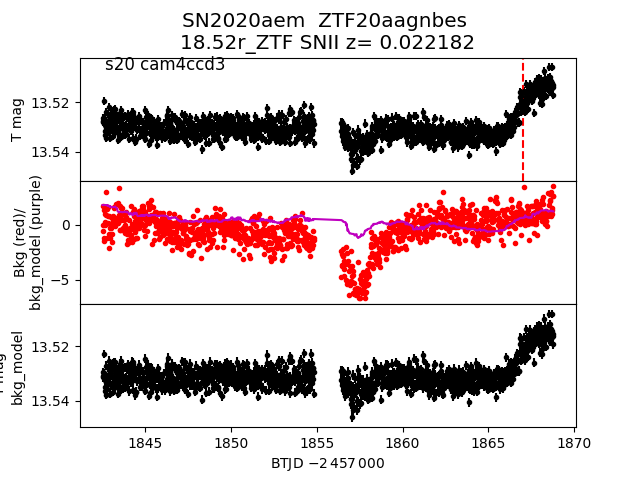
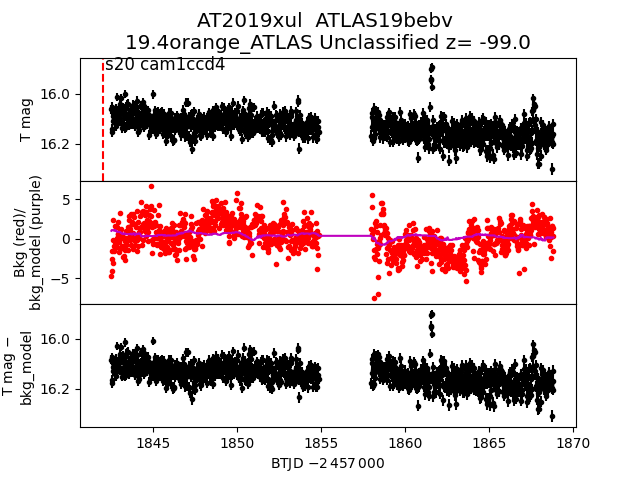
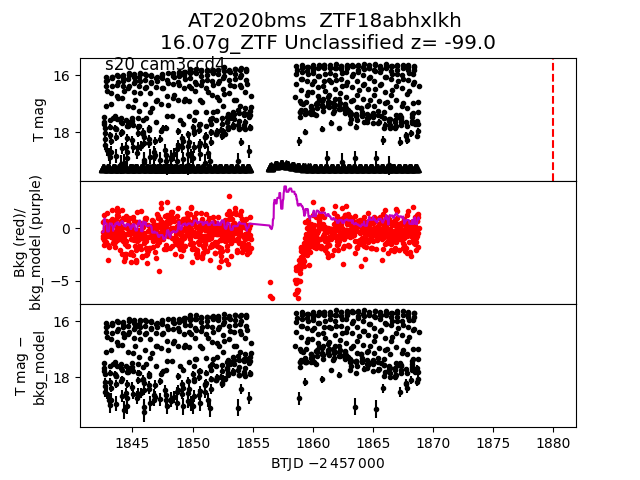
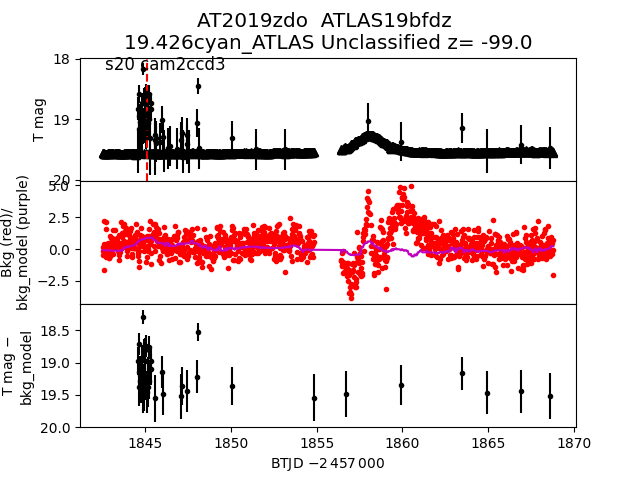
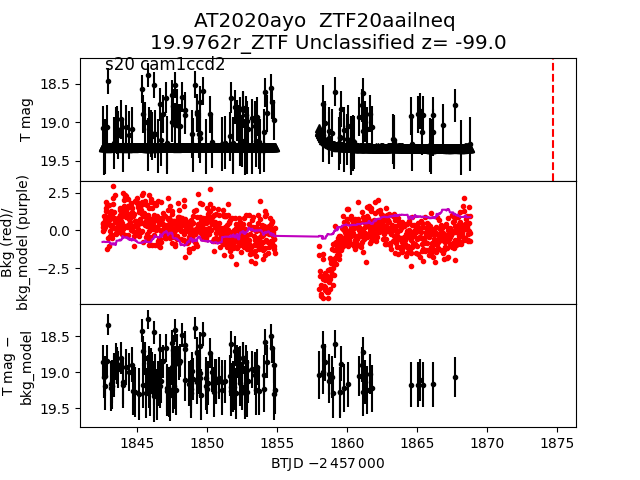
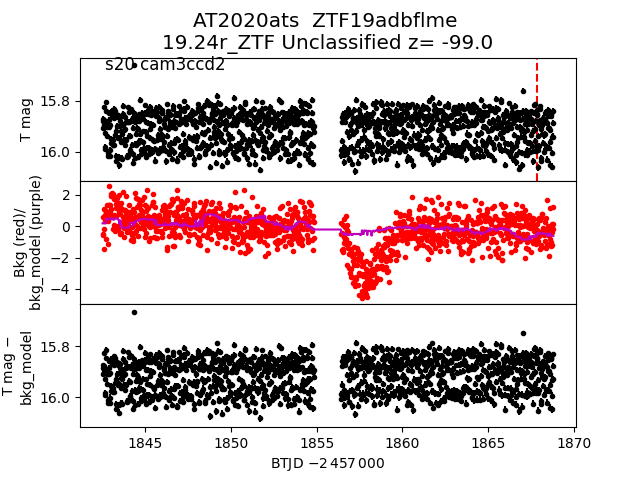
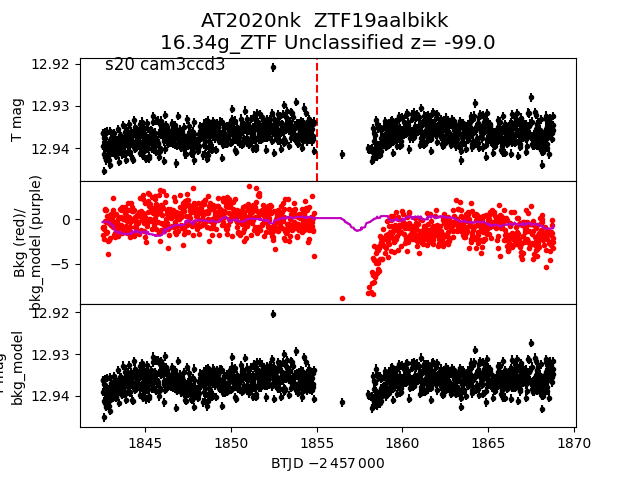
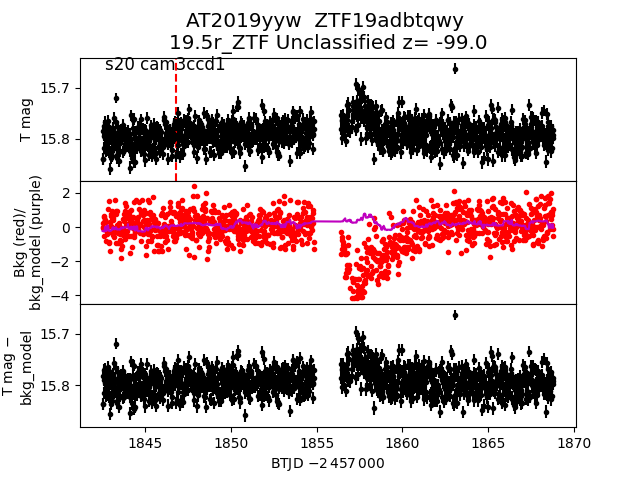
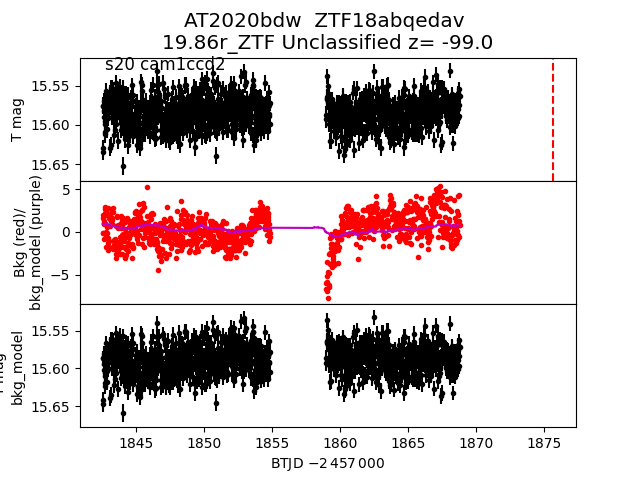
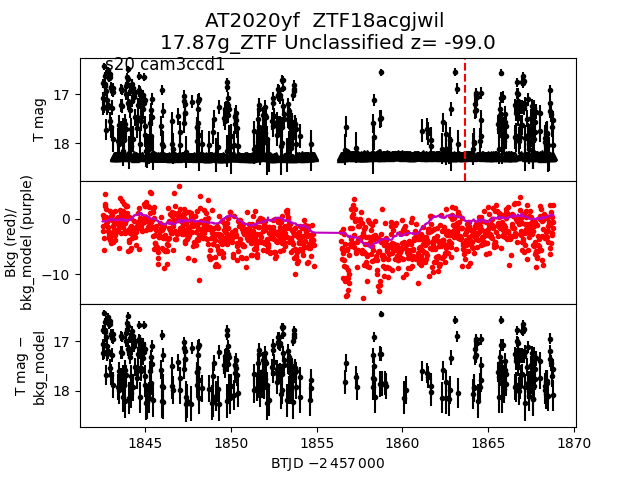
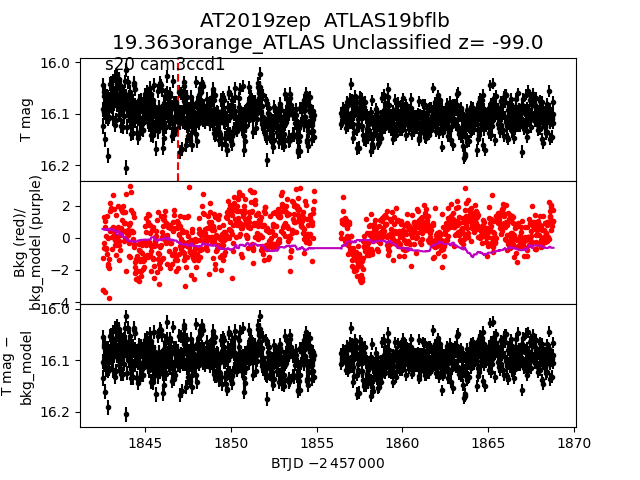
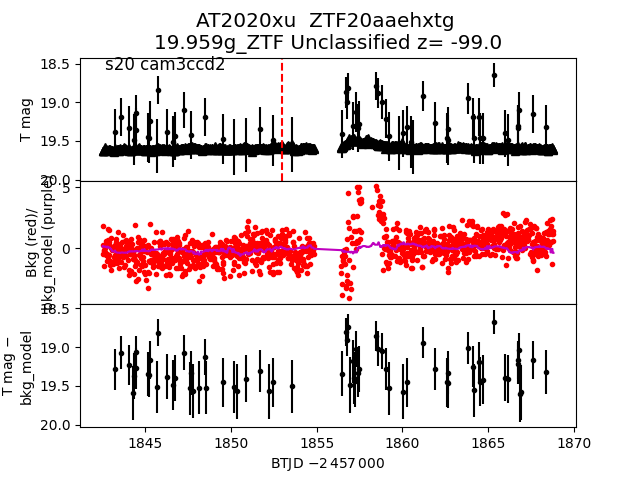
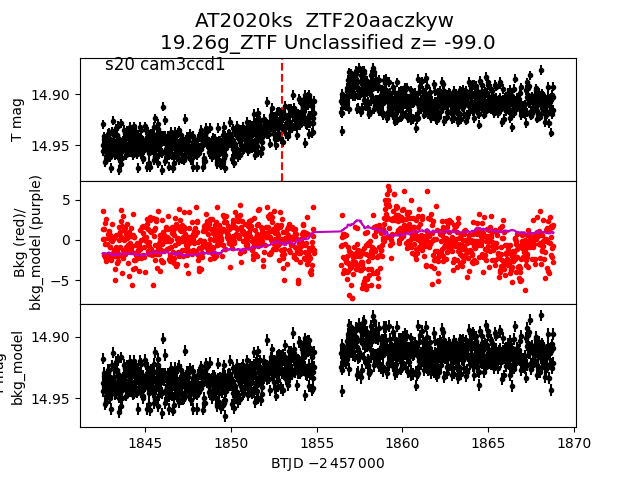
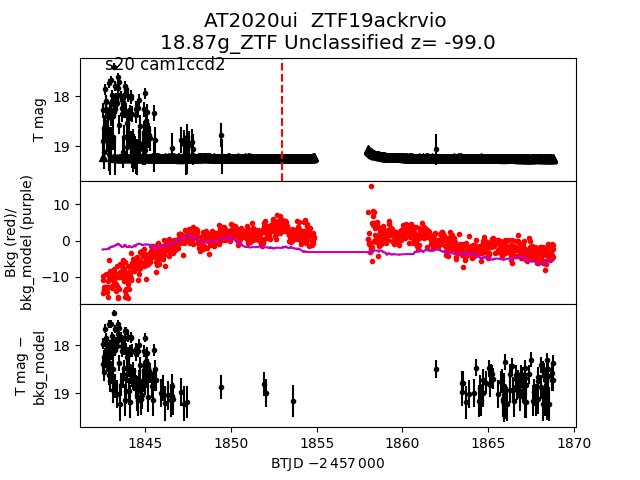
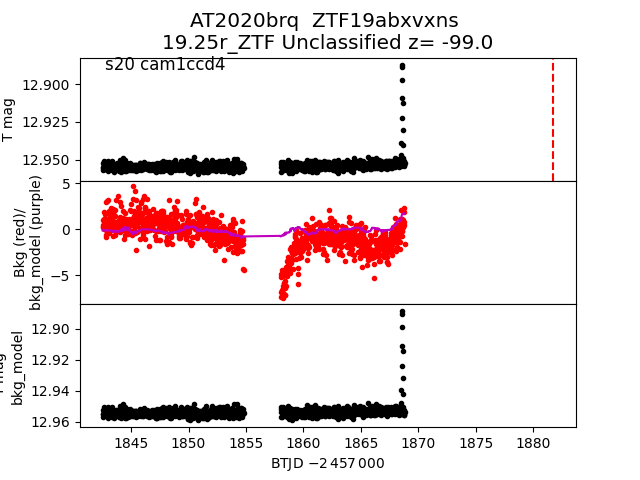
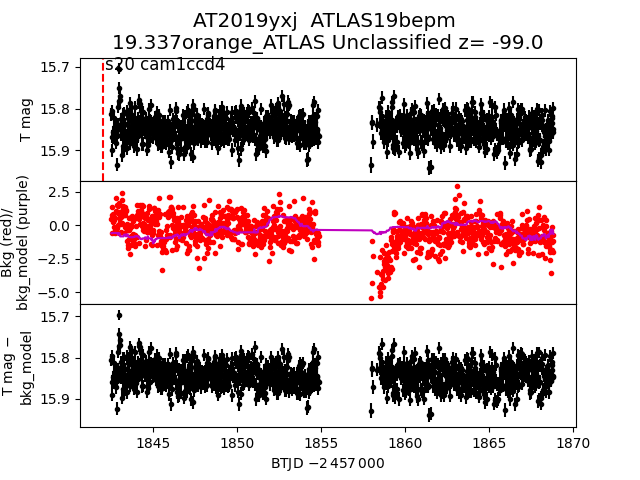
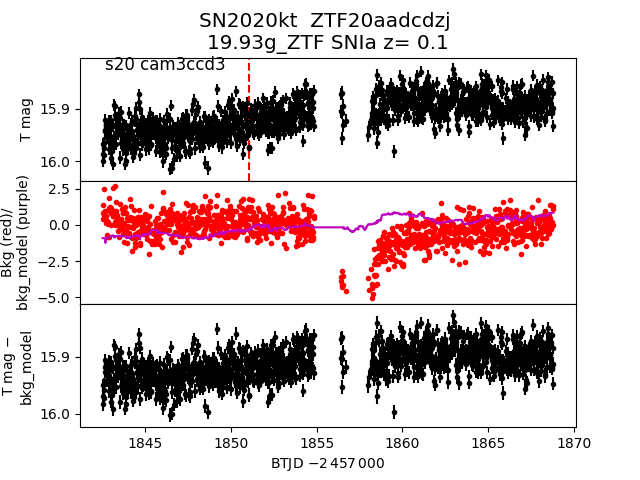
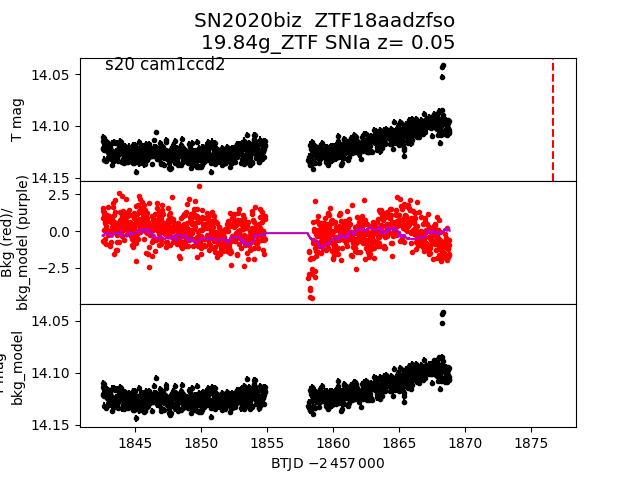
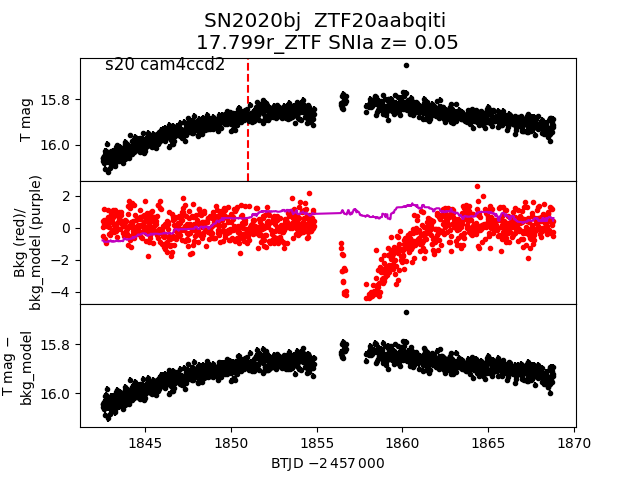
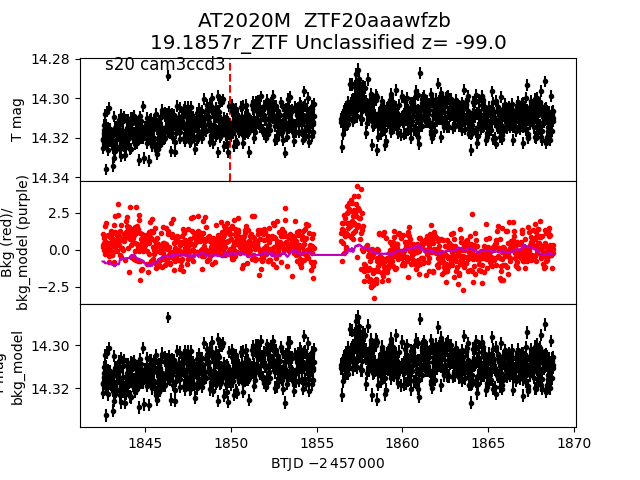
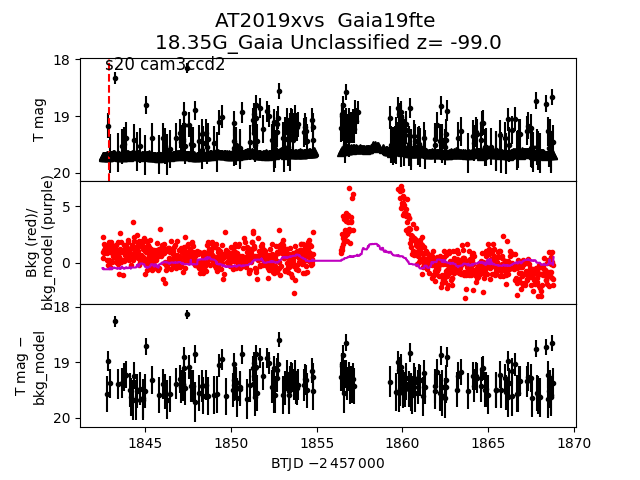
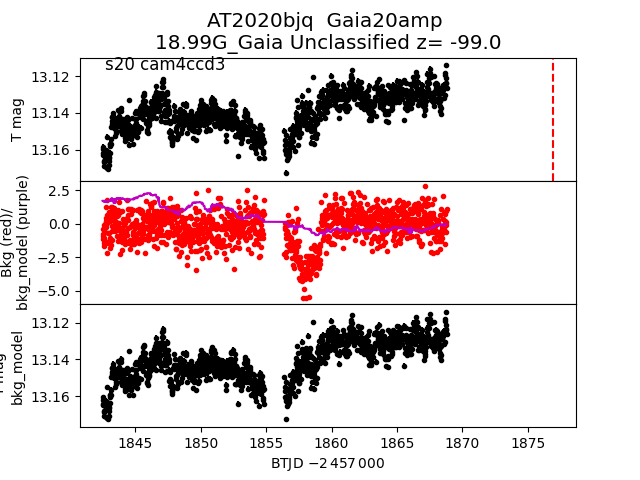
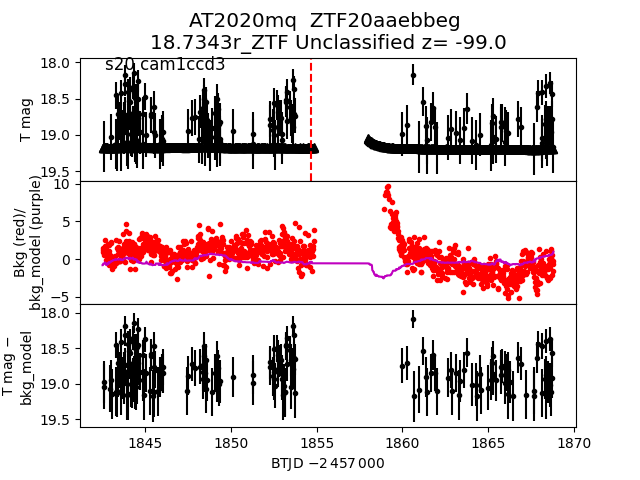
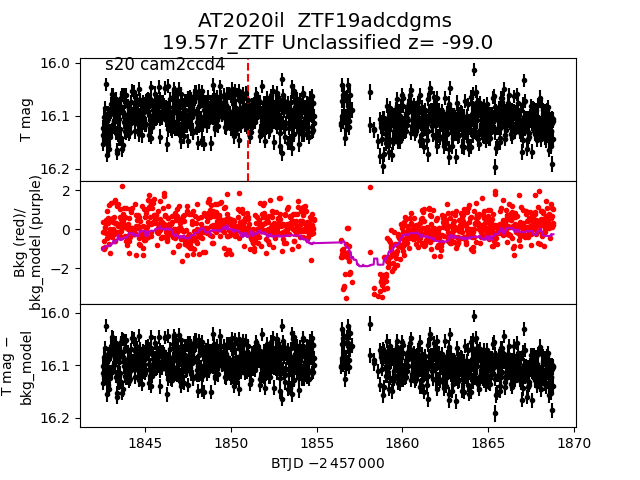
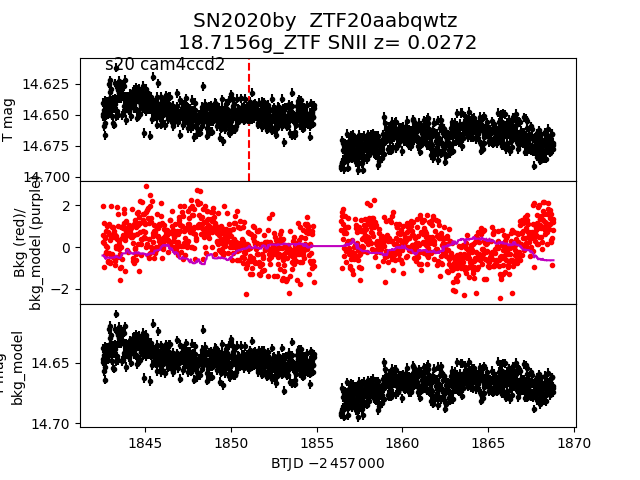
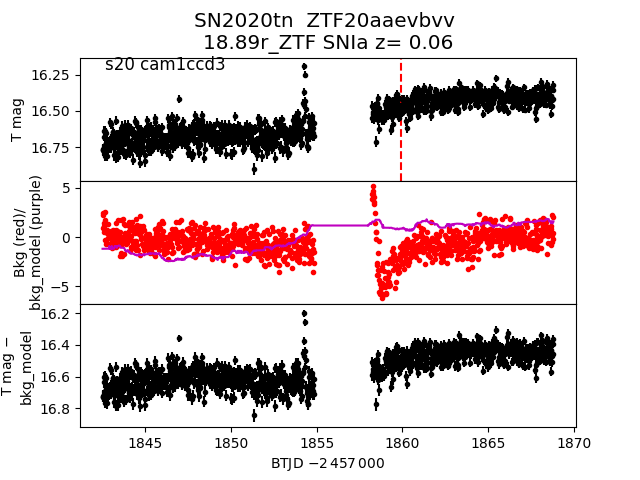
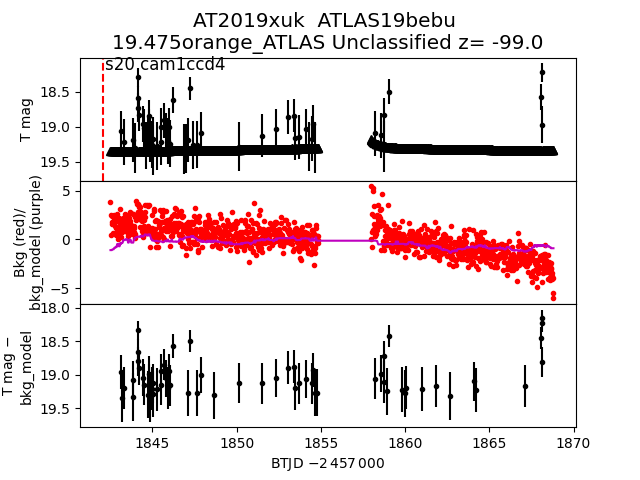
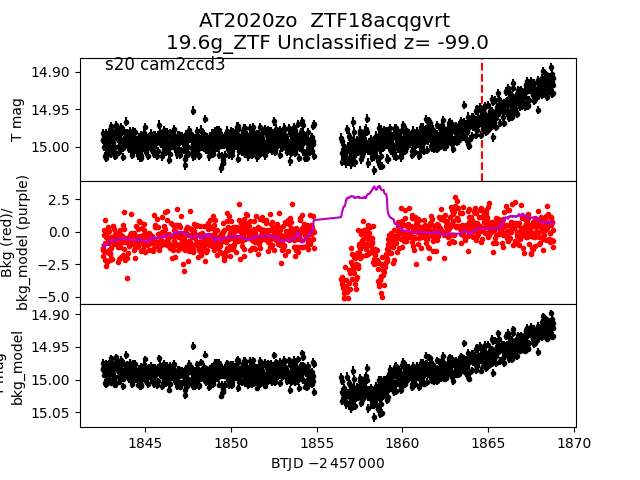
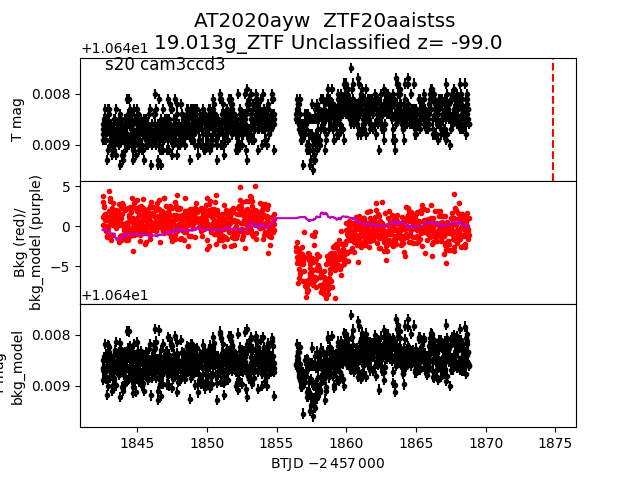
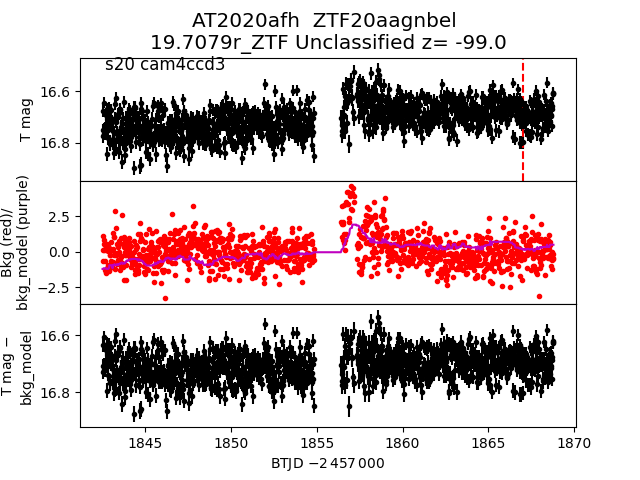
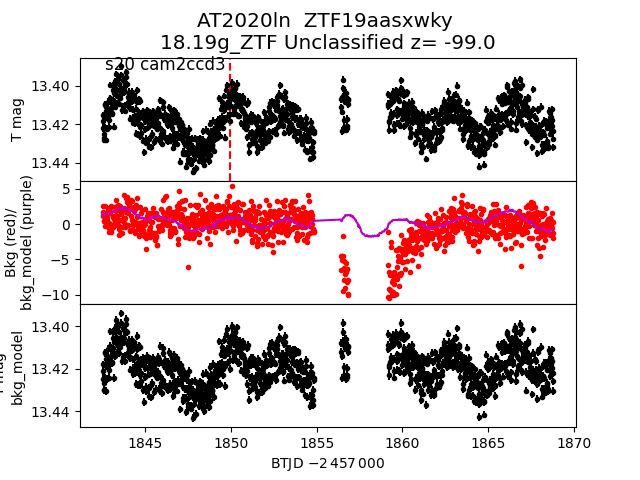
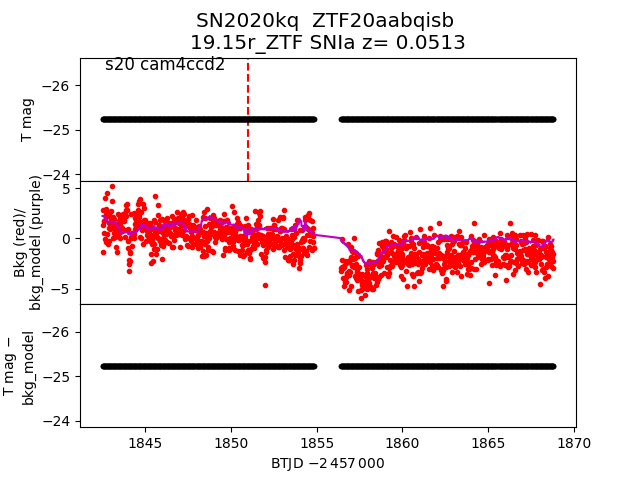
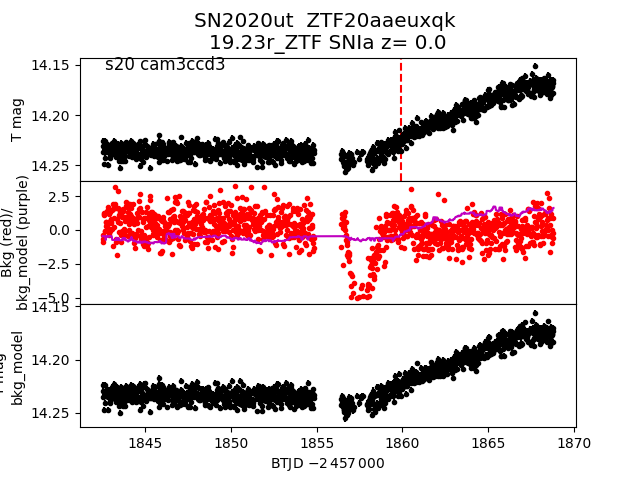
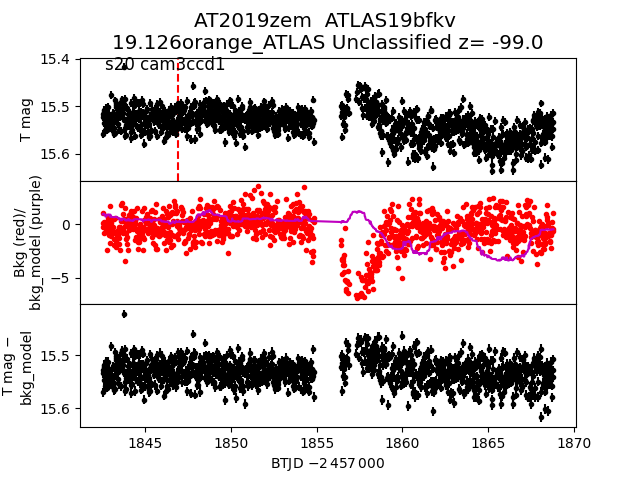
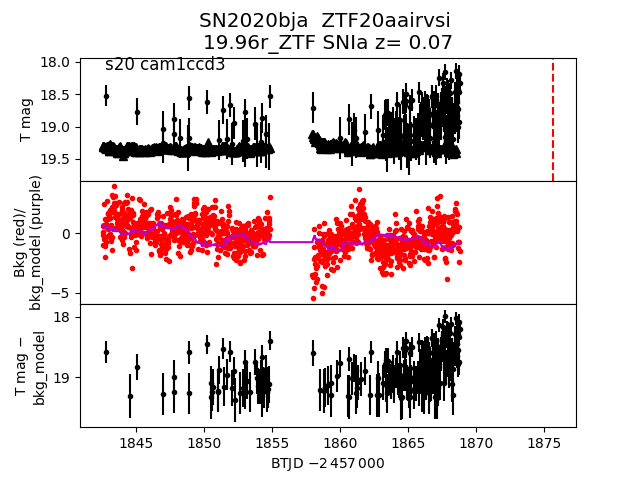
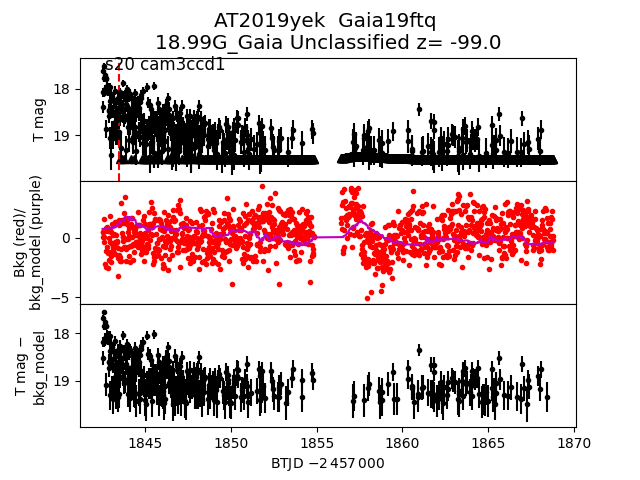
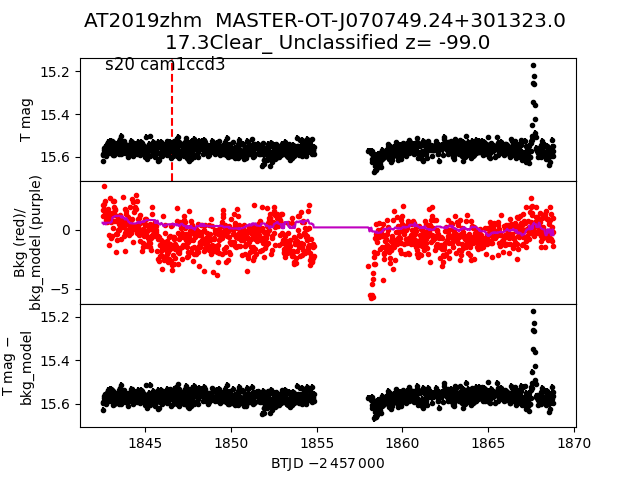
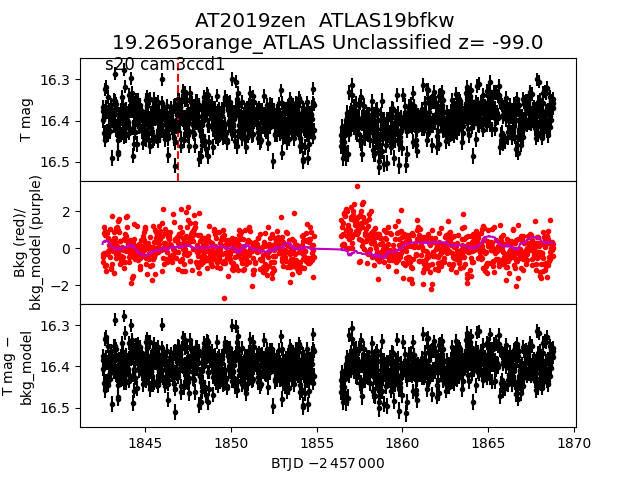
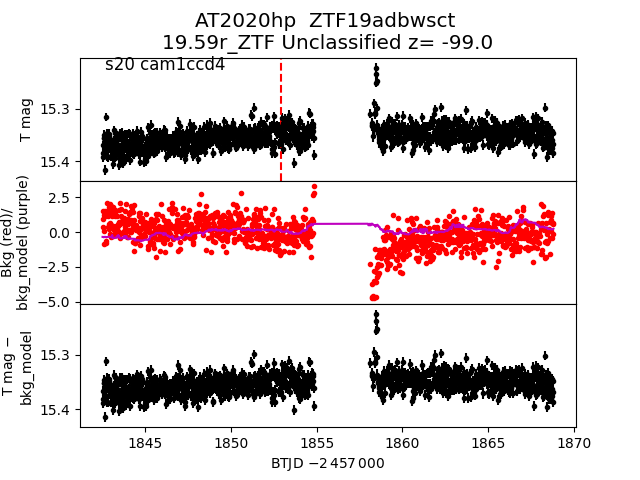
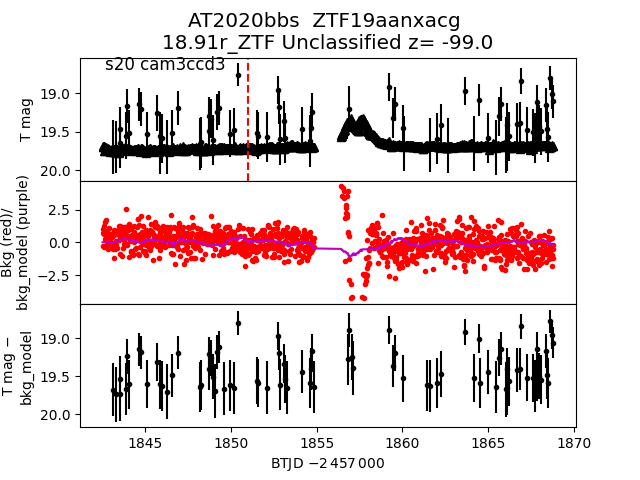
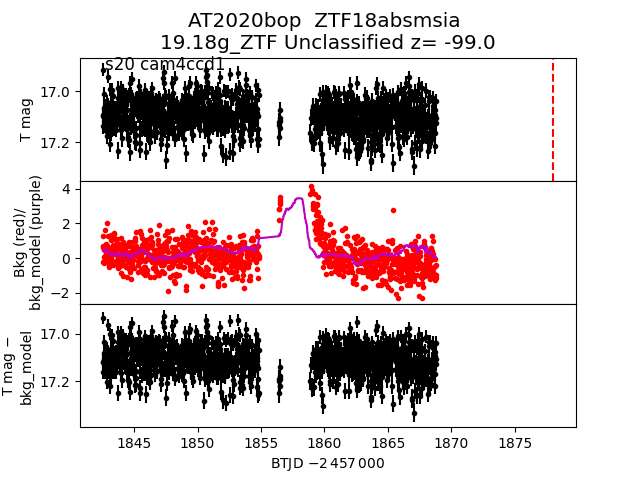
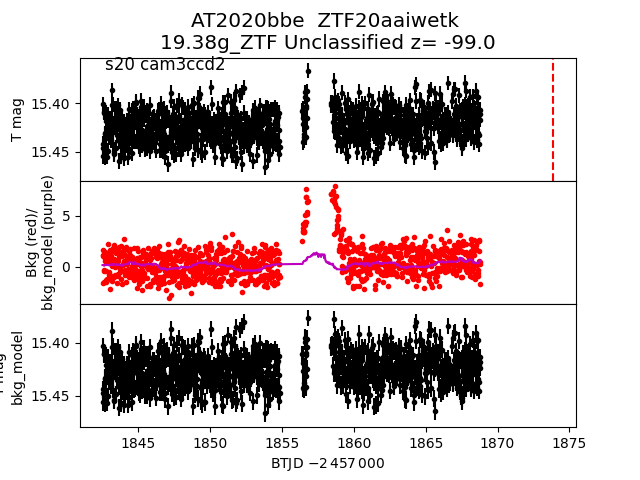
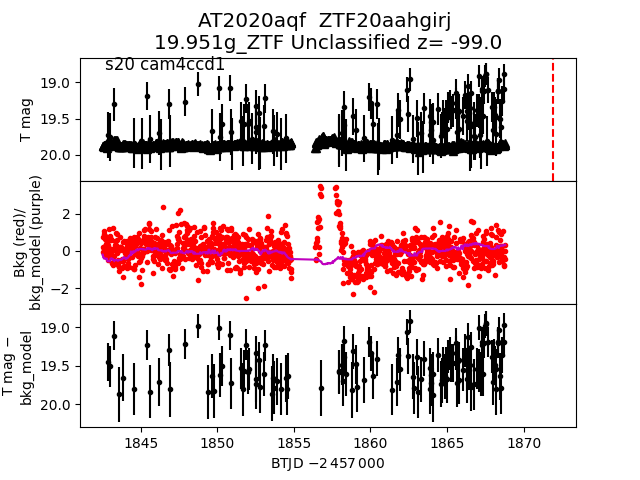
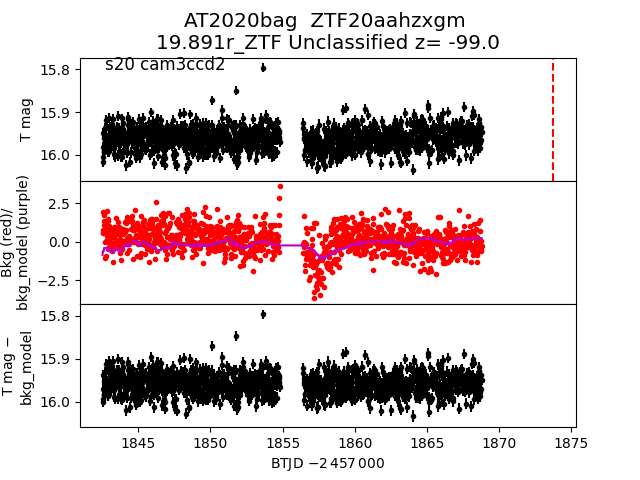
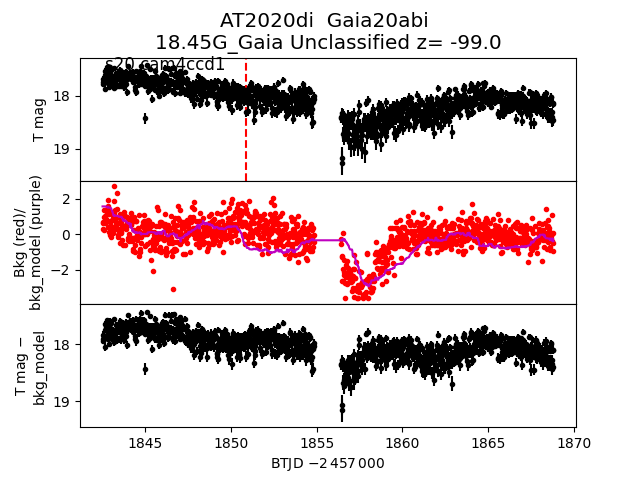
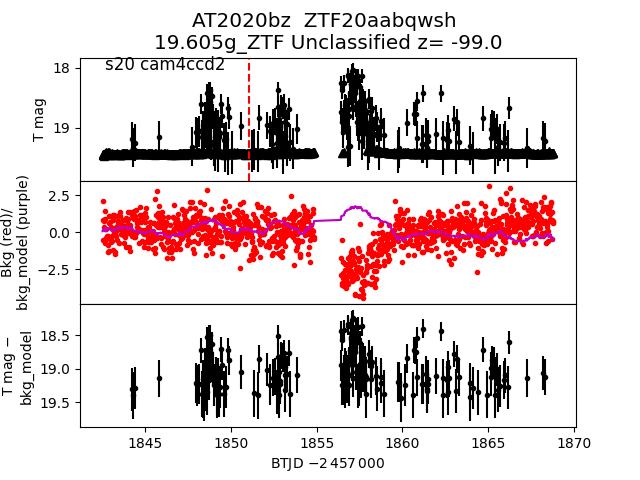
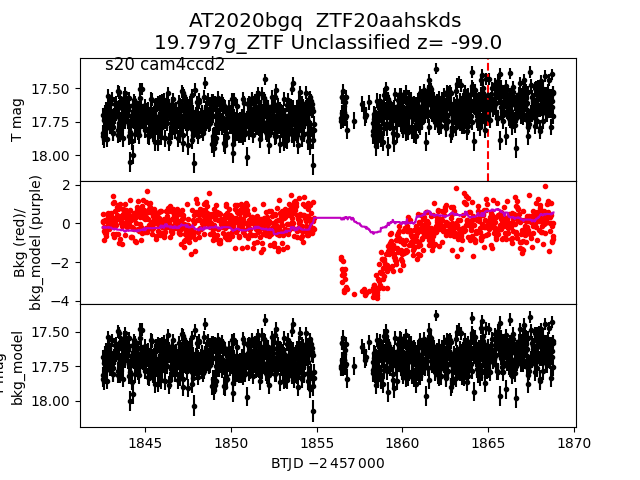
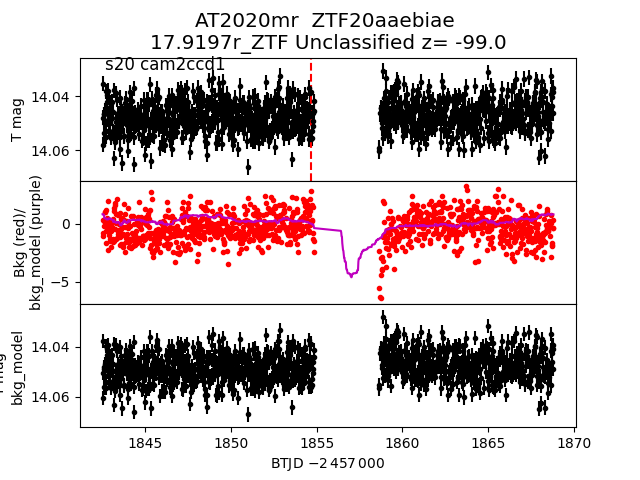
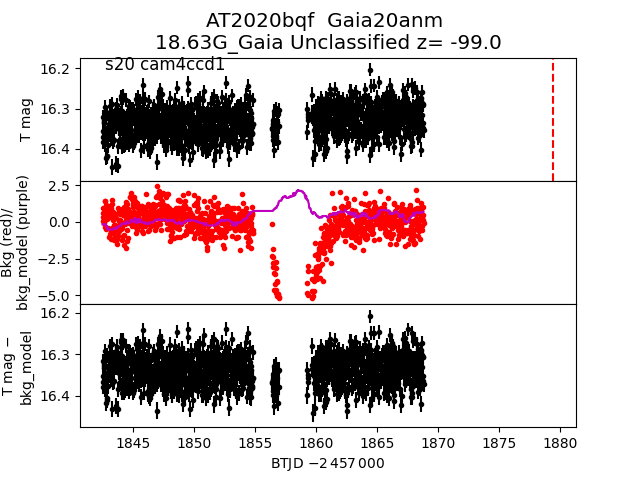
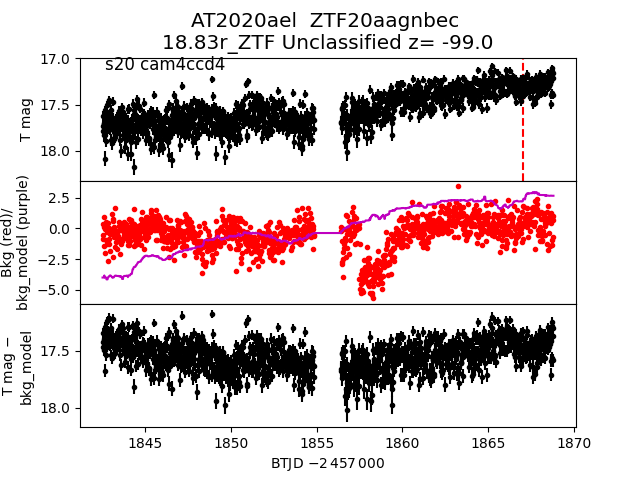
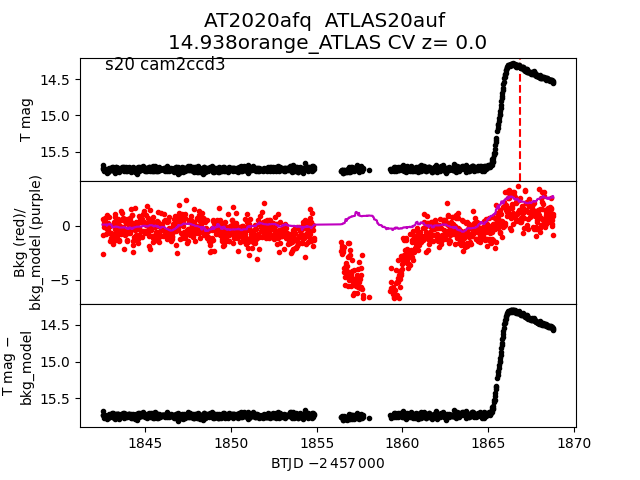
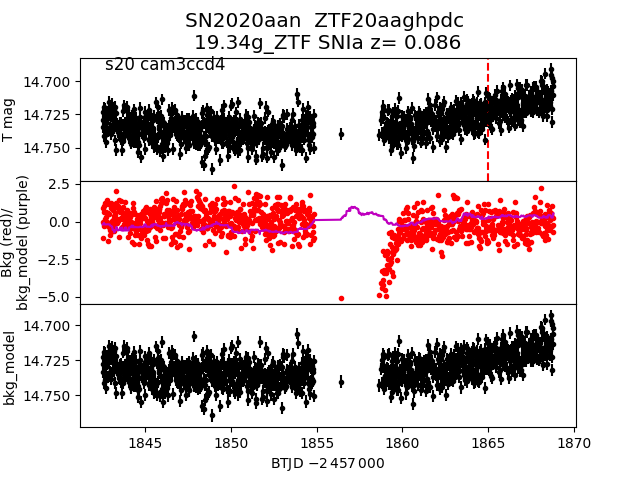
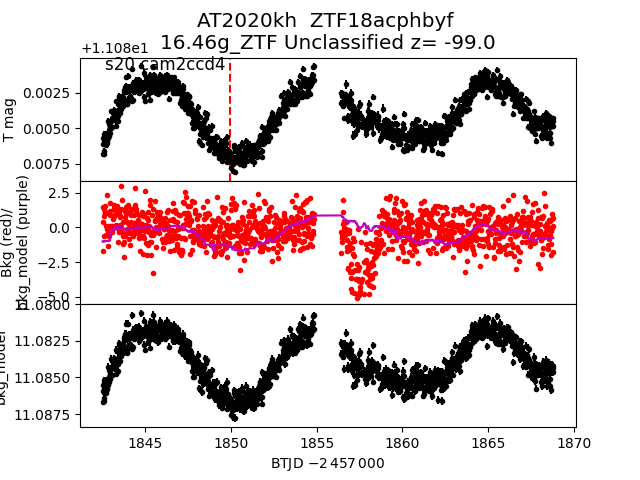
Each figure has three panels. The top panel shows the transient light curve, the middle panel shows the local background (estimated in an annulus), and the bottom panel shows a "background-model corrected" light curve. Details about the background model are in the README.
The vertical red line marks the time of discovery reported to TNS. Other useful metadata from TNS is in the figure title.
Note that the top and bottom panel are in magnitudes, while the middle panel is in differential flux units. The magnitudes are calibrated to the flux in the reference image used for image subtraction. Thus, flux from the host galaxy is included in these magnitudes.
3-sigma upper limits are plotted as triangles with no errorbars. A typical limiting magnitude is 19.6 in 30 minutes or 18.4 in 200 seconds (for low backgrounds).
The links allow you to download the light curve data as a text file.
More details in the README.
2020aek
 2020wd
 2020auo
 2020bmc
 2020aku
 2019zes
 2020blo
 2020bor
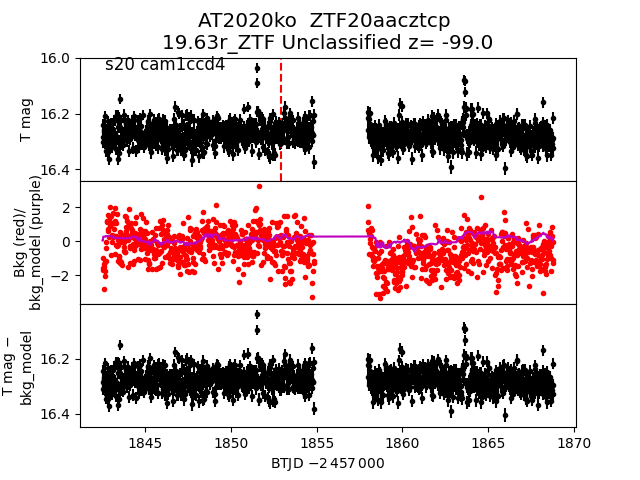
 2020ko
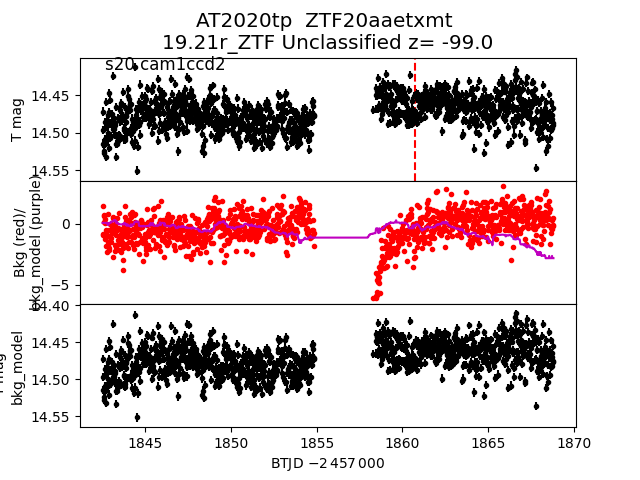
 2020tp
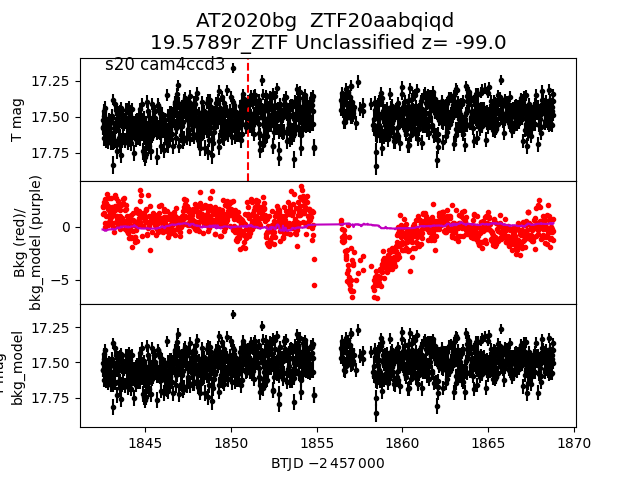
 2020bg
 2020bly
 2020bx
 2020to
 2019zag
 2020bck
 2020bbx
 2020wd_detrended
 2020kf
 2019zrd
 2020ir
 2020apm
 2020bpw
 2020bmp
 2020ato
 2020bmf
 2019yel
 2019zhj
 2020bdx
 2020aen
 2020bqr
 2019zei
 2020bbt
 2020abq
 2020bw
 2020aao
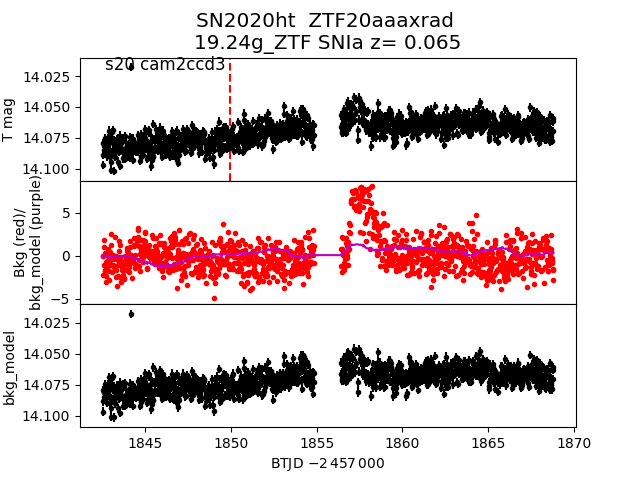
 2020ht
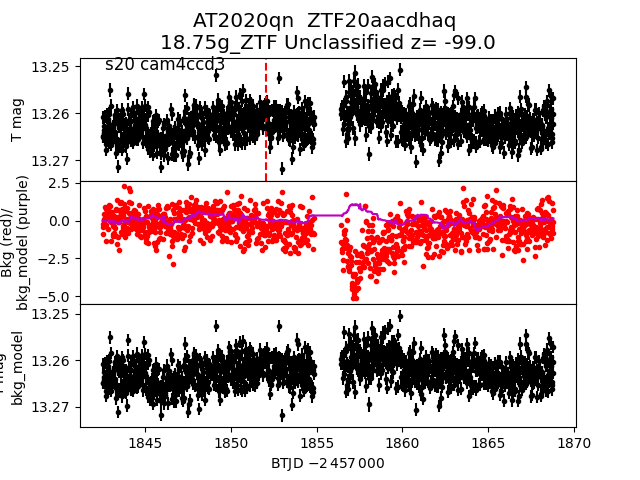
 2020qn
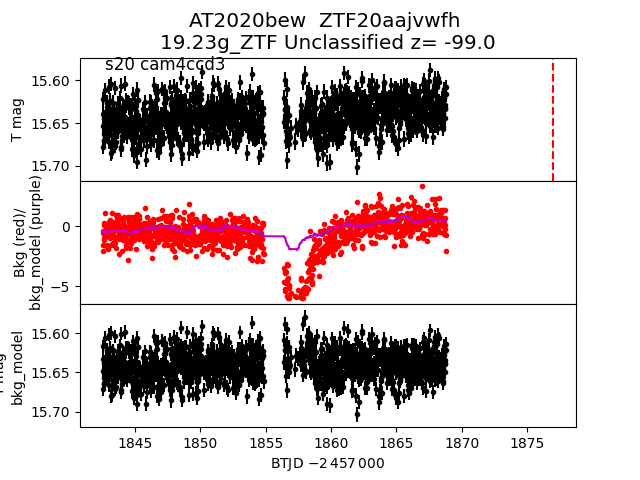
 2020bew
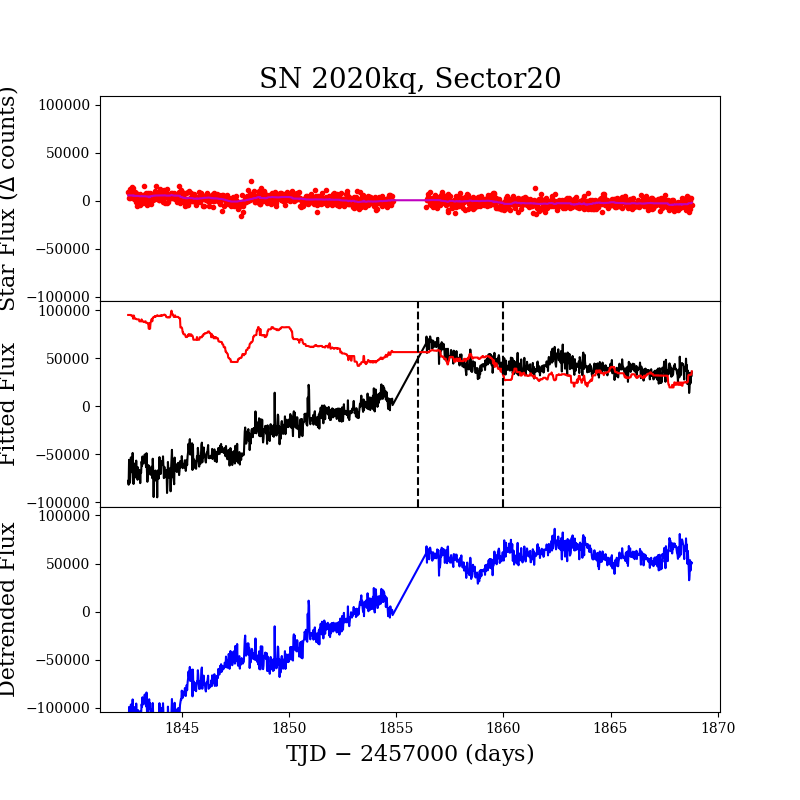
 2020kq
 2019zej
 2020blv
 2020bh
 2020aem
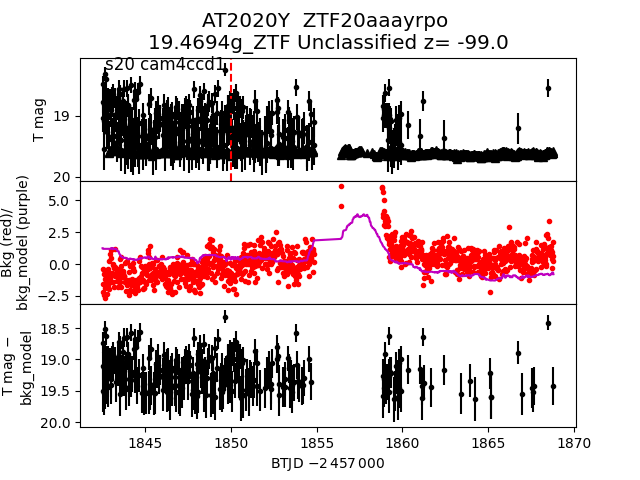
 2020Y
2020Y
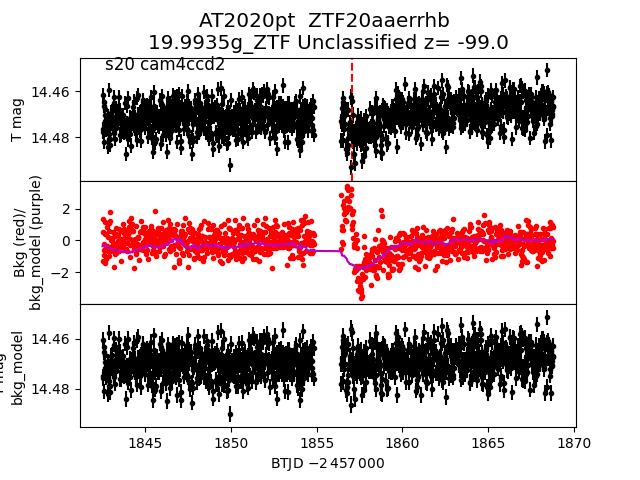
 2020pt
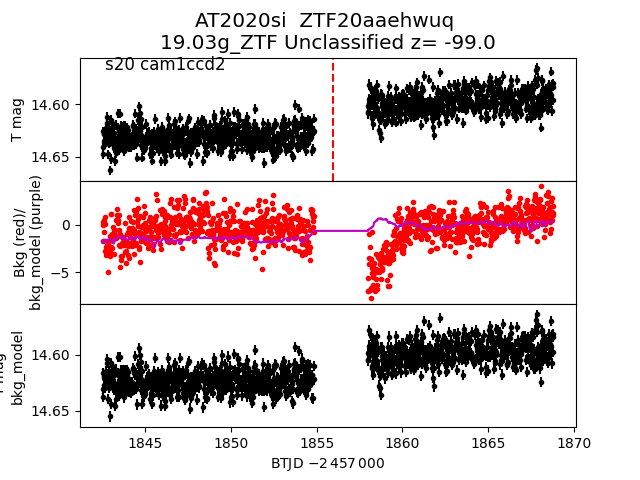
 2020si
 2019xul
 2020bms
 2019zdo
 2020ayo
 2020ats
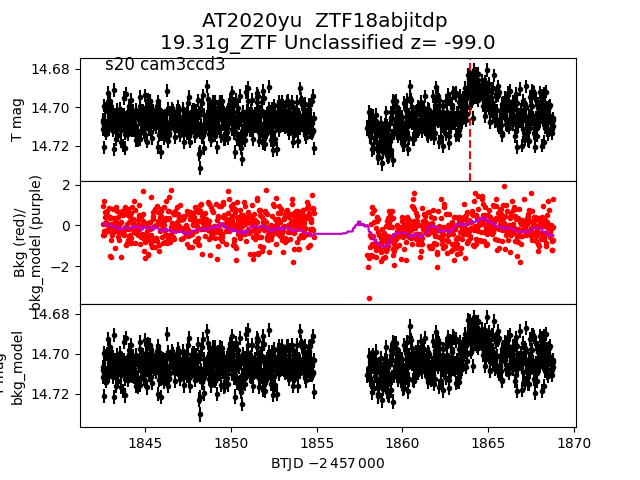
 2020yu
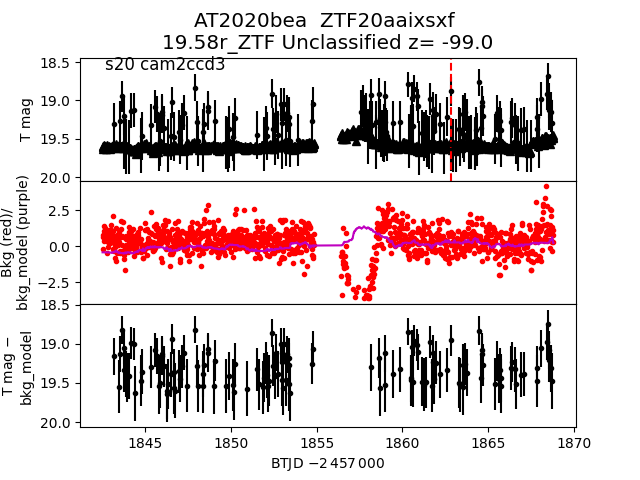
 2020bea
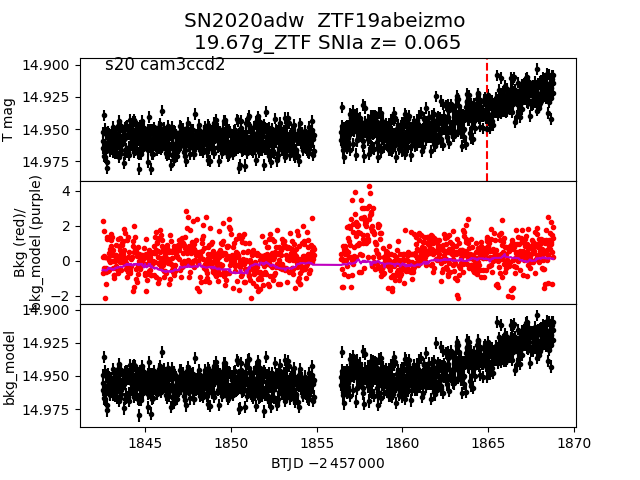
 2020adw
 2020nk
 2019yyw
 2020bdw
 2020yf
 2019zep
 2019zam
 2020to
 2020xu
 2020ks
 2020ui
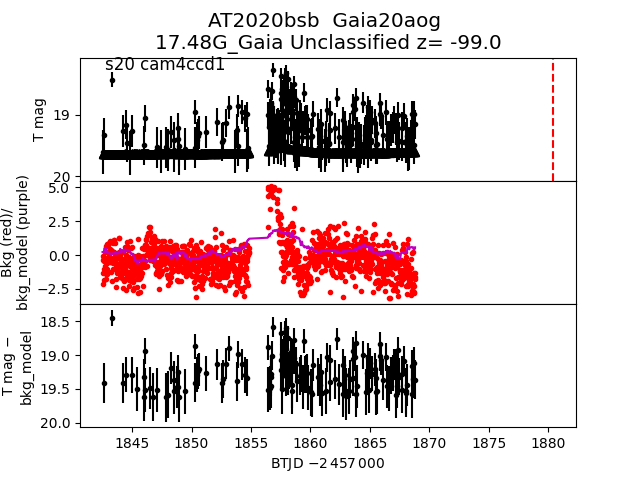
 2020bsb
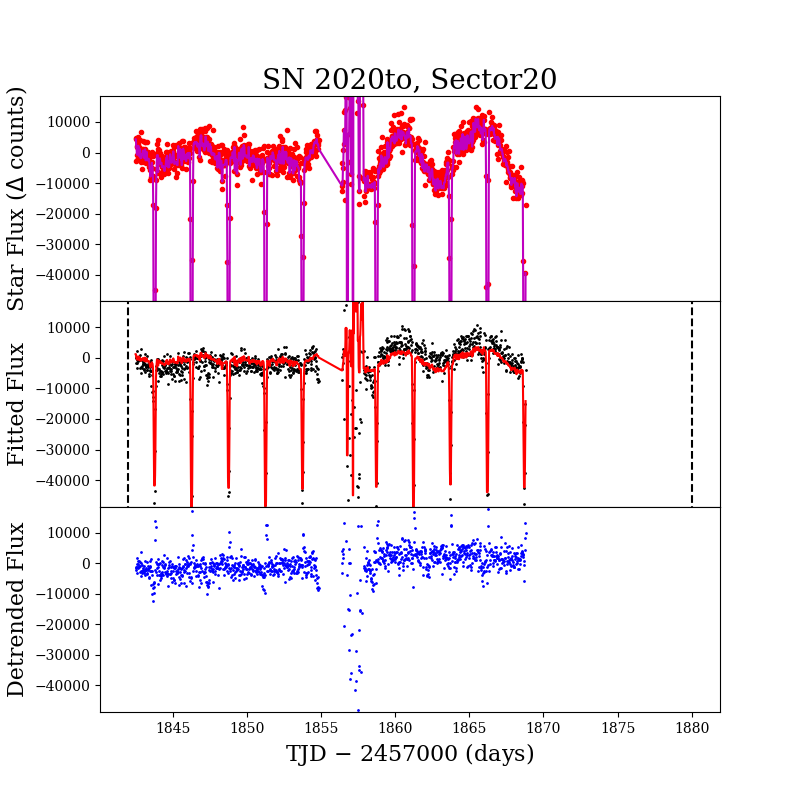
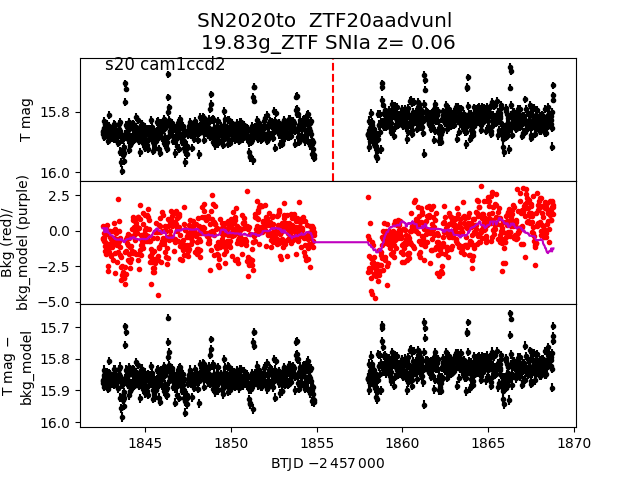
 2020to_detrended
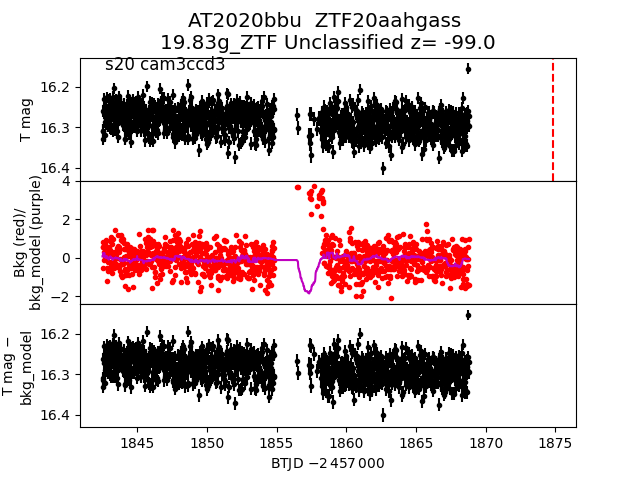
 2020bbu
 2020brq
 2019yxj
 2020kt
 2020biz
 2020bj
 2020M
2020M
 2019xvs
 2020bjq
 2020mq
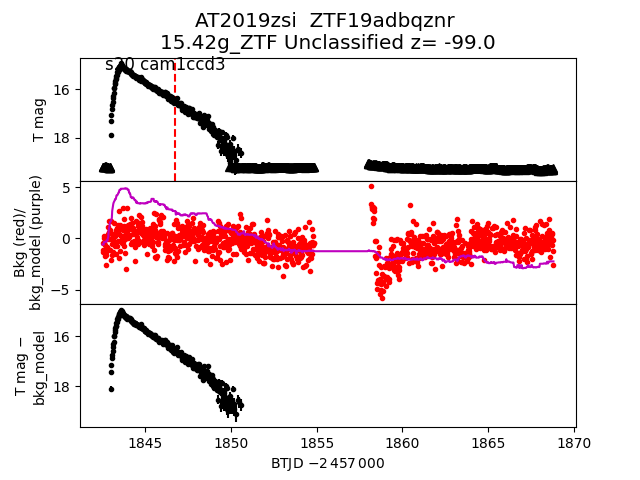
 2019zsi
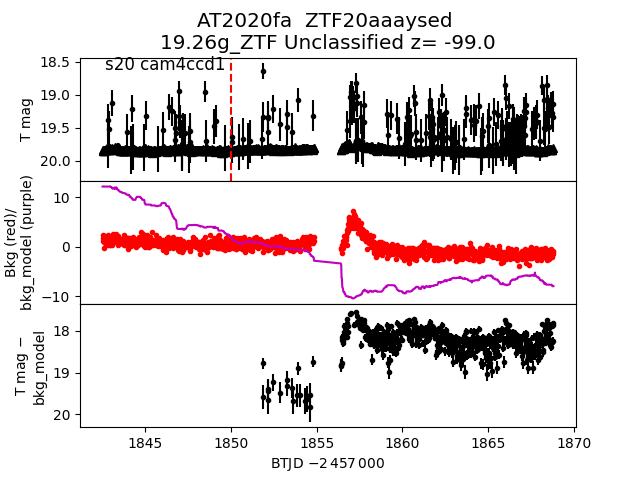
 2020fa
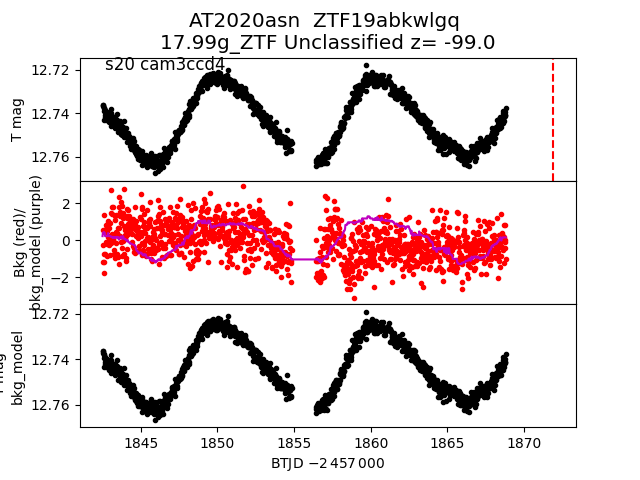
 2020asn
 2020il
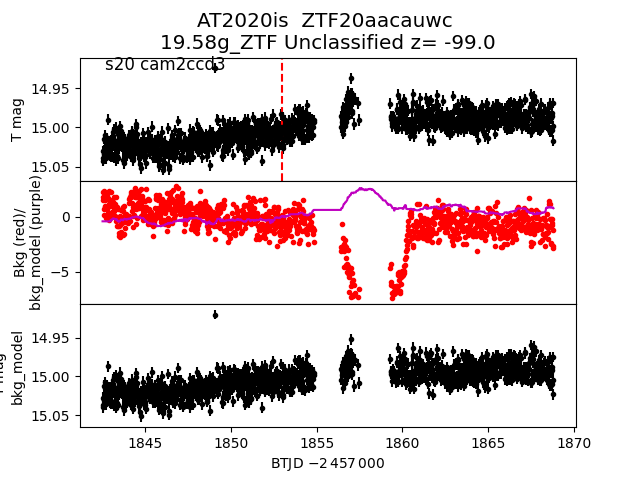
 2020is
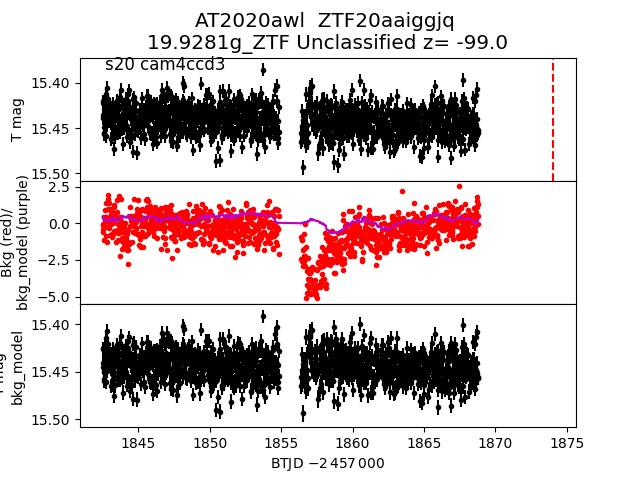
 2020awl
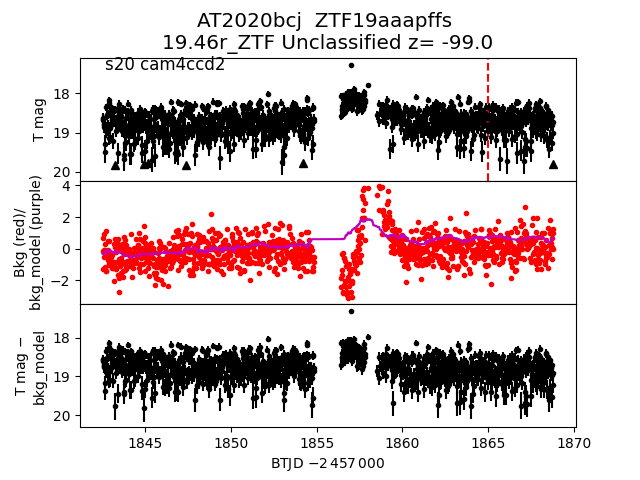
 2020bcj
 2020by
 2020tn
 2019xuk
 2020zo
 2020ayw
 2020afh
 2020ln
 2020kq_detrended
 2020ut
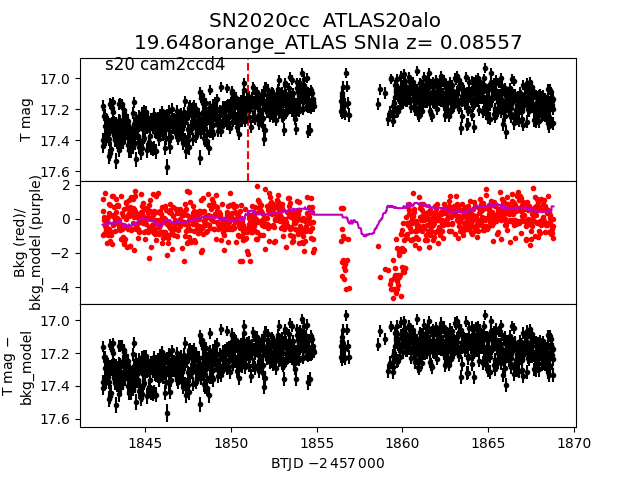
 2020cc
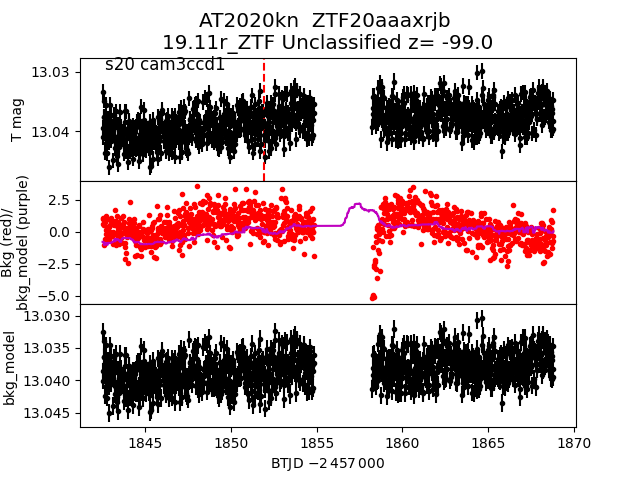
 2020kn
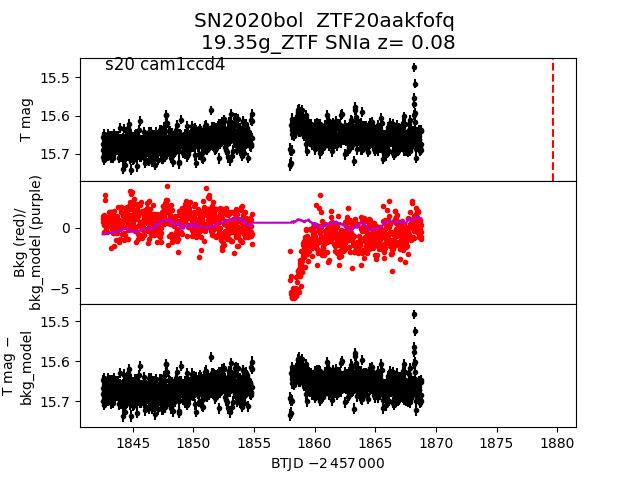
 2020bol
 2019zem
 2020kq
 2020bja
 2019yek
 2019zhm
 2019zen
 2020hp
 2020bbs
 2020bop
 2020bbe
 2020aqf
 2020bag
 2020di
 2020bz
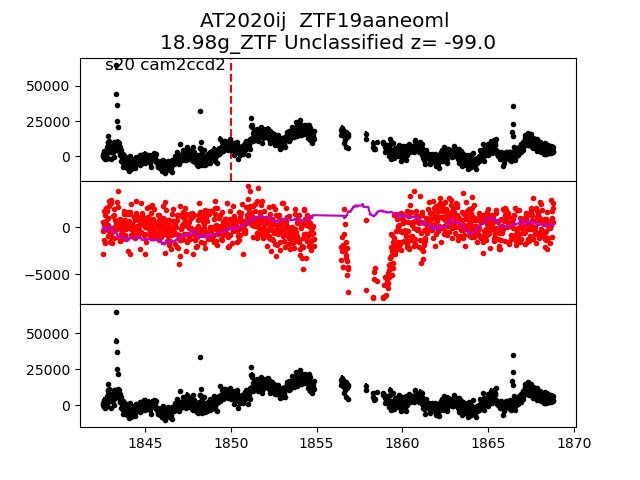
 2020ij
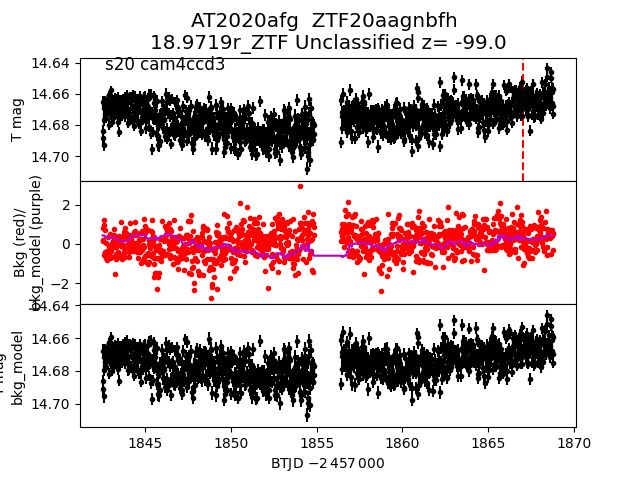
 2020afg
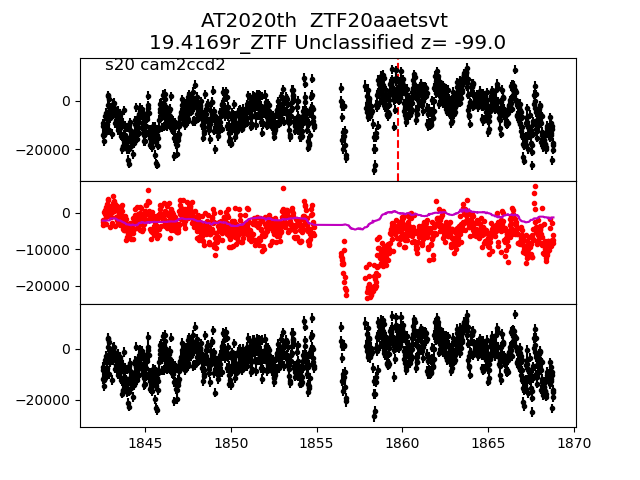
 2020th
 2020bgq
 2020mr
 2020bqf
 2020ael
 2020afq
 2020aan
 2020kh
 2020hu