all transients in sector19 (30 total)
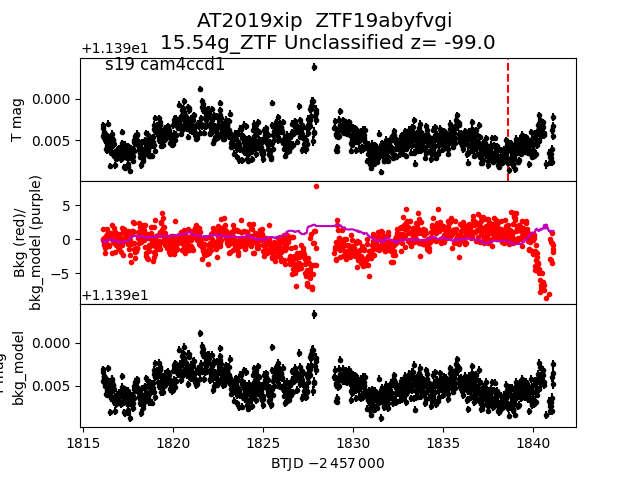
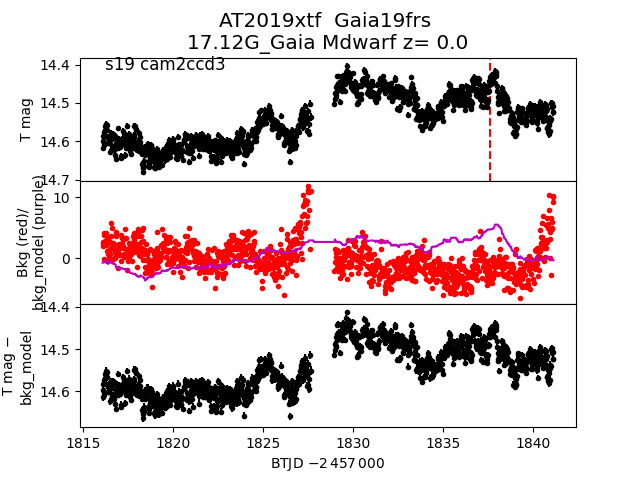
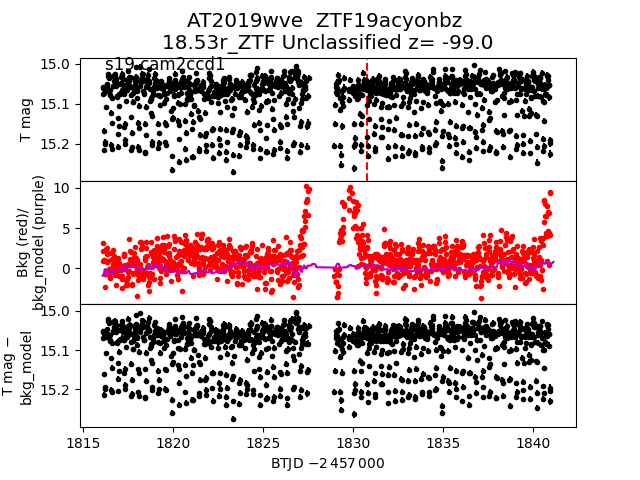
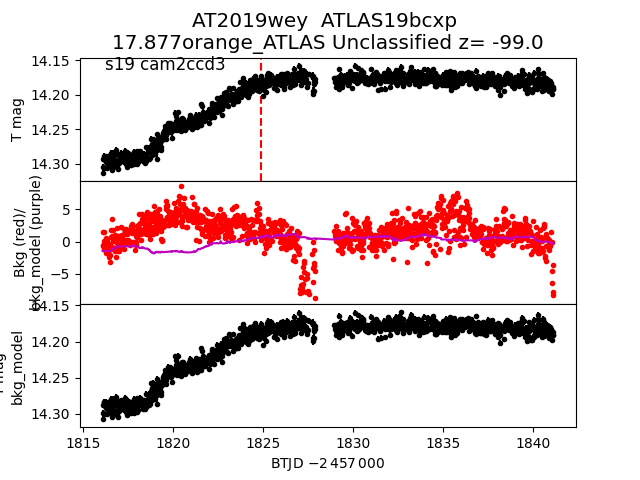
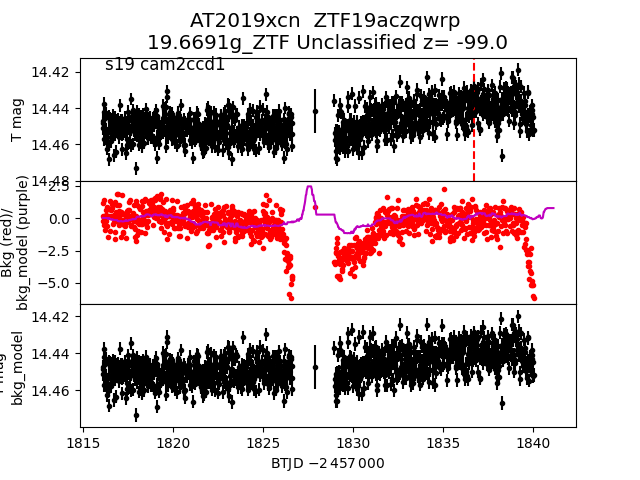
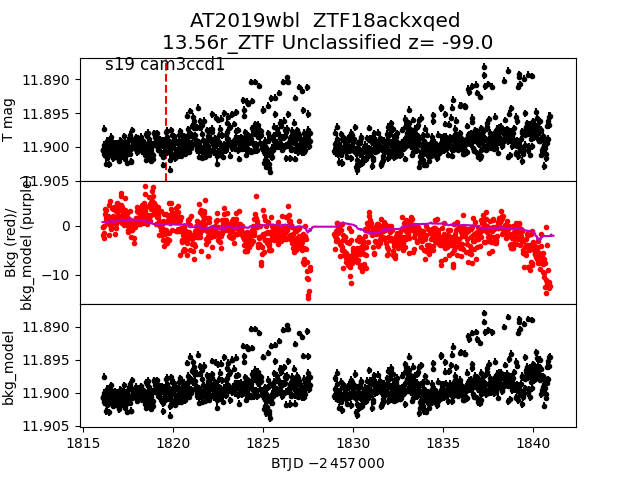
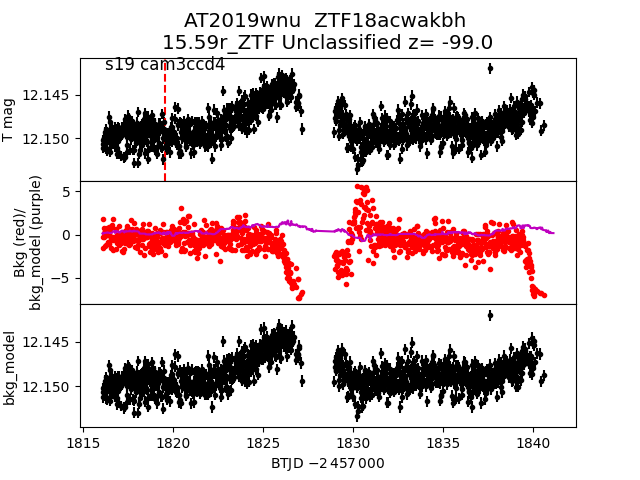
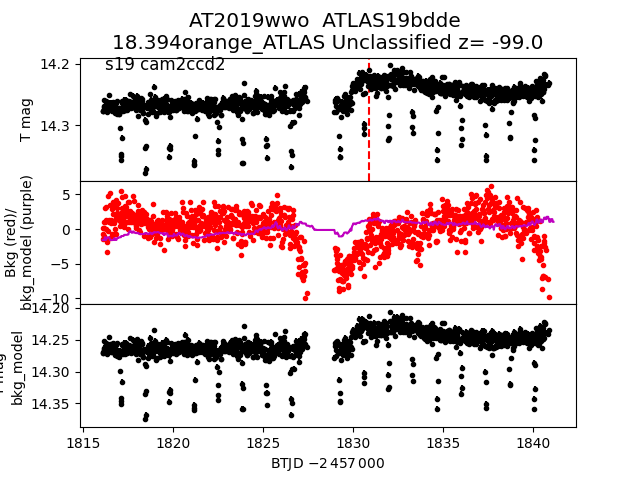
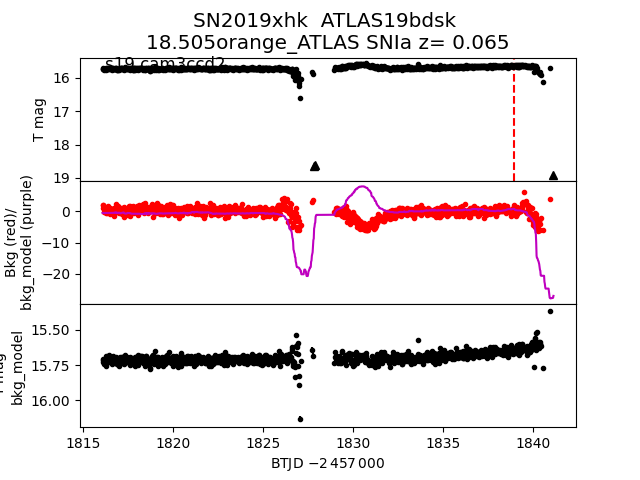
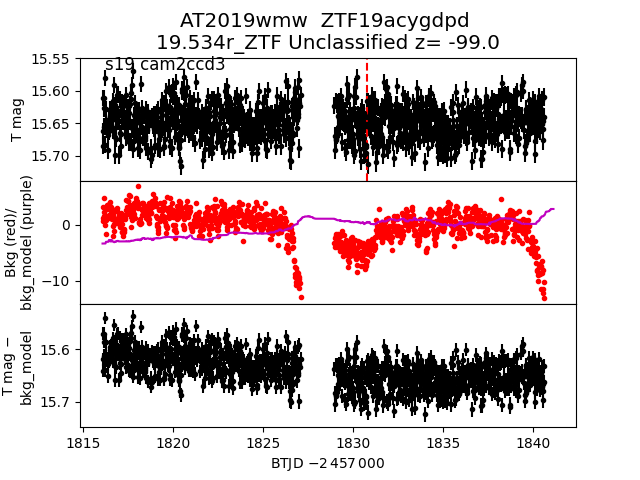
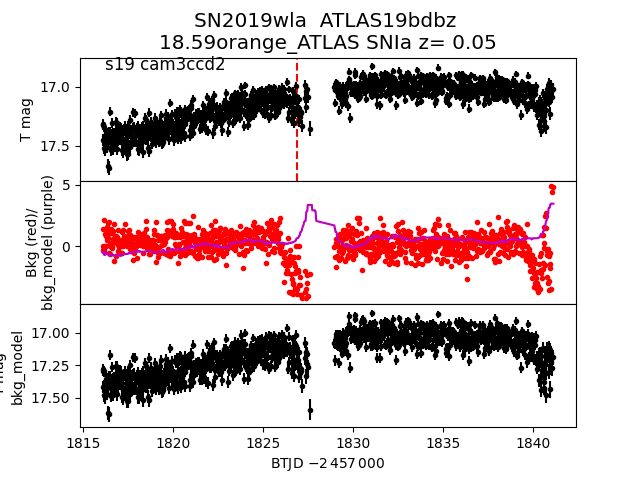
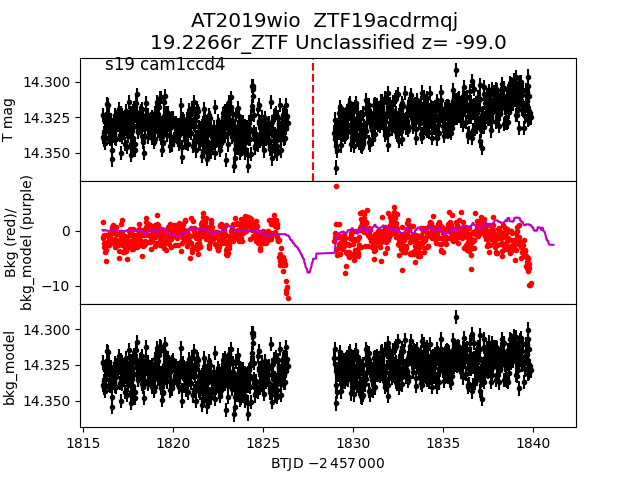
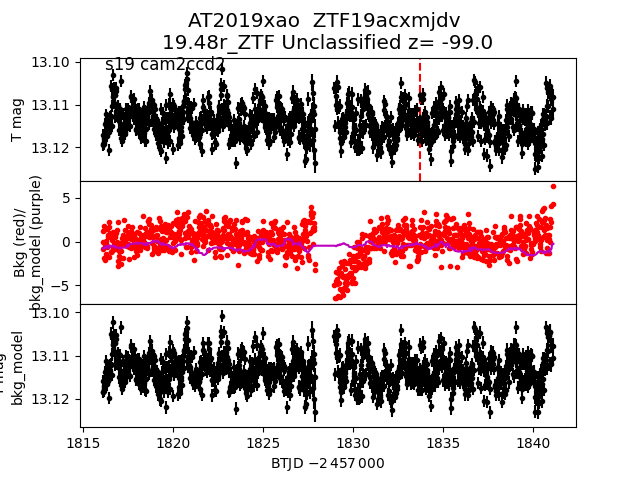
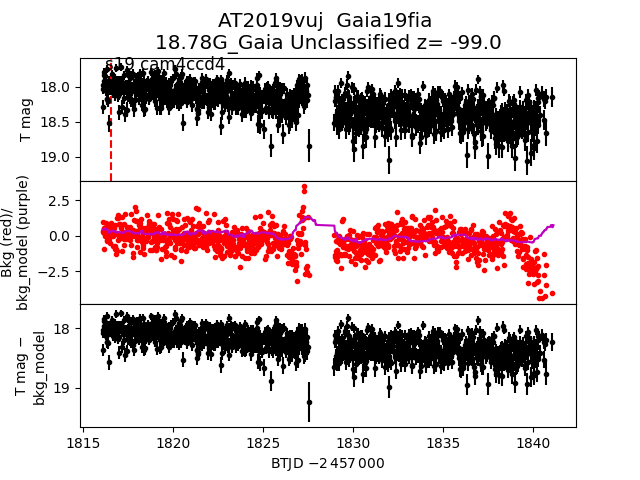
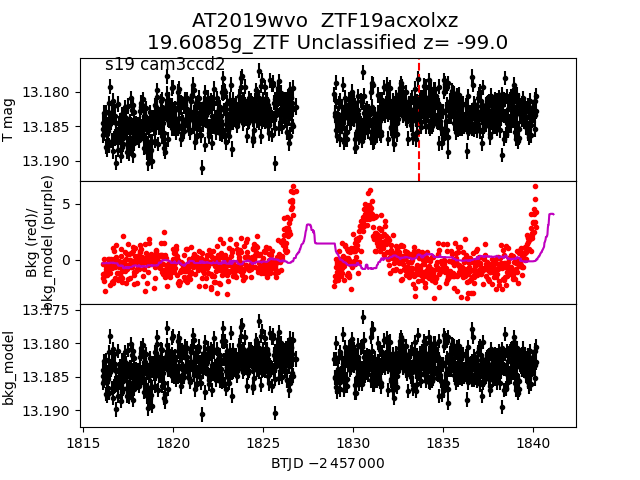
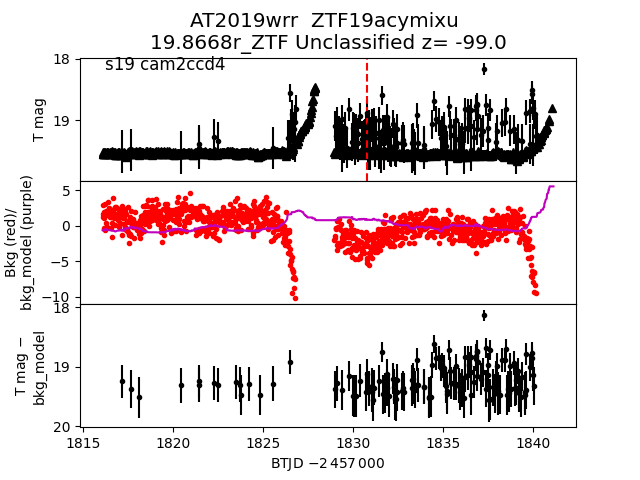
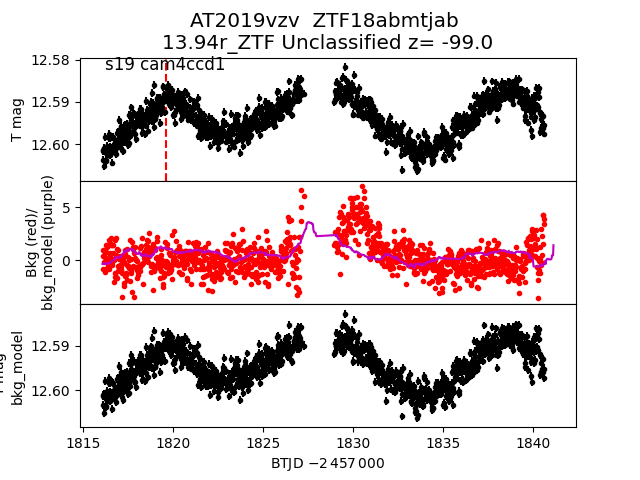
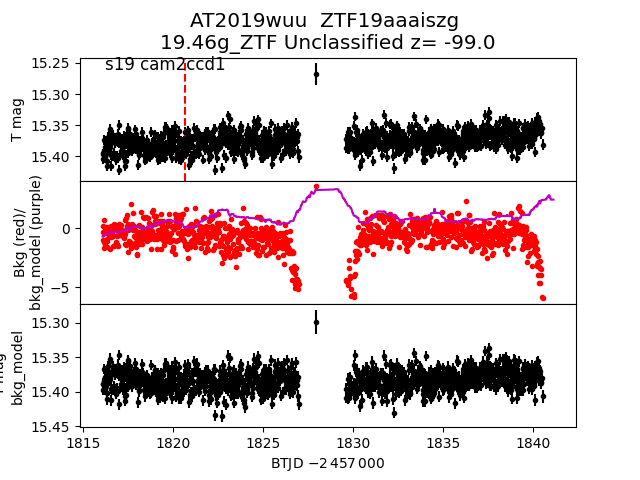
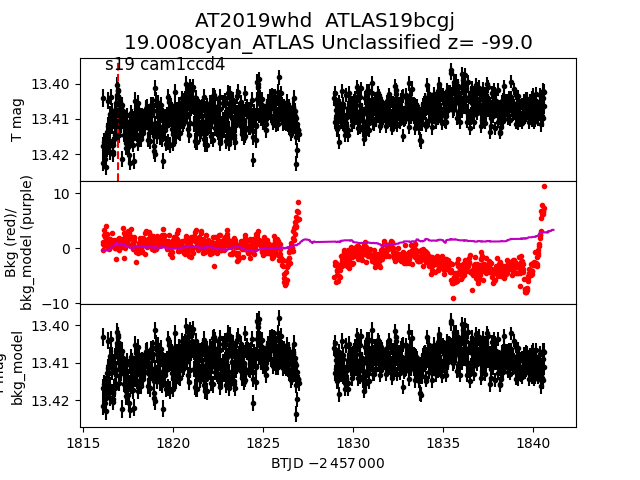
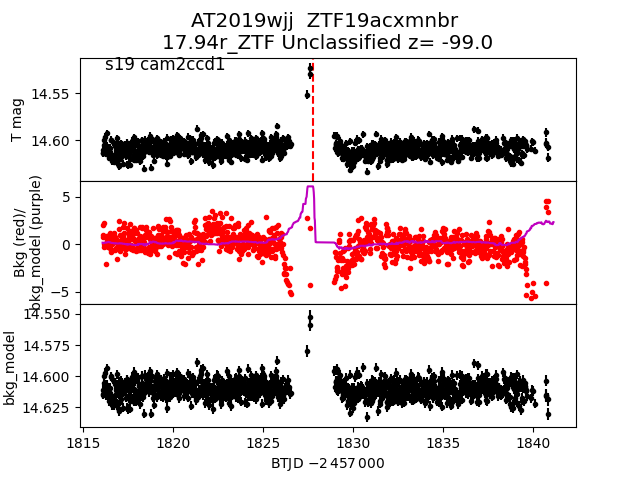
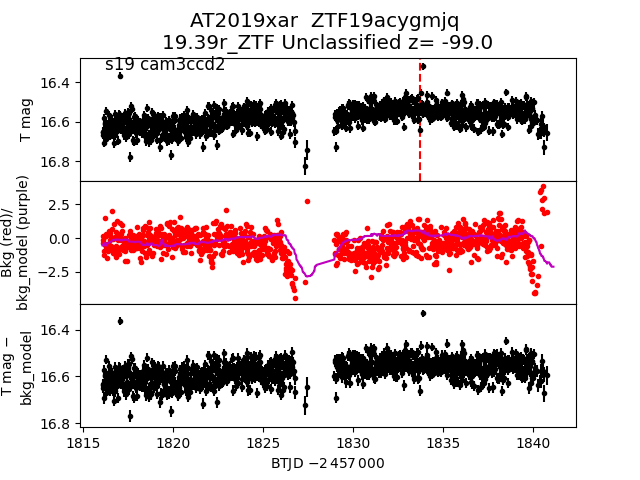
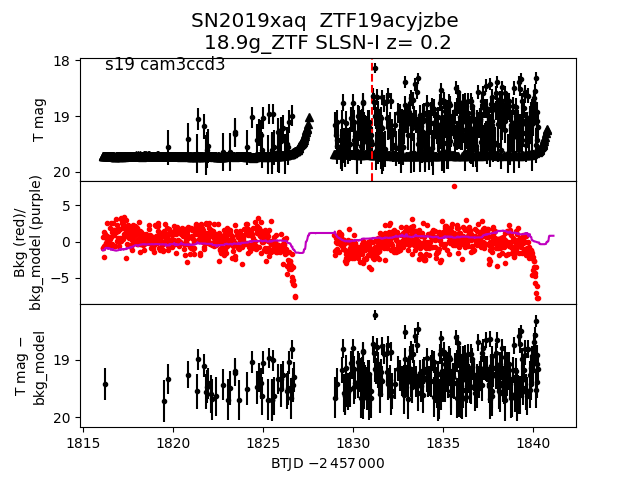
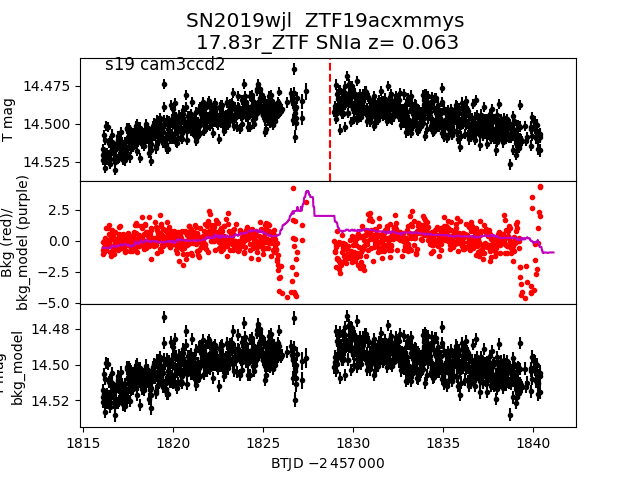
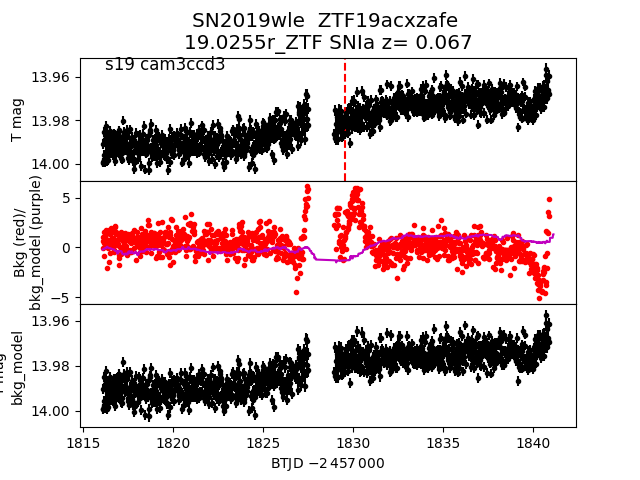
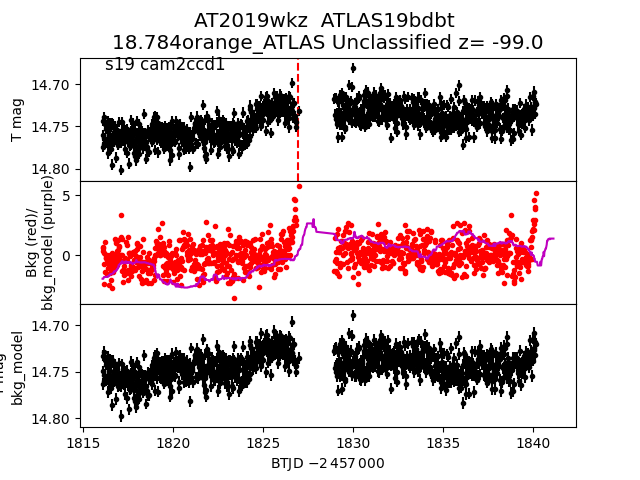
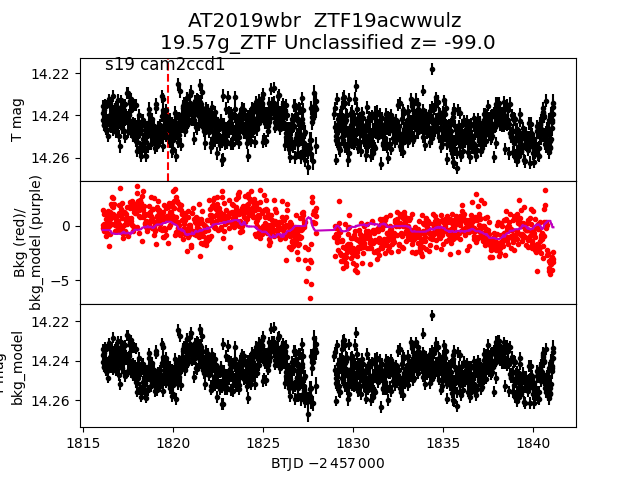
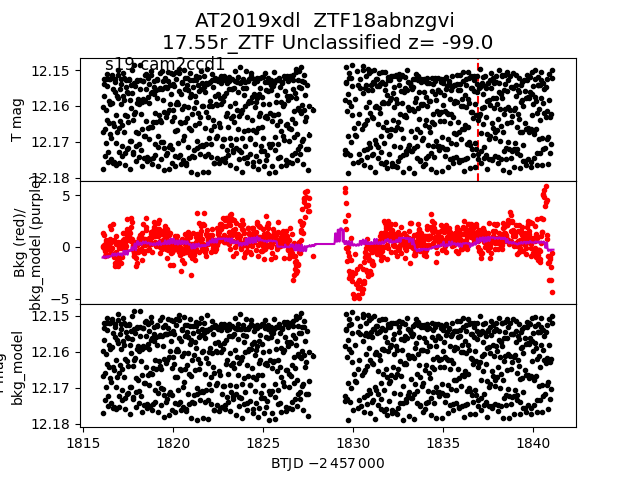
Each figure has three panels. The top panel shows the transient light curve, the middle panel shows the local background (estimated in an annulus), and the bottom panel shows a "background-model corrected" light curve. Details about the background model are in the README.
The vertical red line marks the time of discovery reported to TNS. Other useful metadata from TNS is in the figure title.
Note that the top and bottom panel are in magnitudes, while the middle panel is in differential flux units. The magnitudes are calibrated to the flux in the reference image used for image subtraction. Thus, flux from the host galaxy is included in these magnitudes.
3-sigma upper limits are plotted as triangles with no errorbars. A typical limiting magnitude is 19.6 in 30 minutes or 18.4 in 200 seconds (for low backgrounds).
The links allow you to download the light curve data as a text file.
More details in the README.
2019xtf
 2019wve
 2019wey
 2019xcn
 2019wbl
 2019wnu
 2019wwo
 2019xhk
 2019wmw
 2019wla
 2019wio
 2019xao
 2019vuj
 2019wvo
 2019wrr
 2019vzv
 2019wuu
 2019whd
 2019wjj
 2019xar
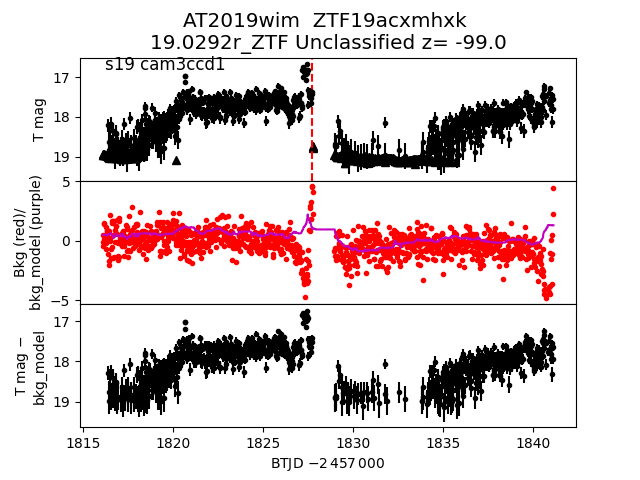
 2019wim
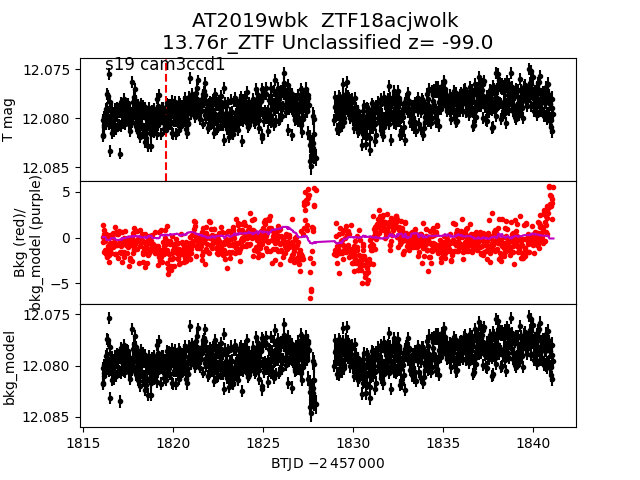
 2019wbk
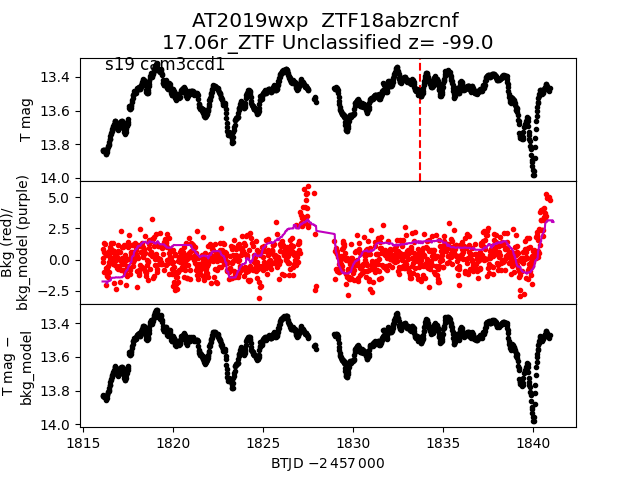
 2019wxp
 2019xaq
 2019wjl
 2019wle
 2019wkz
 2019wbr
 2019xdl
 2019xip