all transients in sector18 (61 total)
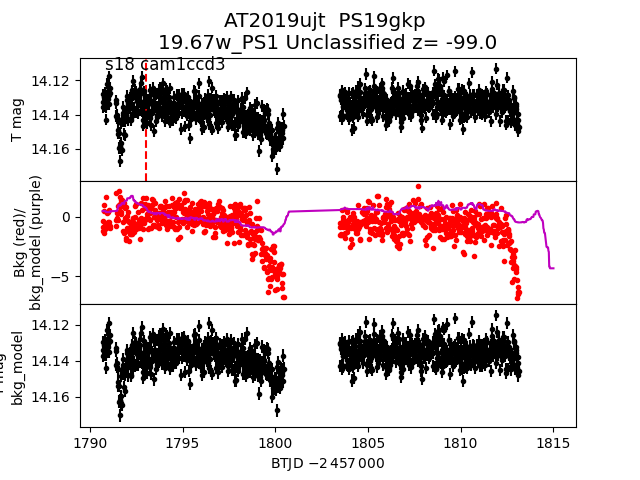
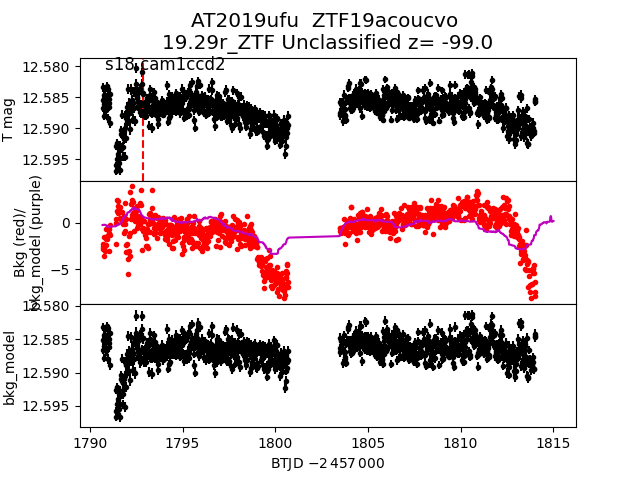
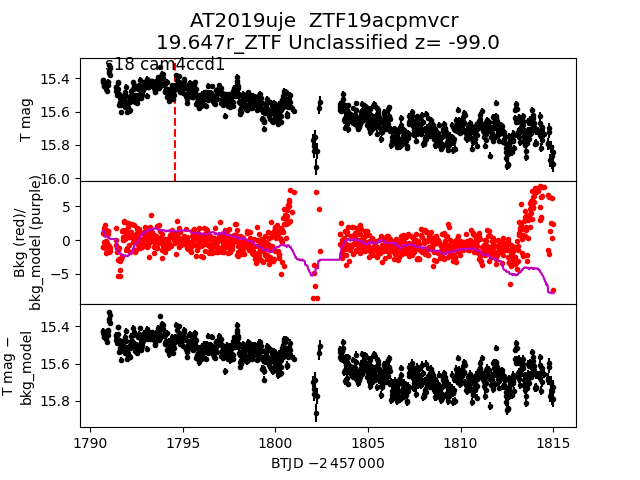
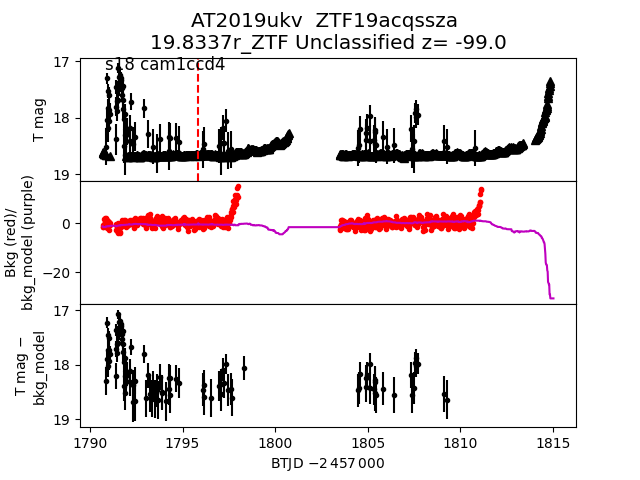
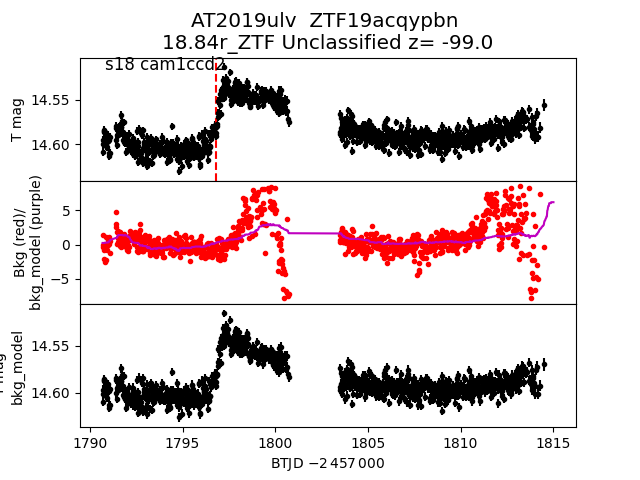
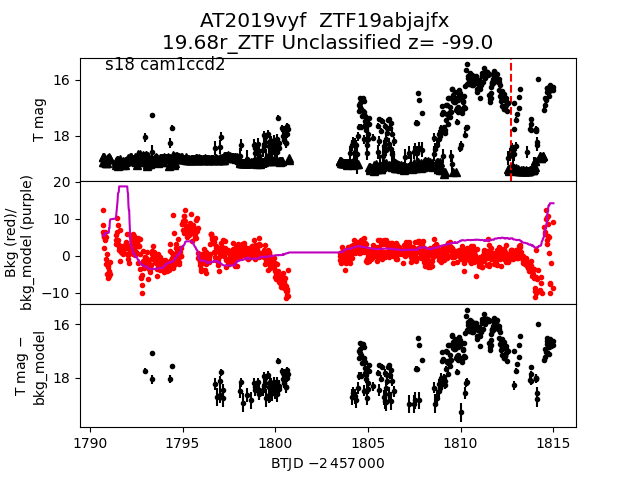
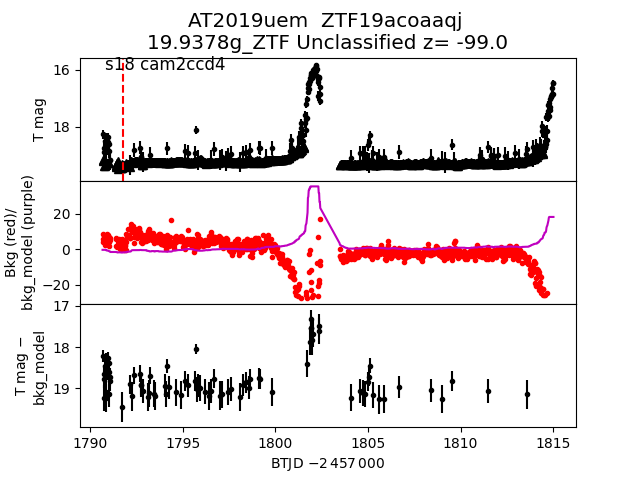
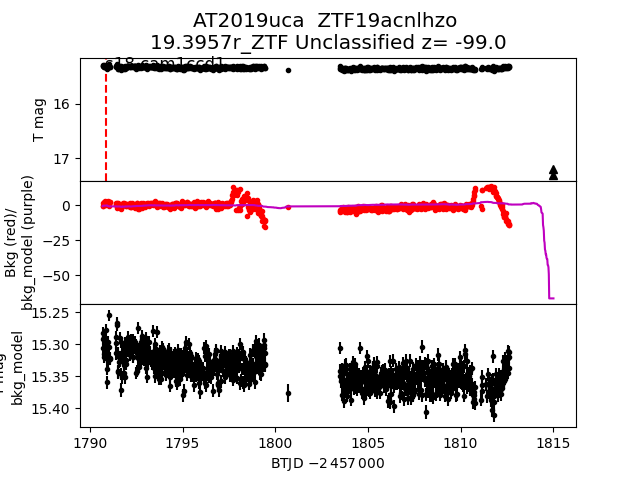
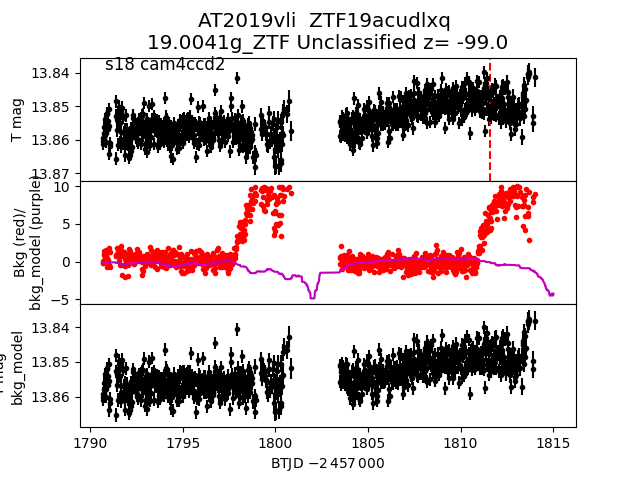
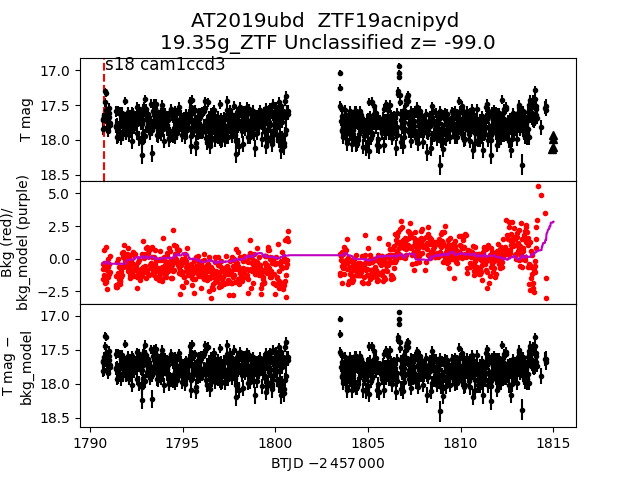
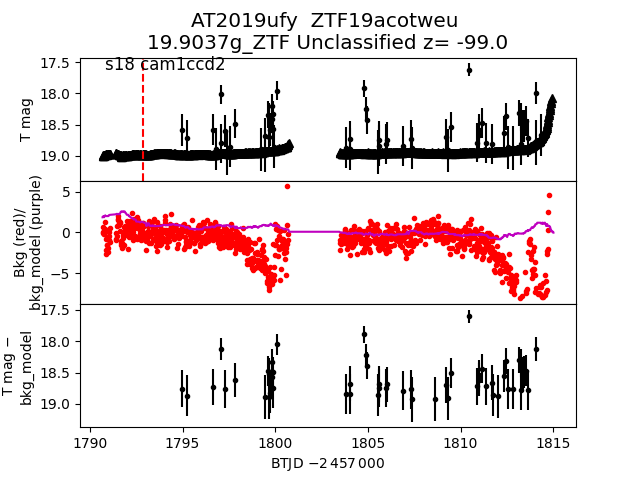
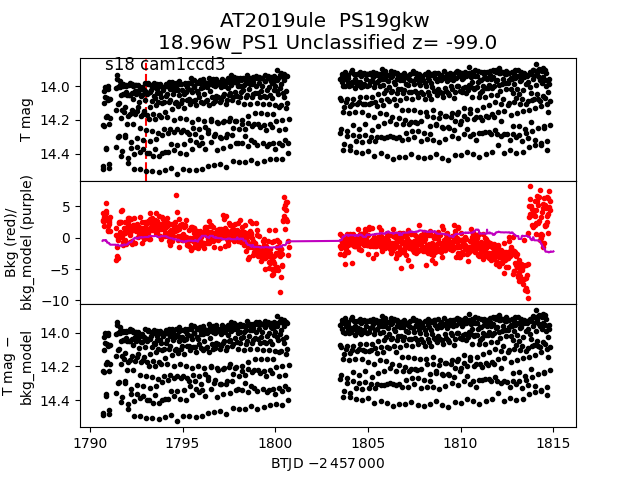
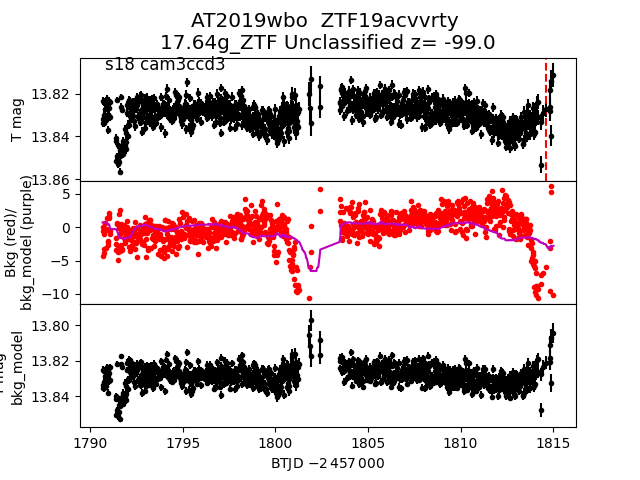
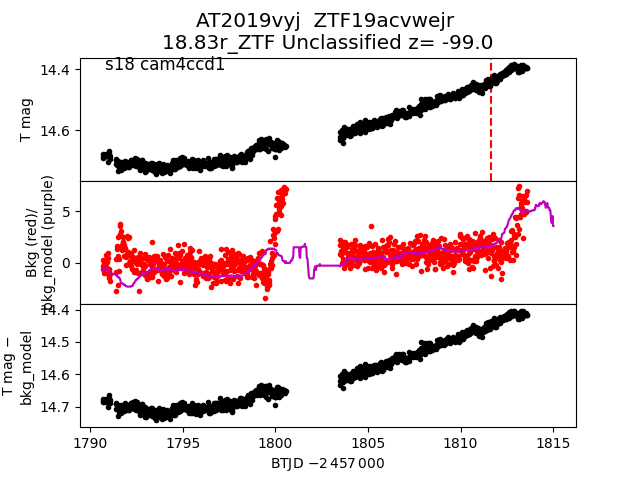
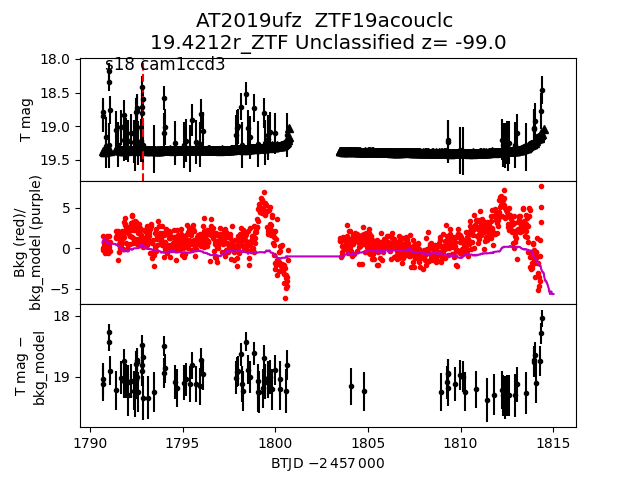
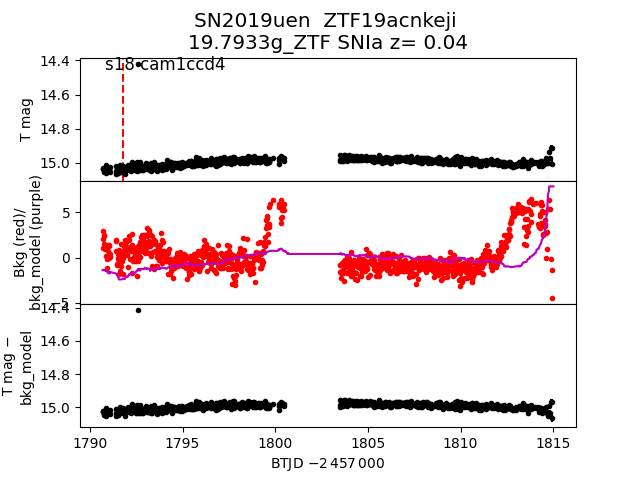
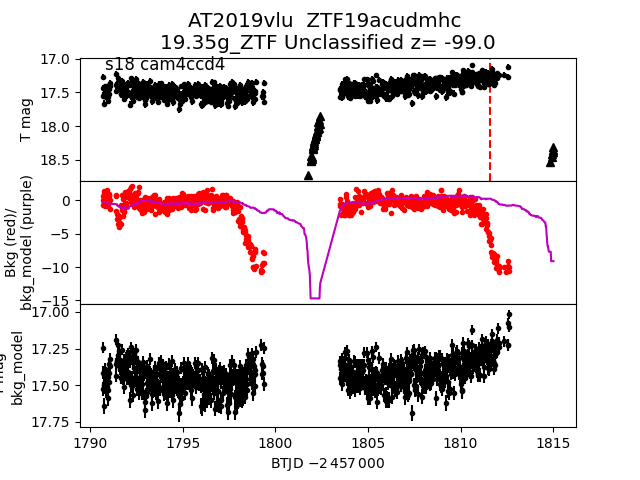
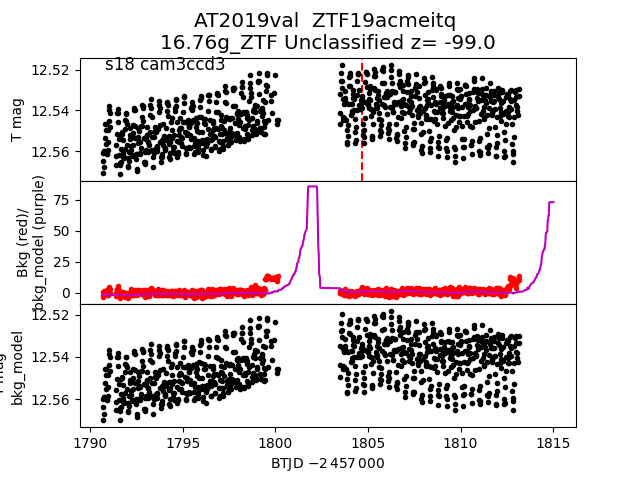
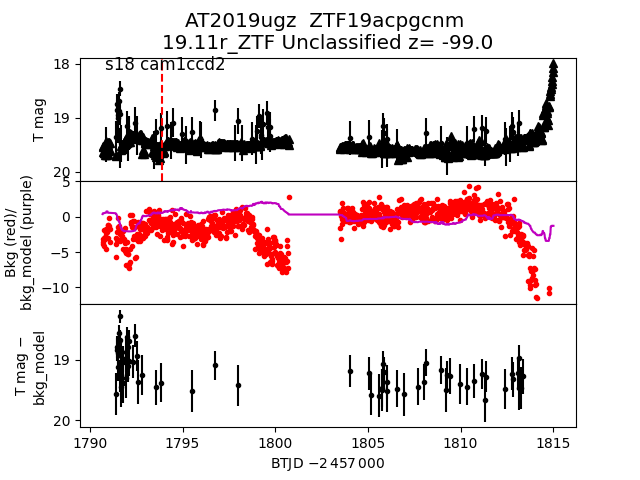
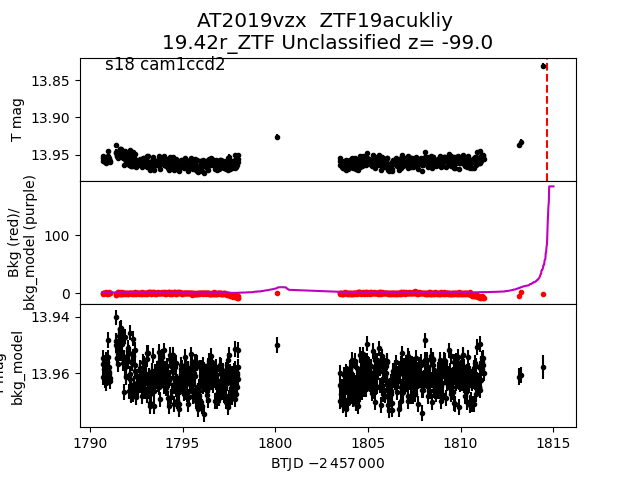
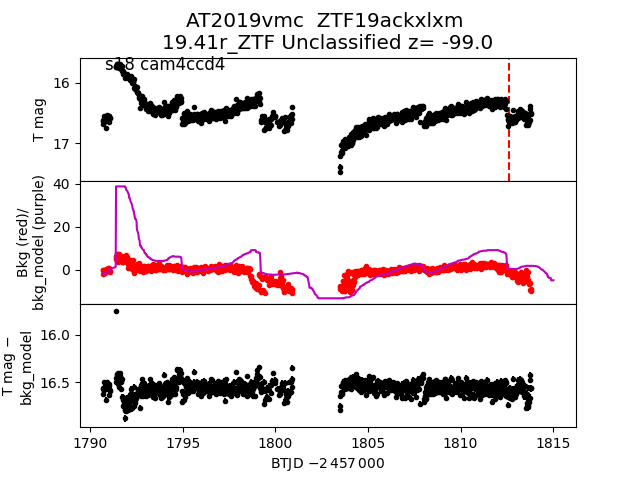
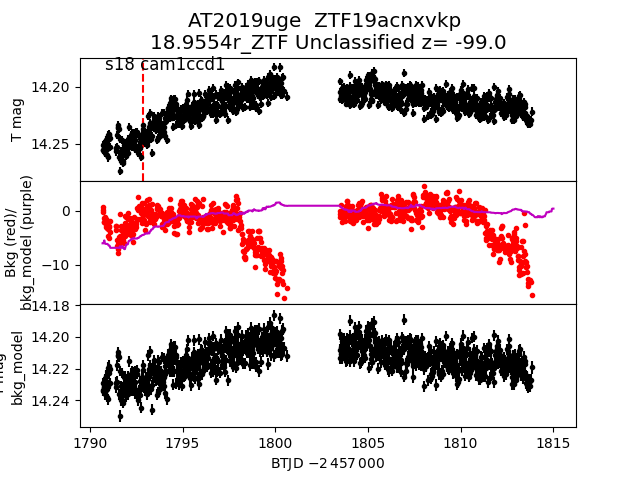
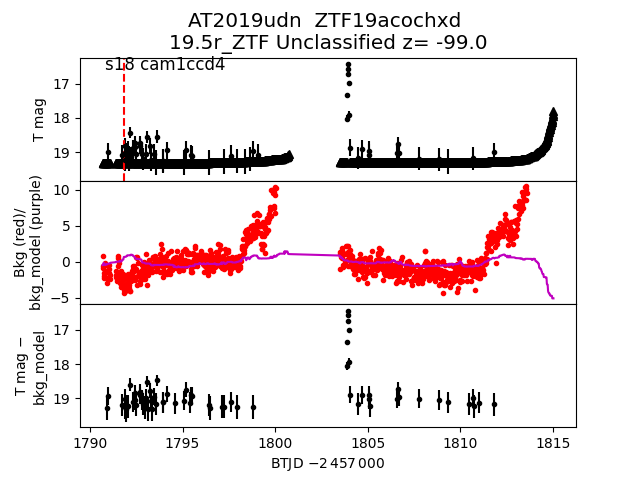
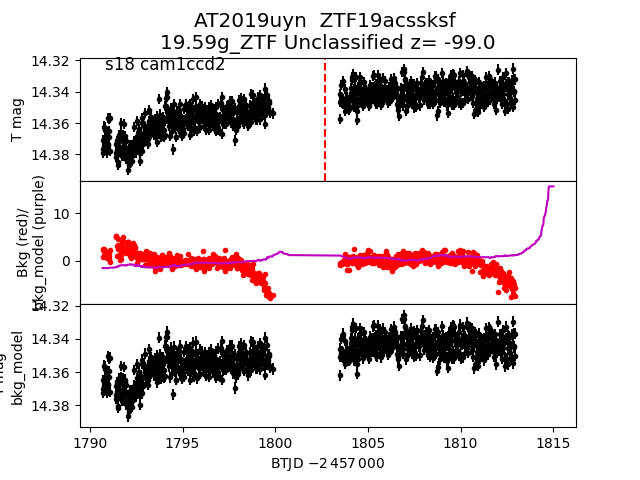
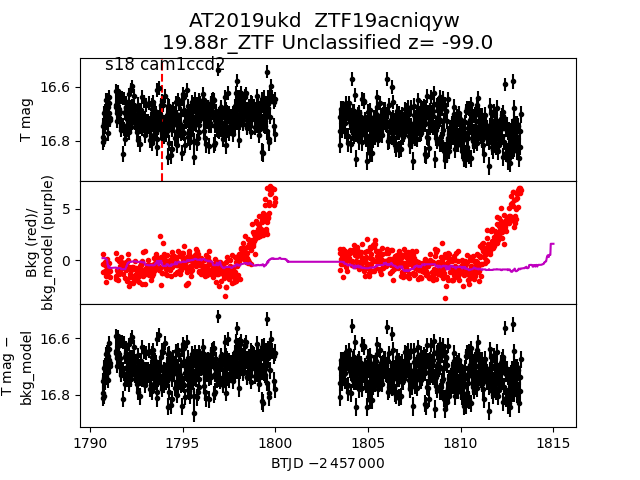
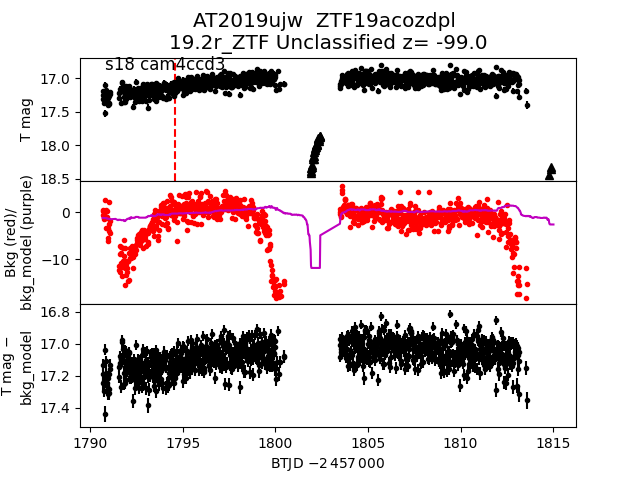
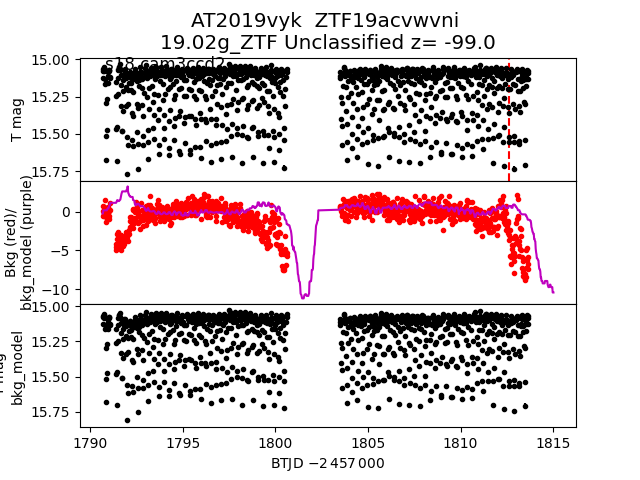
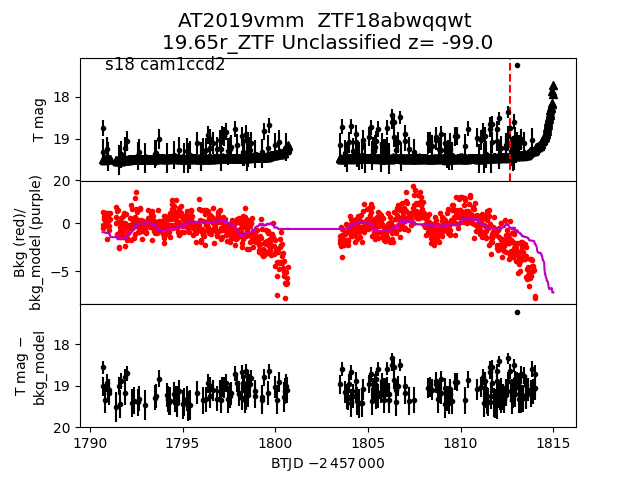
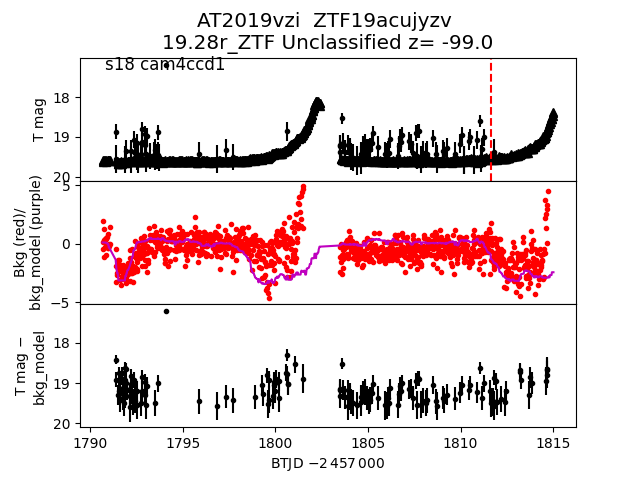
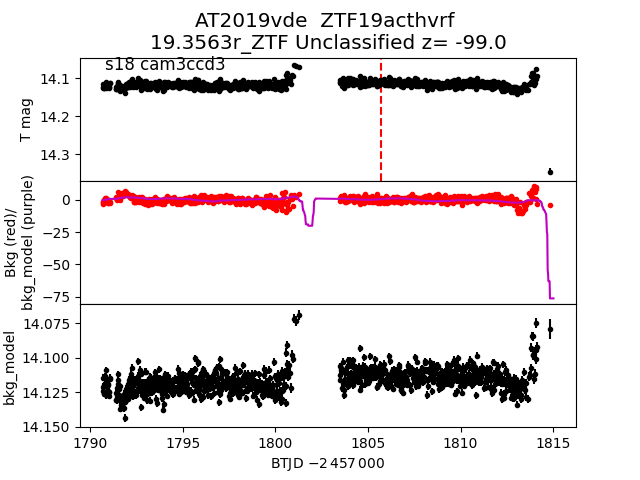
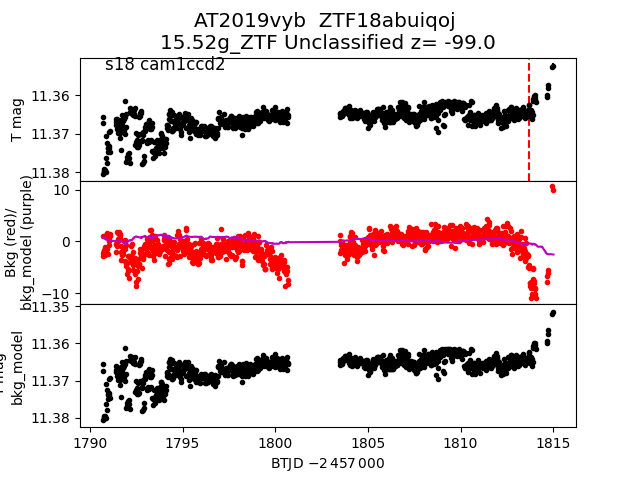
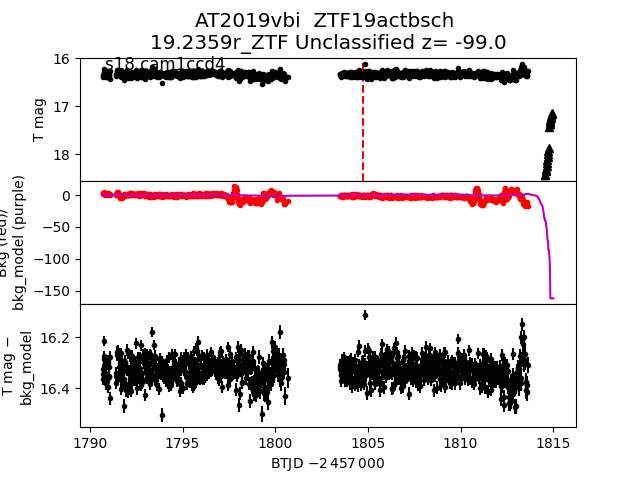
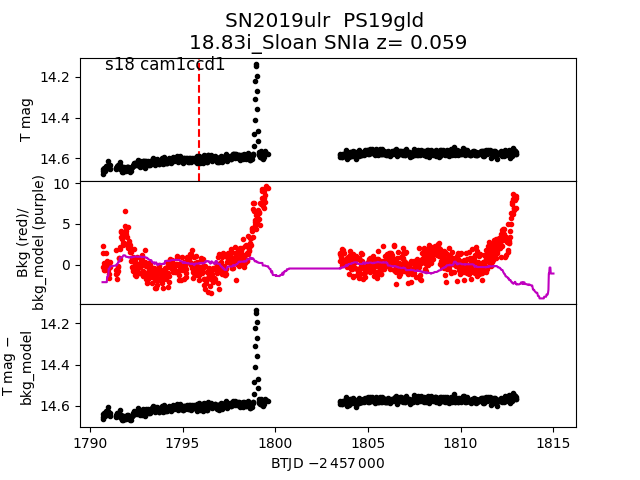
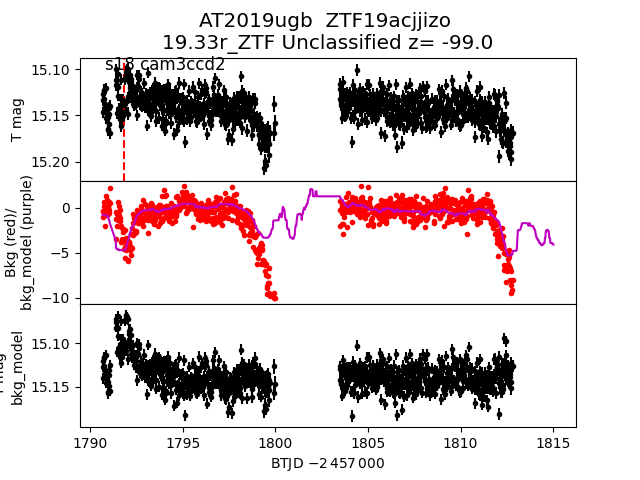
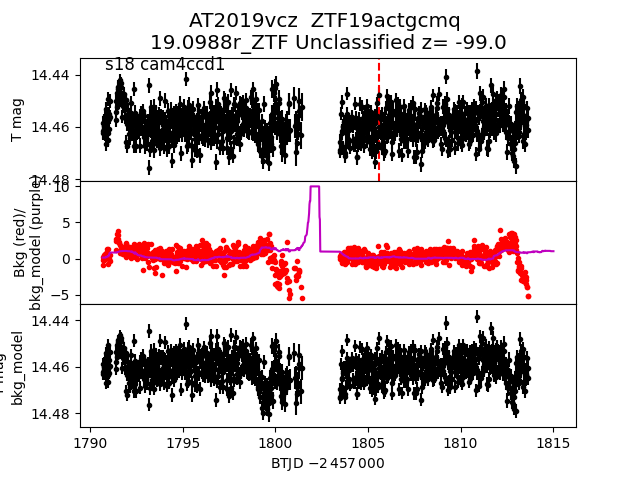
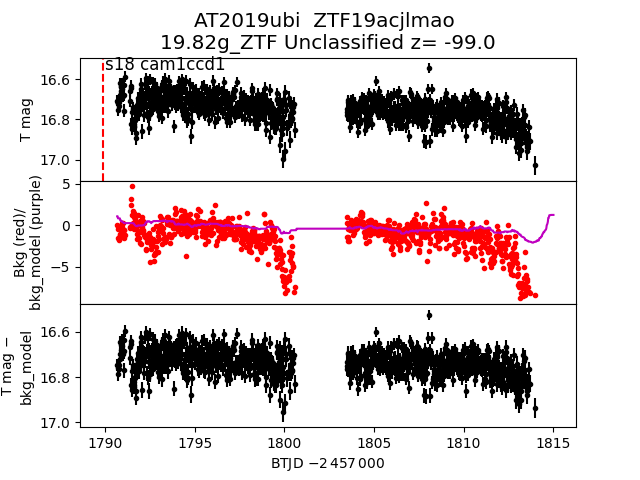
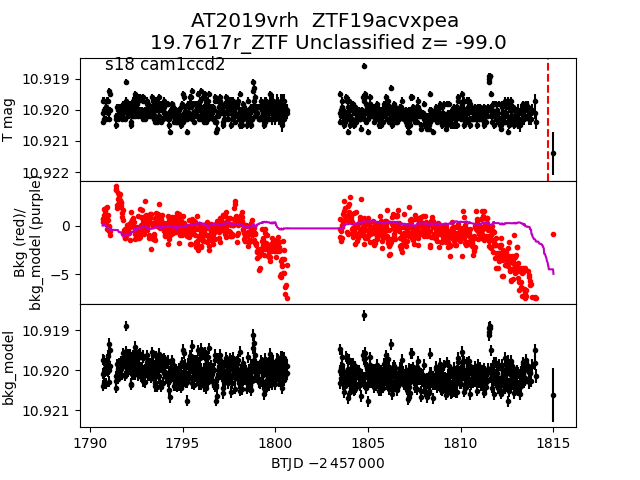
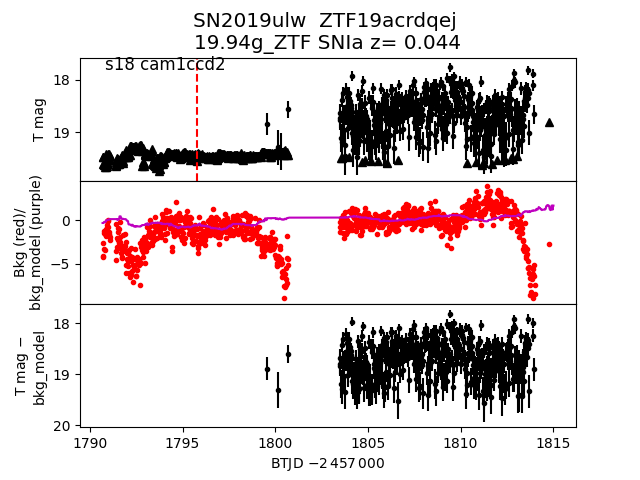
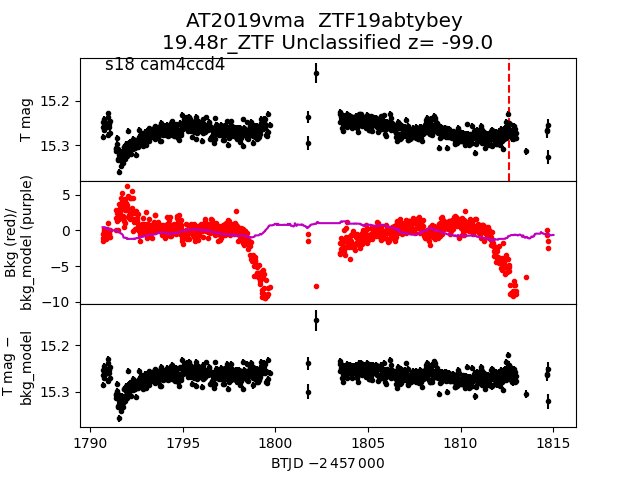
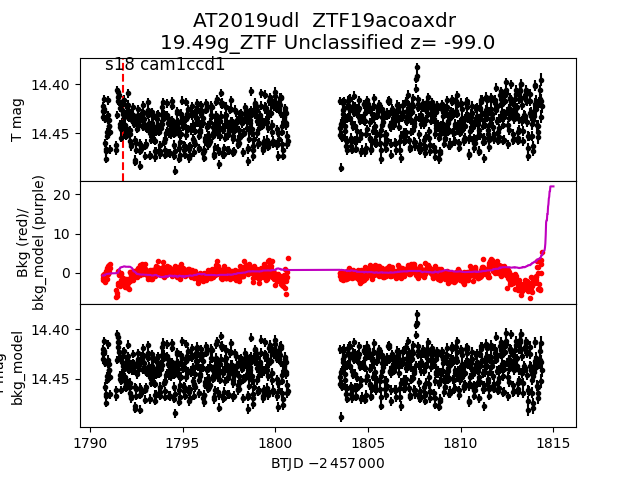
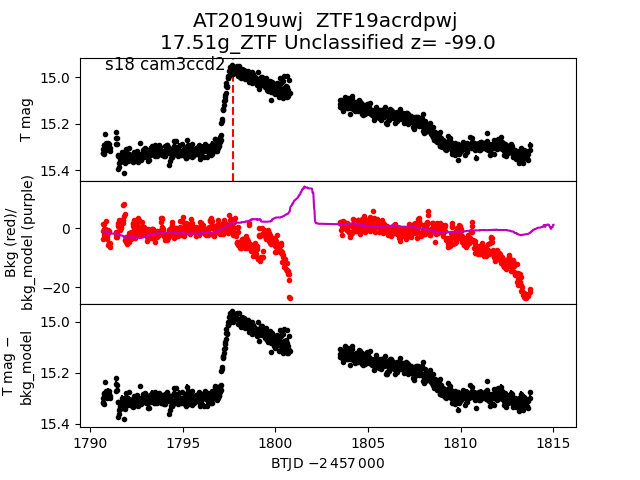
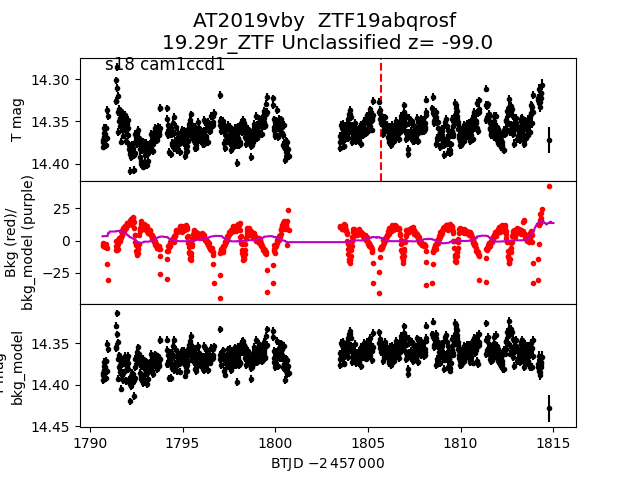
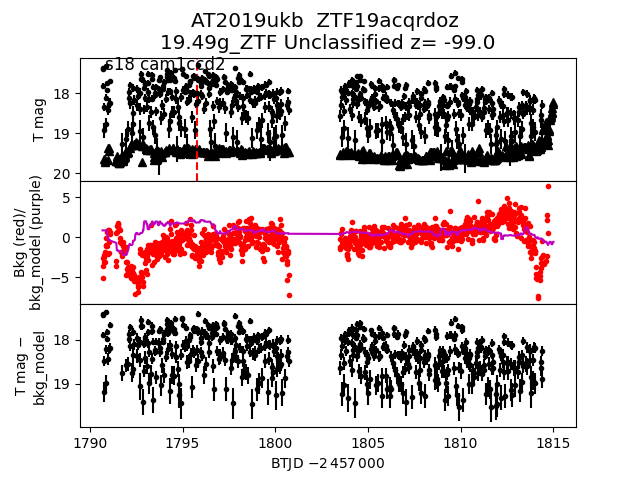
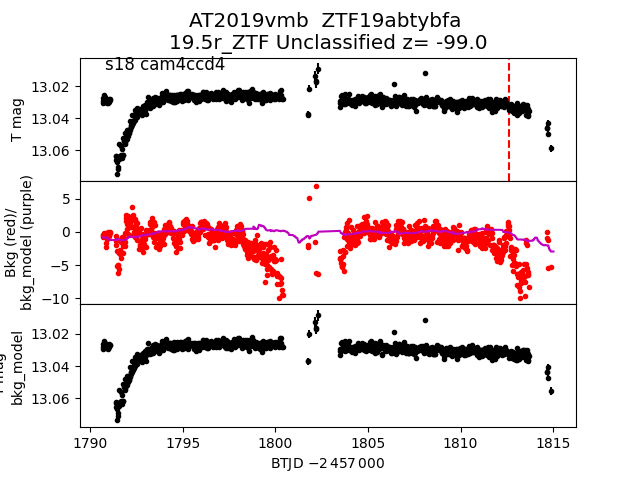
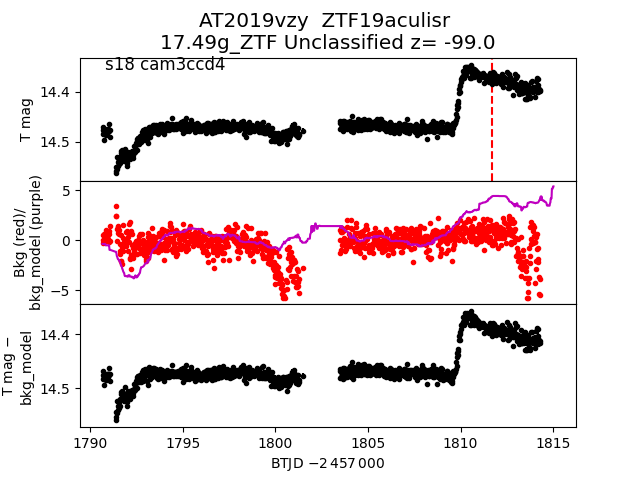
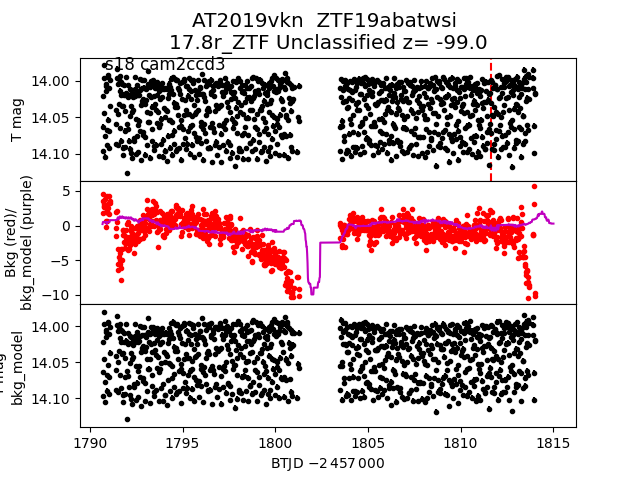
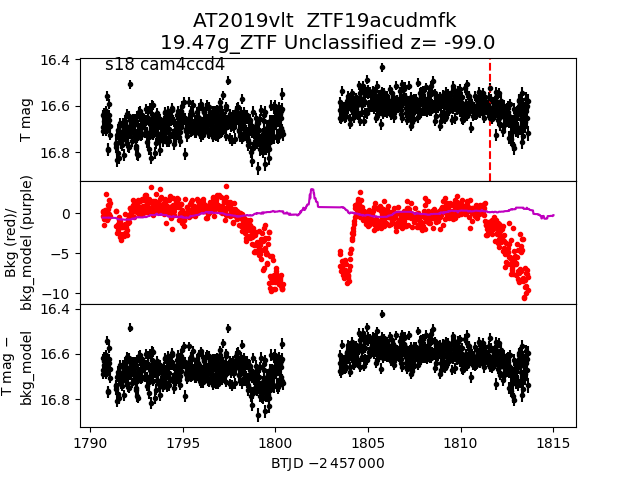
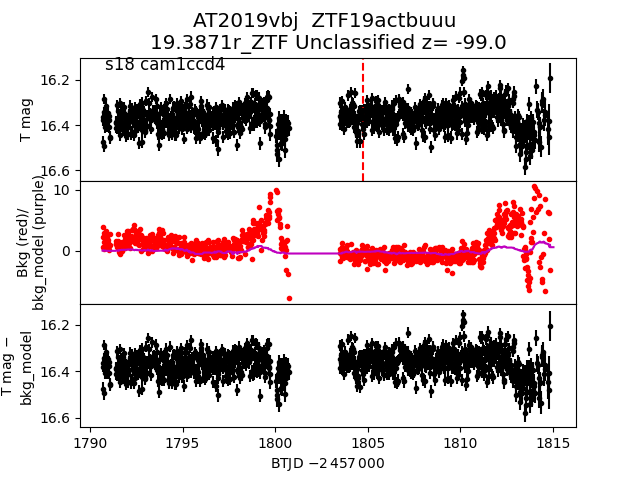
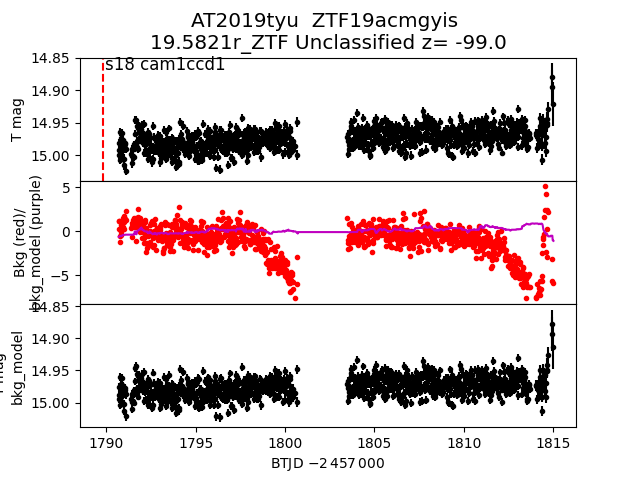
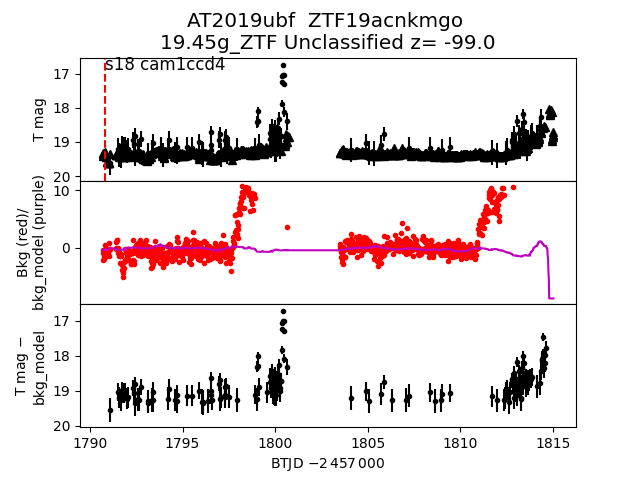
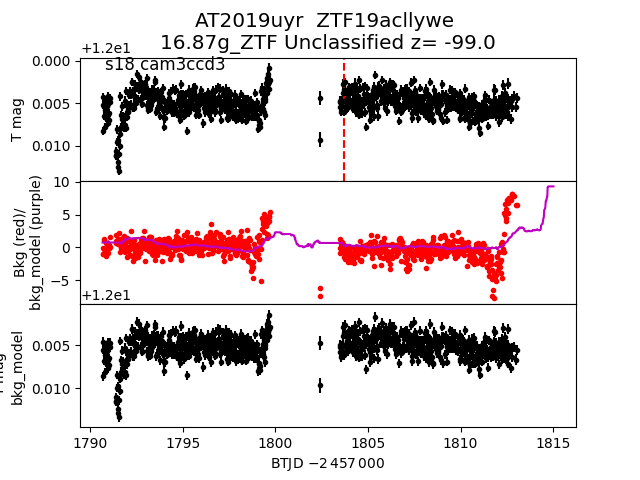
Each figure has three panels. The top panel shows the transient light curve, the middle panel shows the local background (estimated in an annulus), and the bottom panel shows a "background-model corrected" light curve. Details about the background model are in the README.
The vertical red line marks the time of discovery reported to TNS. Other useful metadata from TNS is in the figure title.
Note that the top and bottom panel are in magnitudes, while the middle panel is in differential flux units. The magnitudes are calibrated to the flux in the reference image used for image subtraction. Thus, flux from the host galaxy is included in these magnitudes.
3-sigma upper limits are plotted as triangles with no errorbars. A typical limiting magnitude is 19.6 in 30 minutes or 18.4 in 200 seconds (for low backgrounds).
The links allow you to download the light curve data as a text file.
More details in the README.
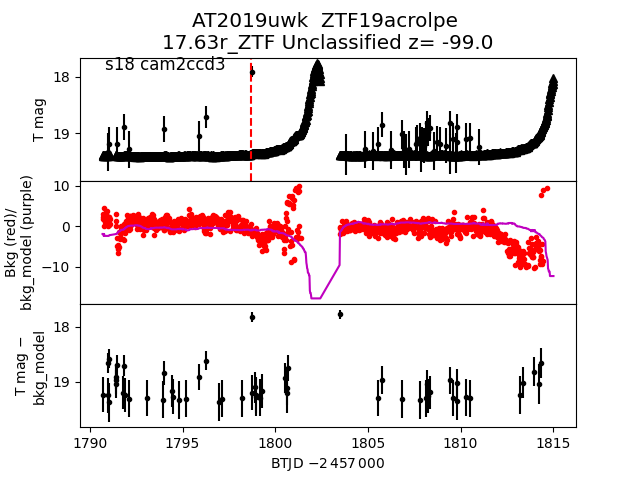
2019uwk
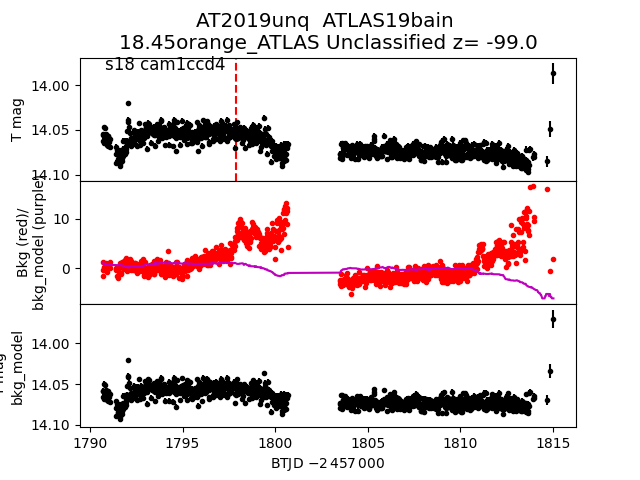
 2019unq
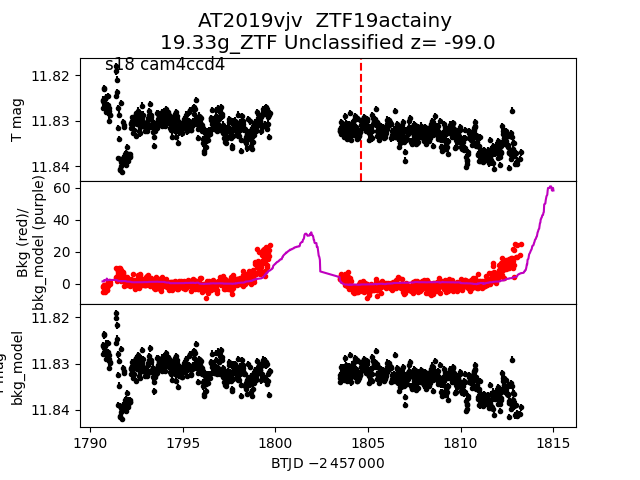
 2019vjv
 2019ufu
 2019uje
 2019ukv
 2019ulv
 2019vyf
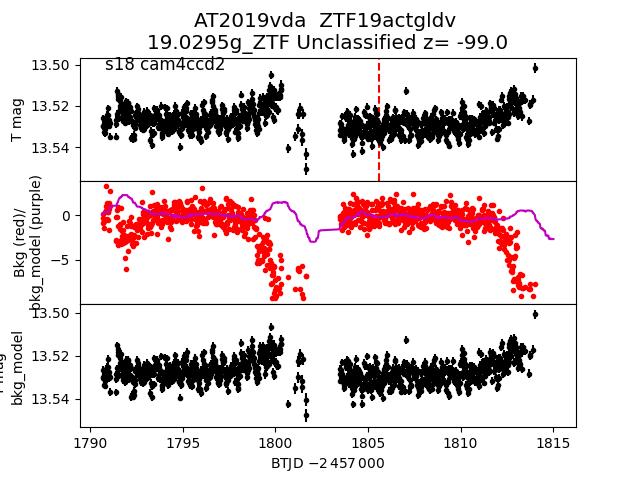
 2019vda
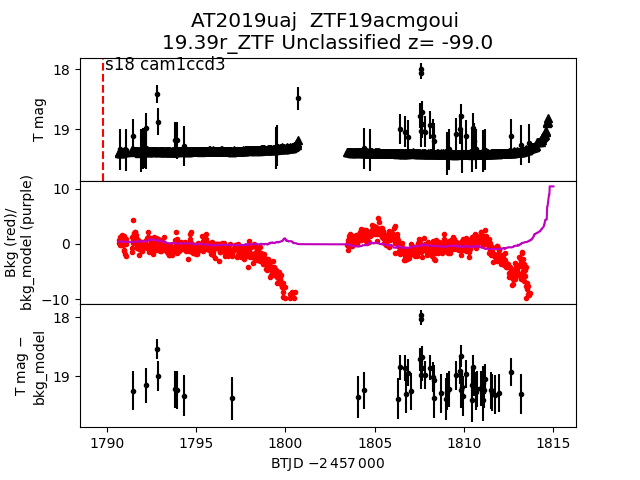
 2019uaj
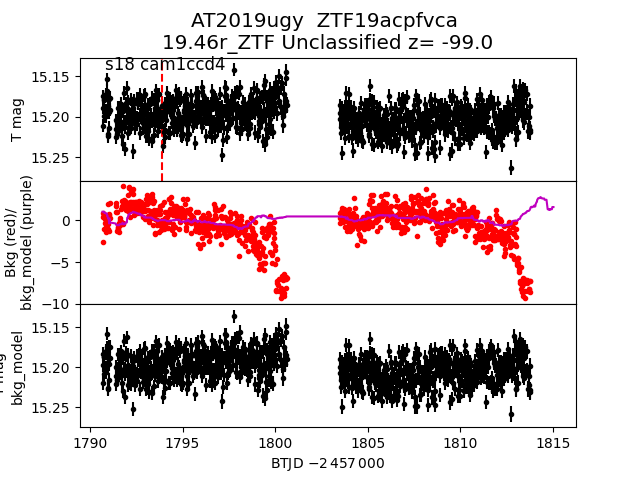
 2019ugy
 2019uem
 2019uca
 2019vli
 2019ubd
 2019ufy
 2019ule
 2019wbo
 2019vyj
 2019ufz
 2019ulr_detrended
 2019uen
 2019vlu
 2019val
 2019ugz
 2019vzx
 2019vmc
 2019uge
 2019udn
 2019uyn
 2019ukd
 2019ujw
 2019vyk
 2019vmm
 2019vzi
 2019vde
 2019vyb
 2019vbi
 2019ulr
 2019ugb
 2019vcz
 2019ubi
 2019vrh
 2019ulw
 2019vma
 2019udl
 2019uwj
 2019vby
 2019ukb
 2019ugr
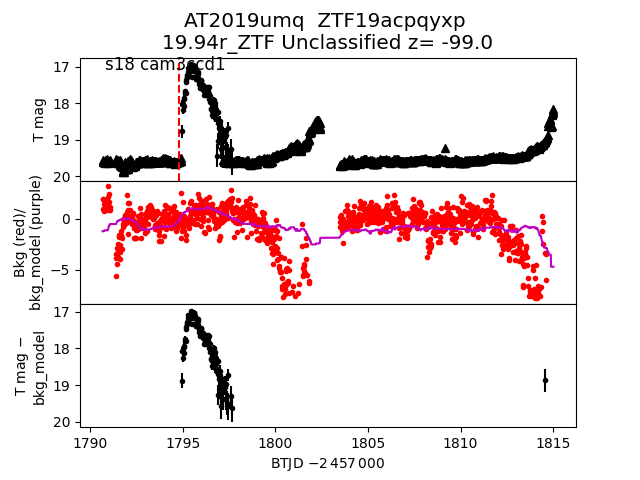
 2019umq
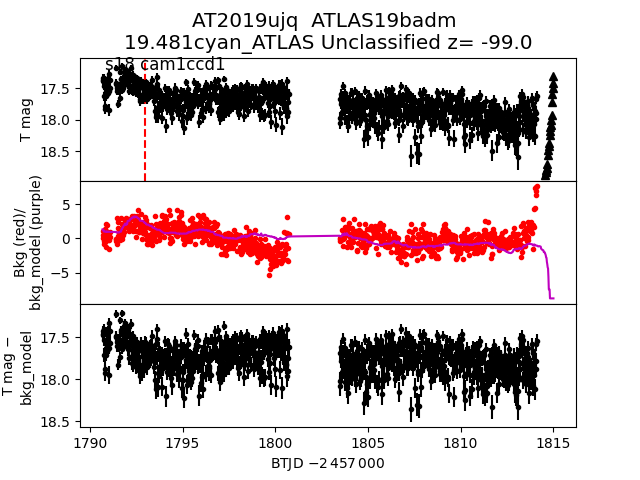
 2019ujq
 2019vmb
 2019vzy
 2019vkn
 2019vlt
 2019vbj
 2019tyu
 2019ubf
 2019uyr
 2019ujt