all transients in sector17 (89 total)
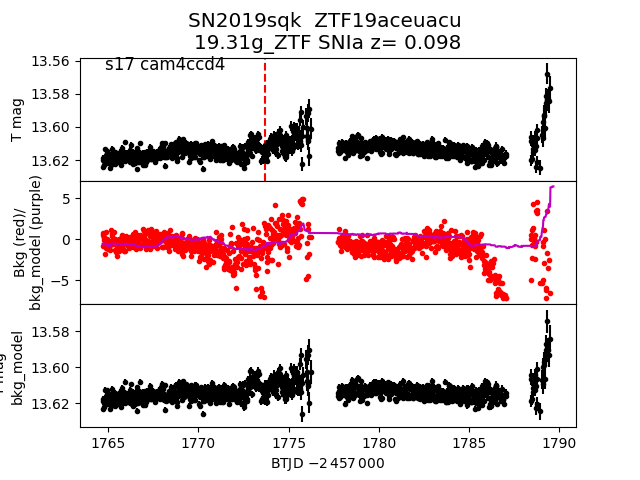
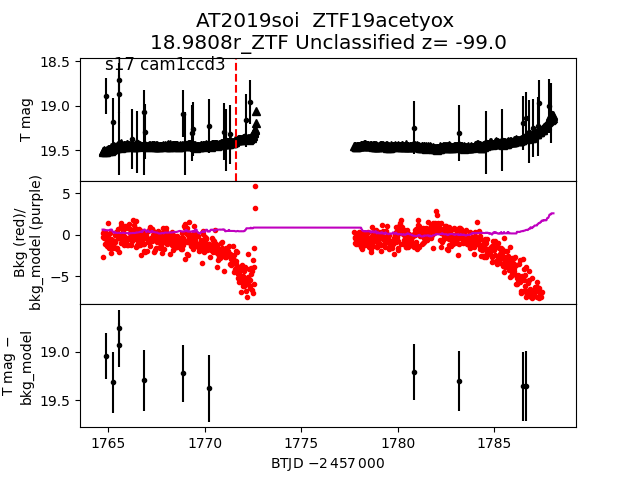
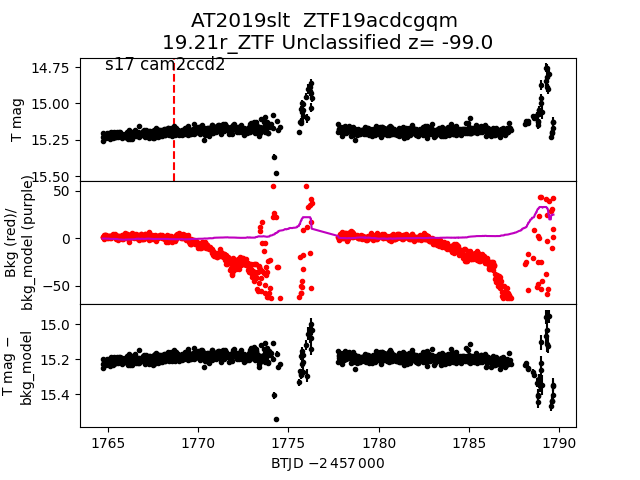
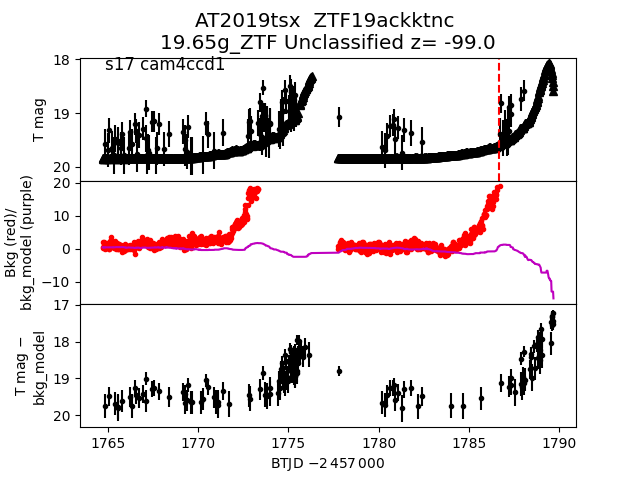
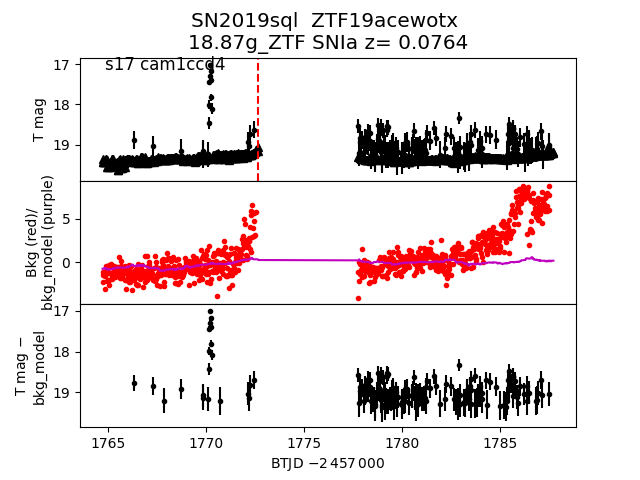
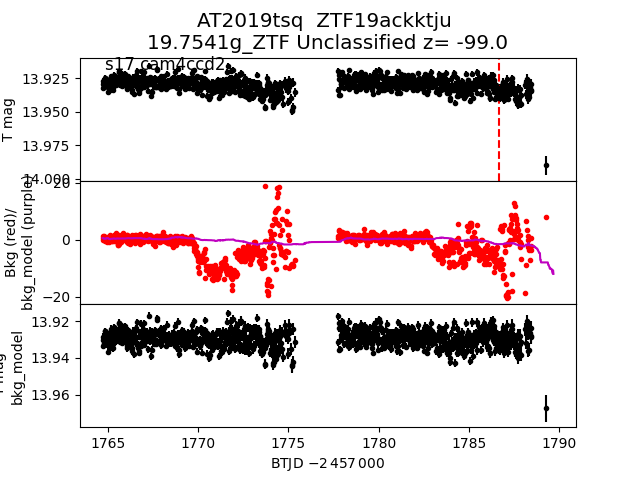
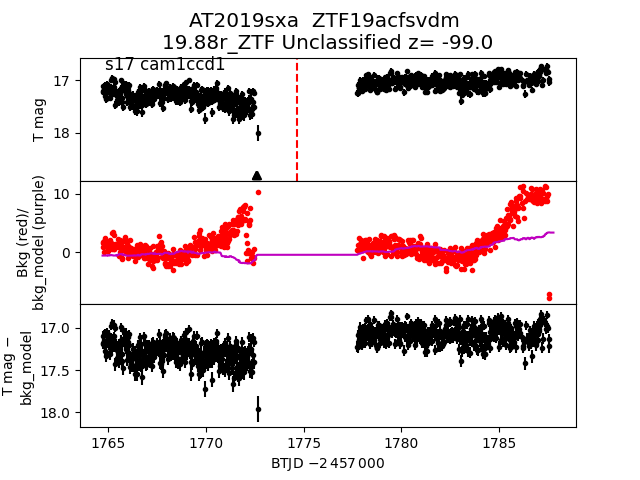
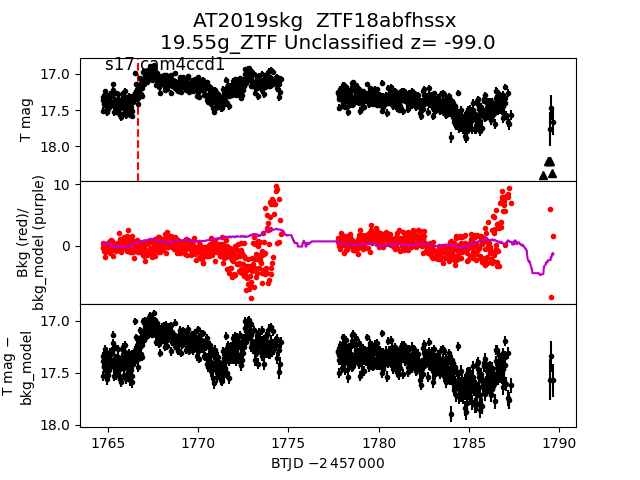
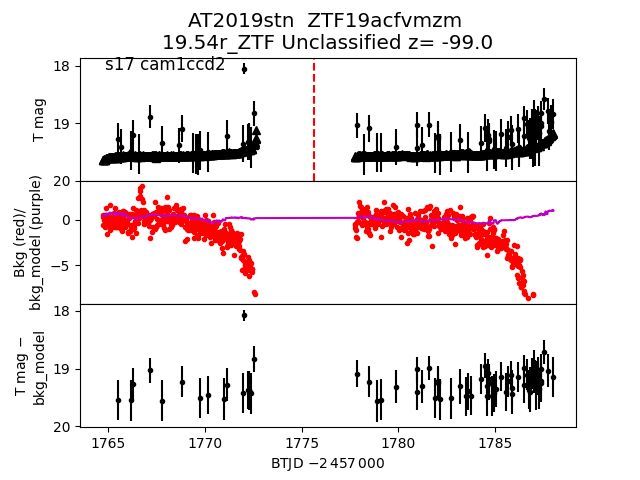
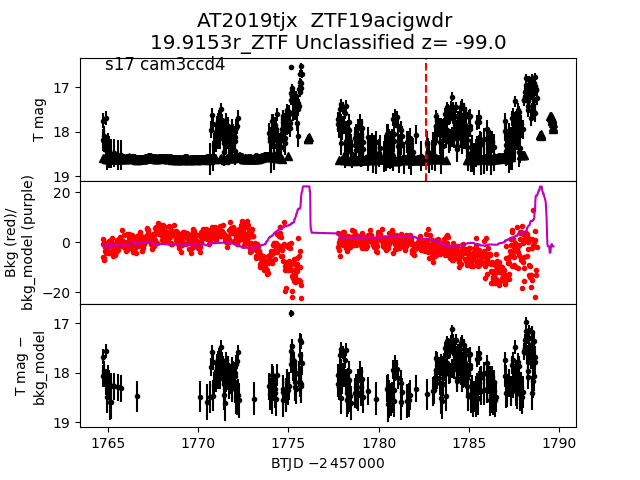
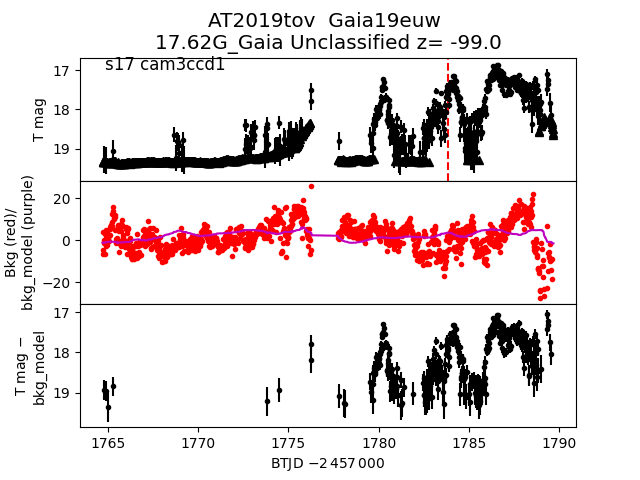
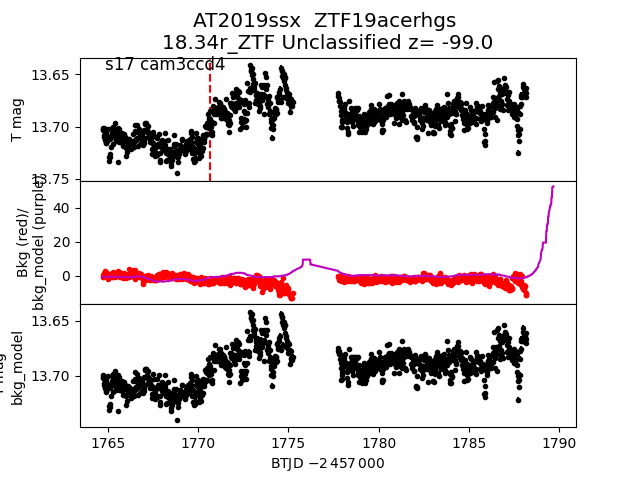
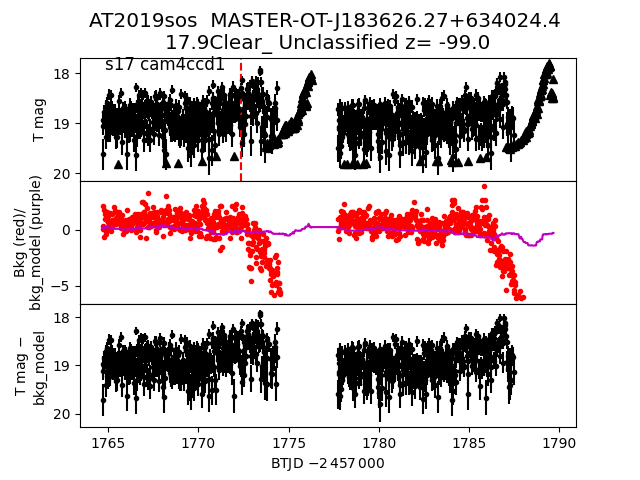
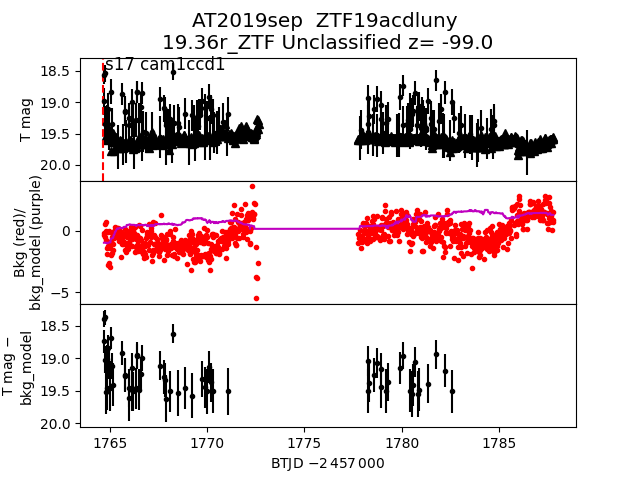
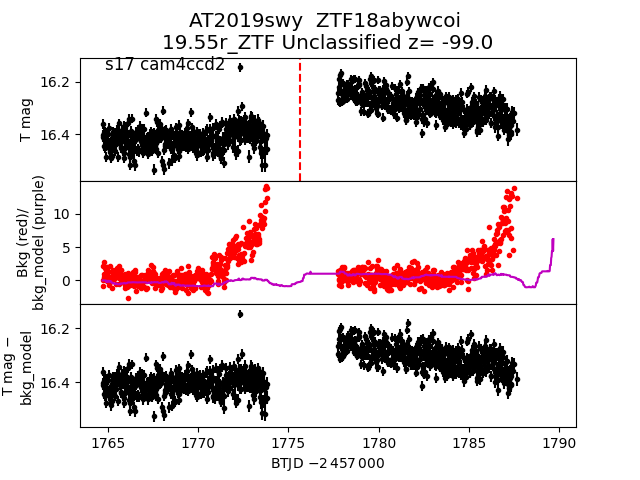
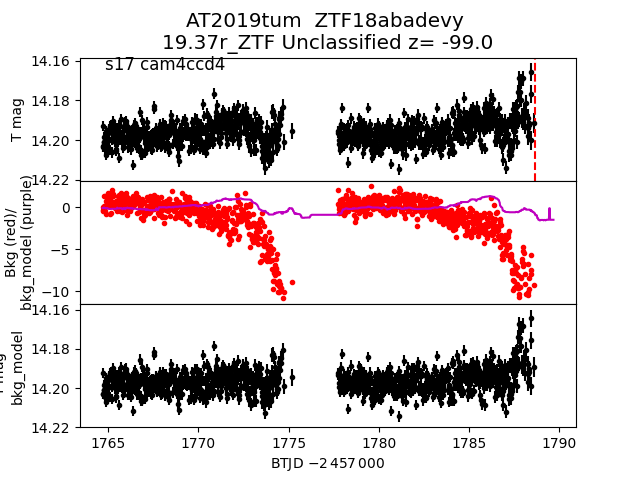
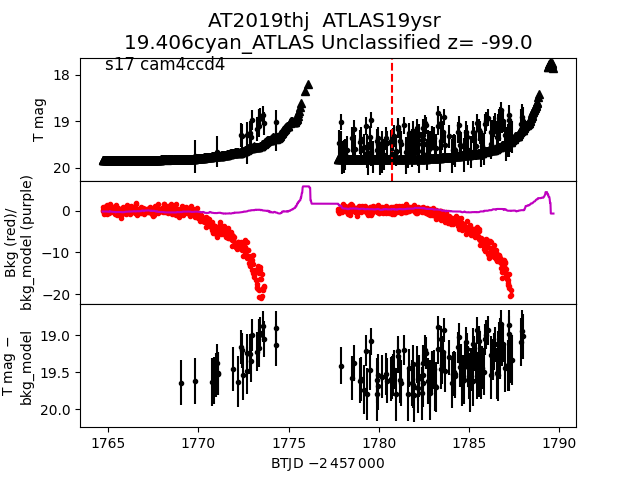
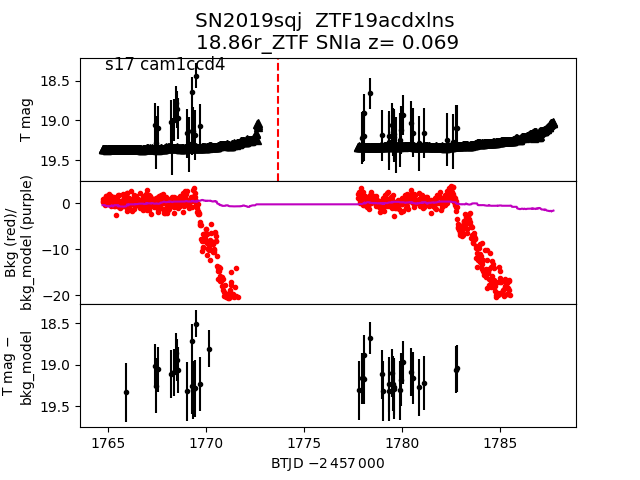
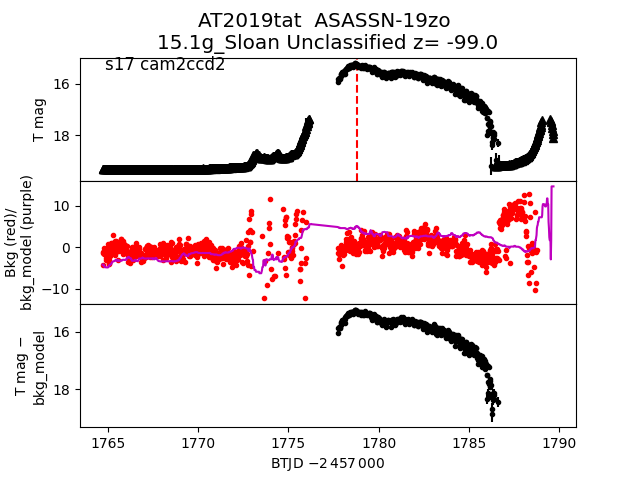
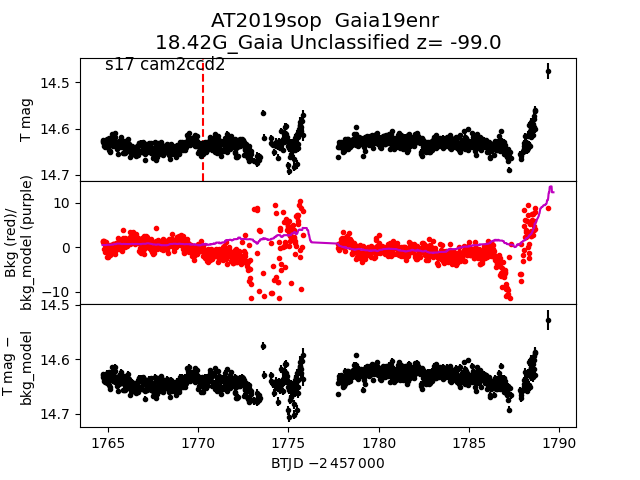
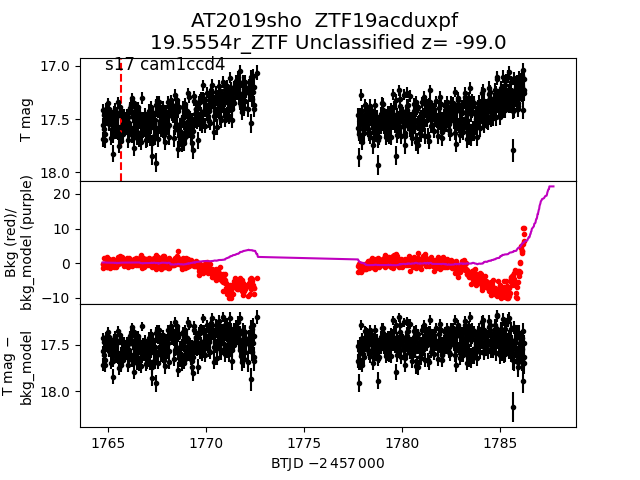
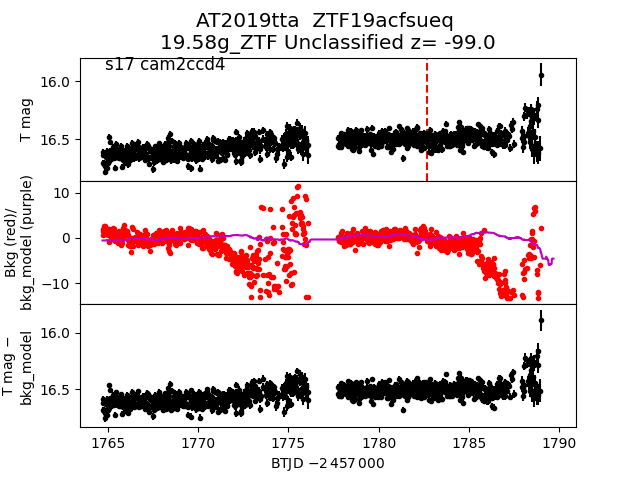
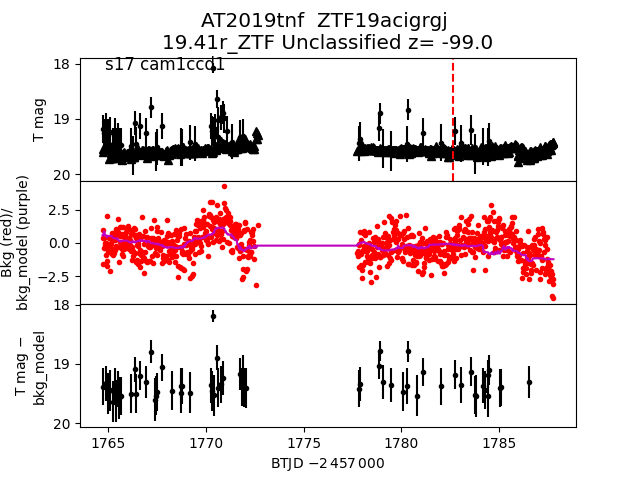
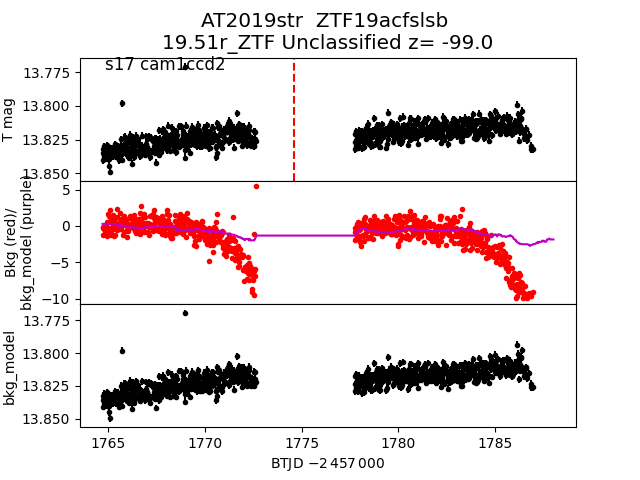
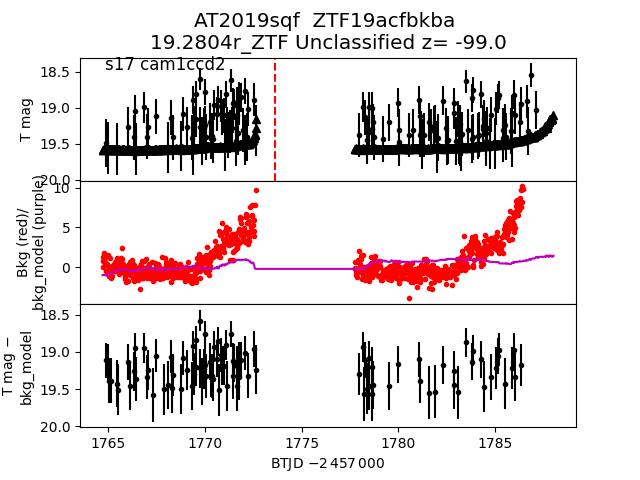
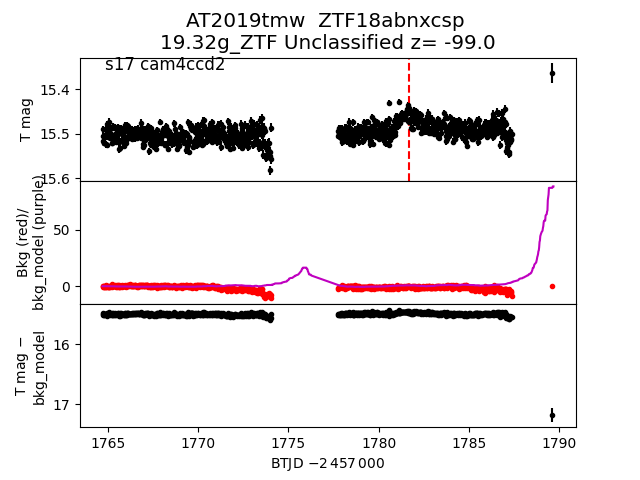
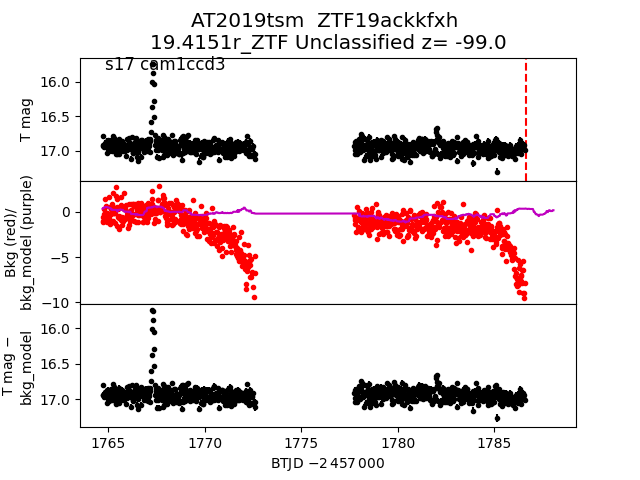
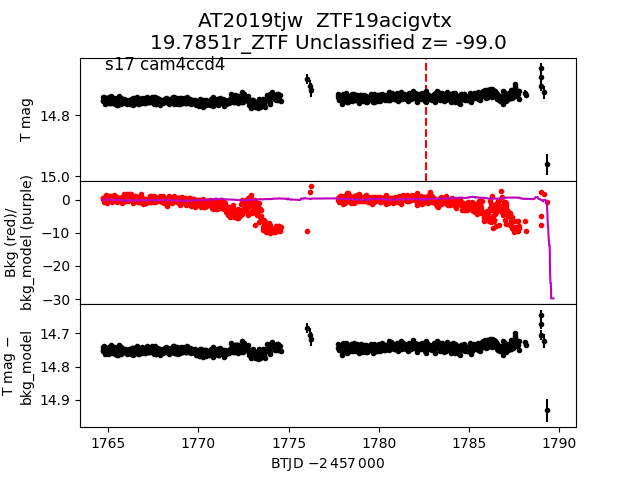
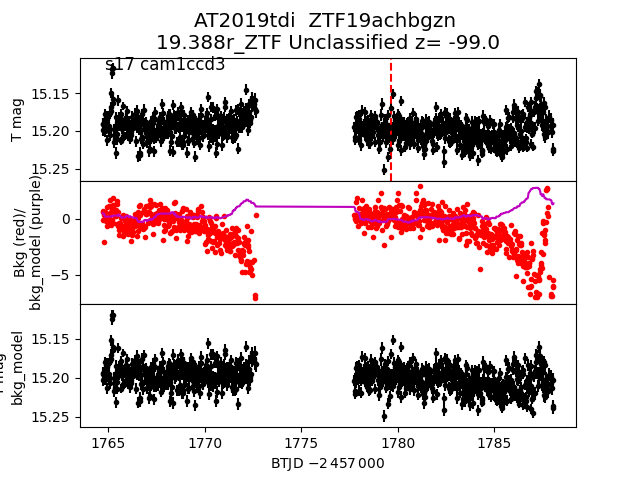
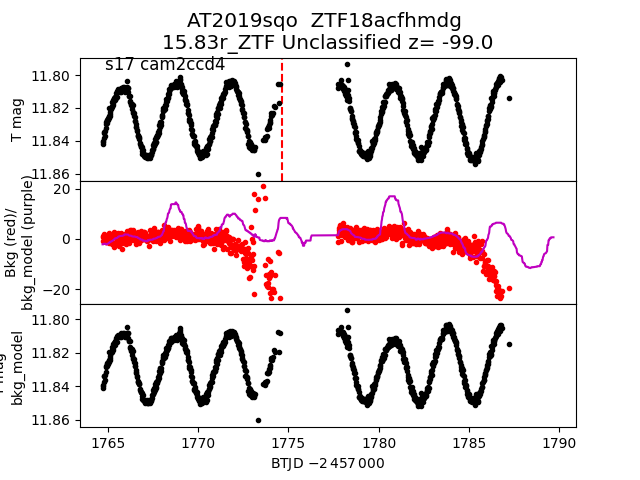
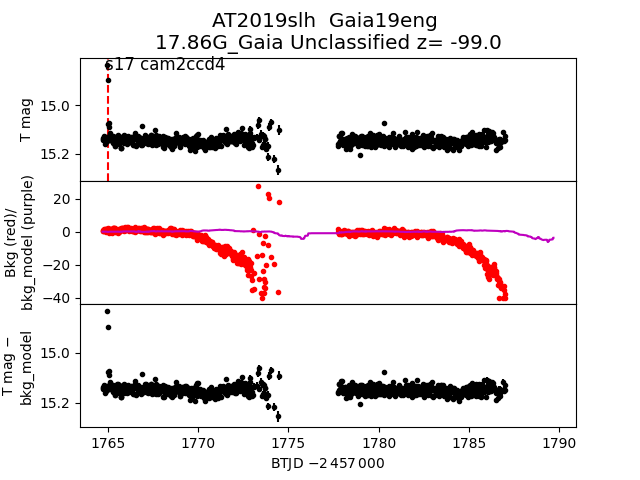
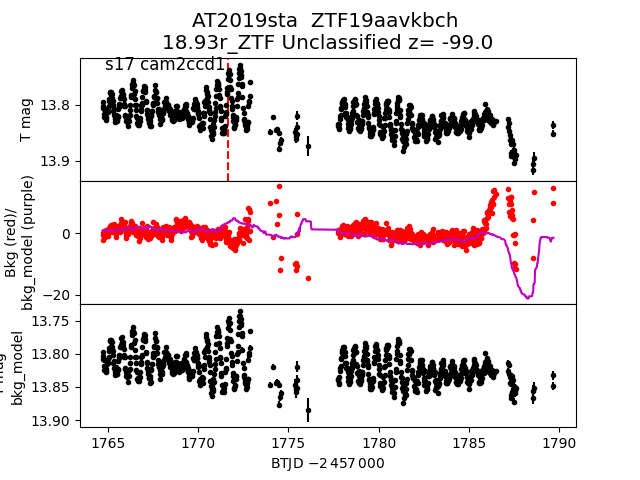
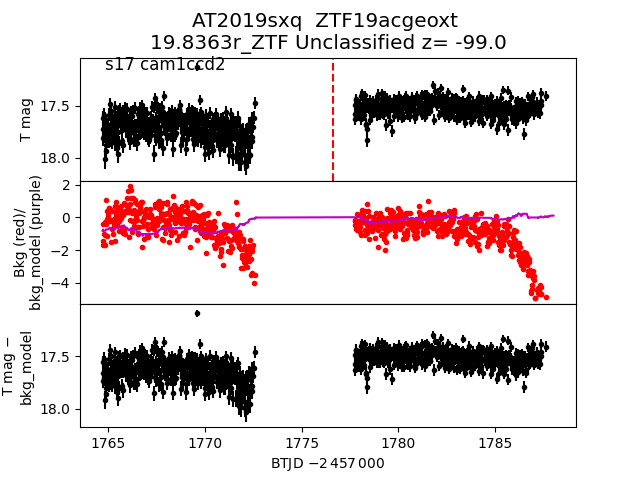
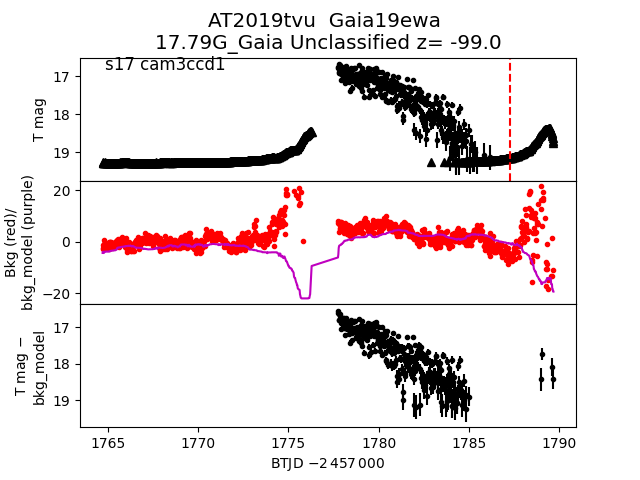
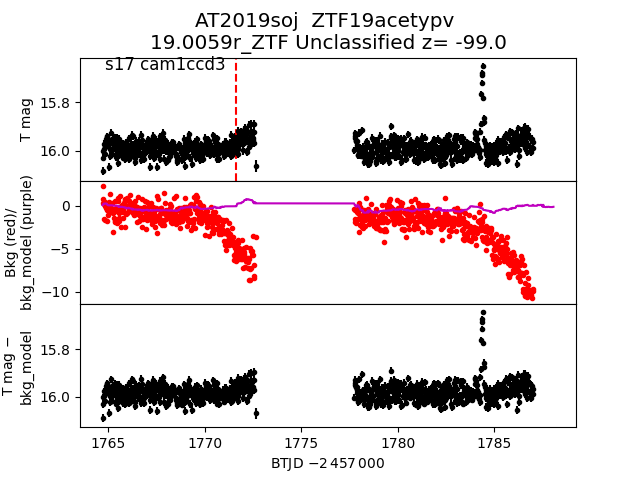
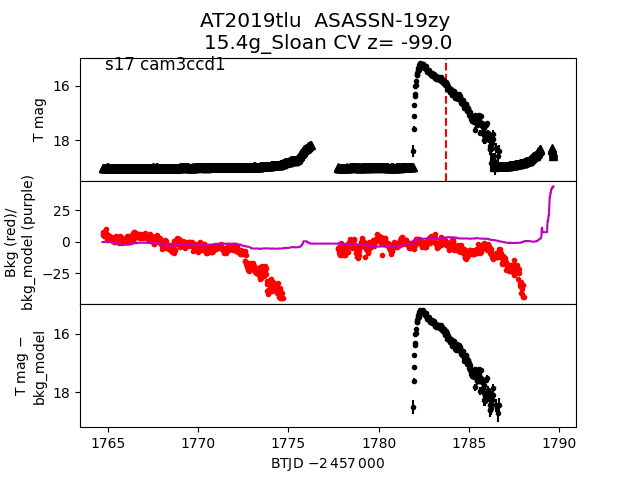
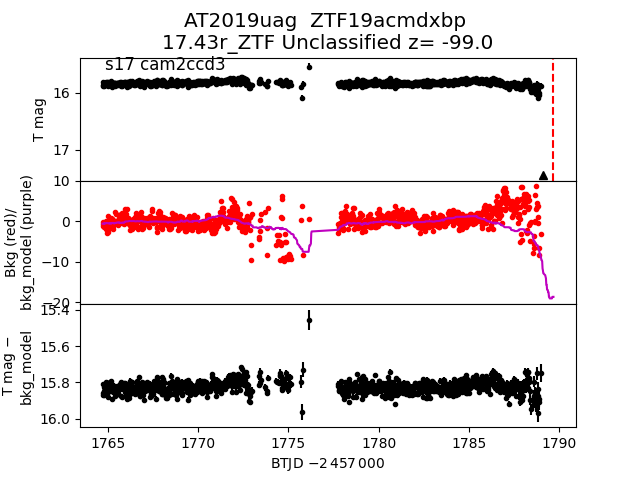
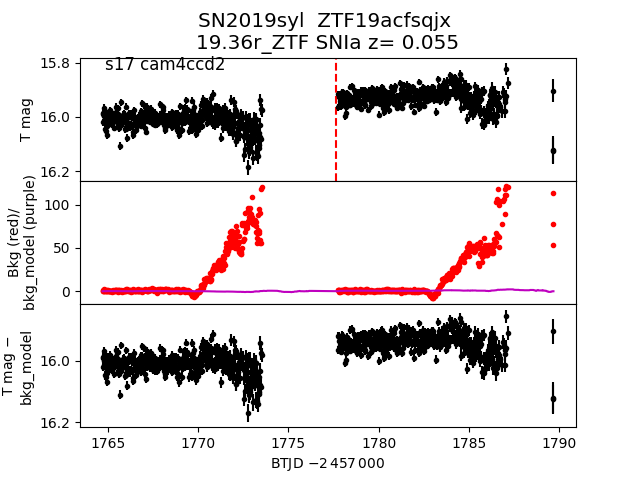
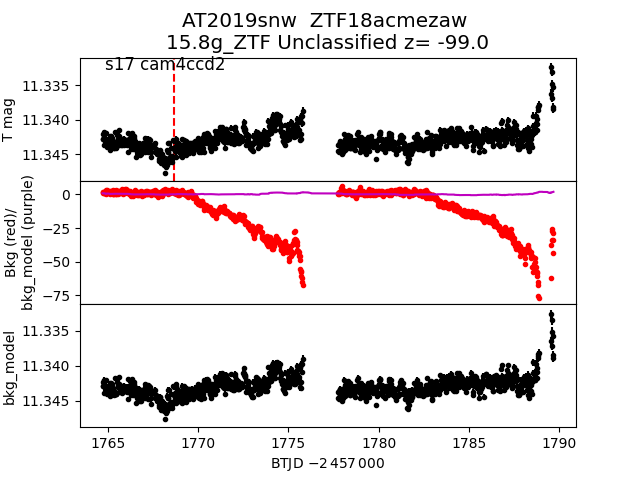
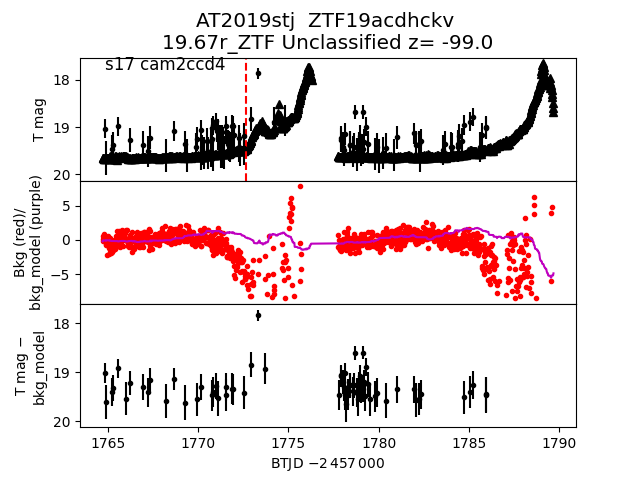
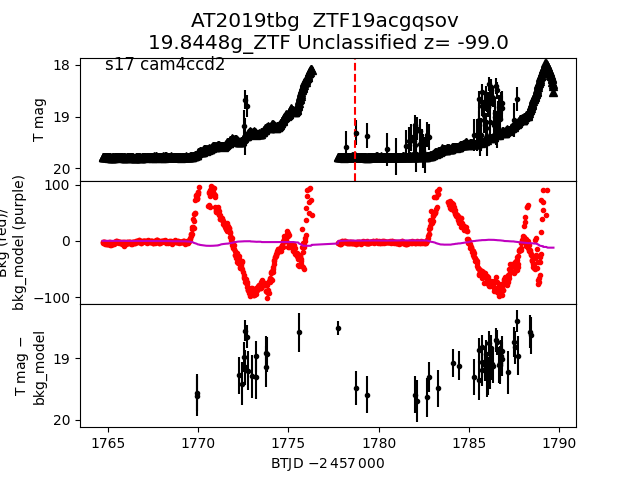
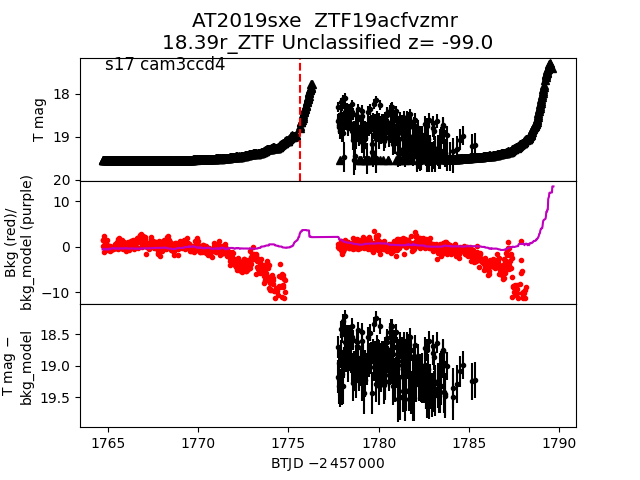
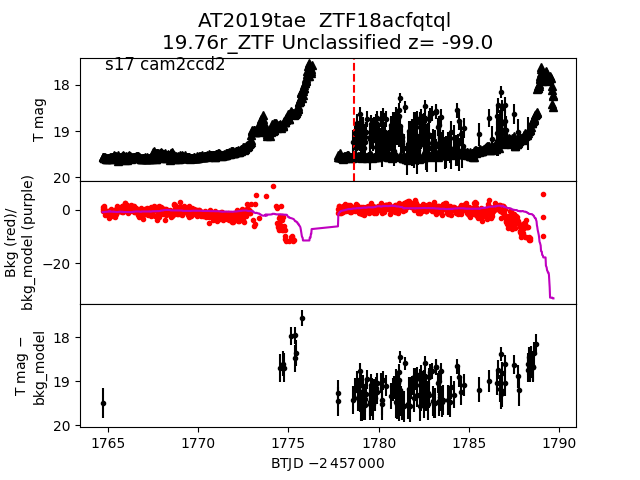
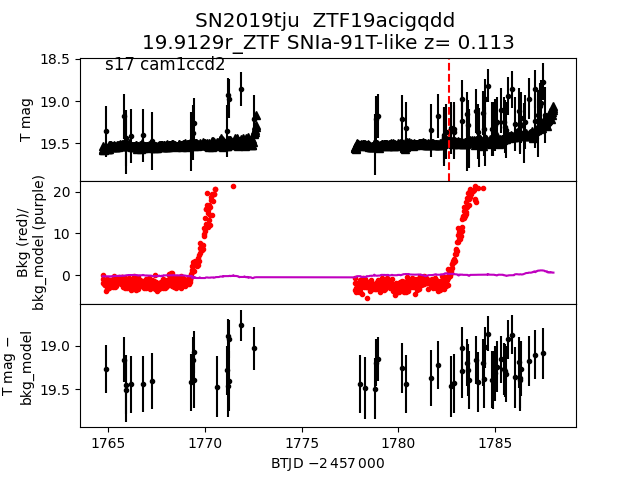
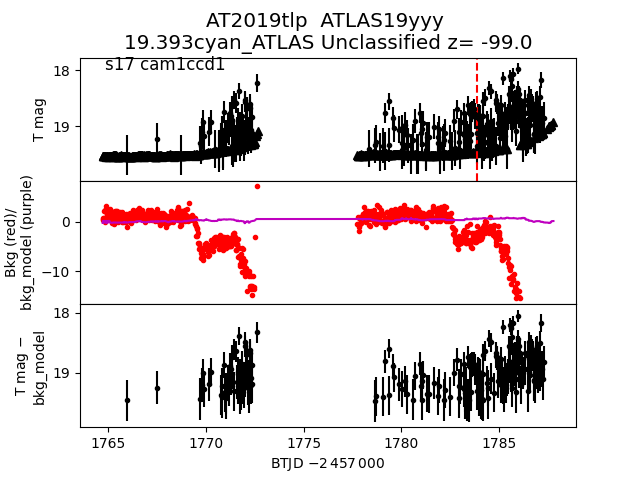
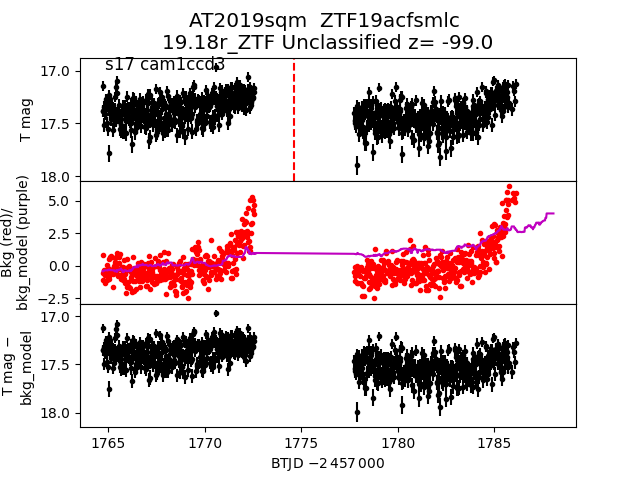
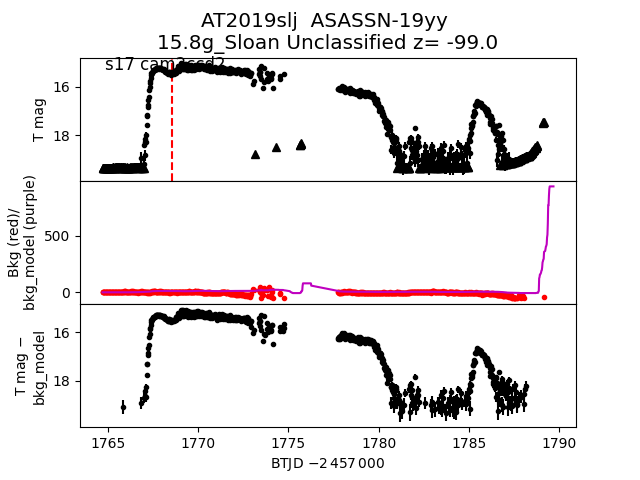
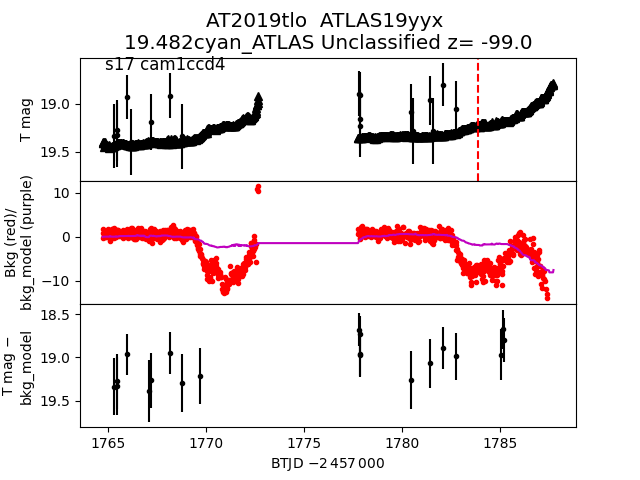
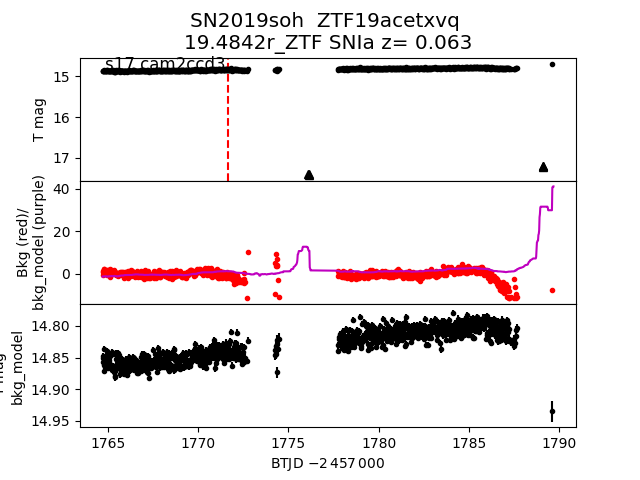
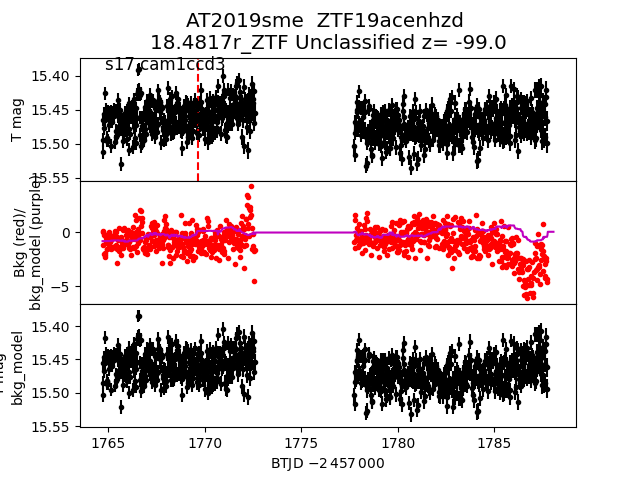
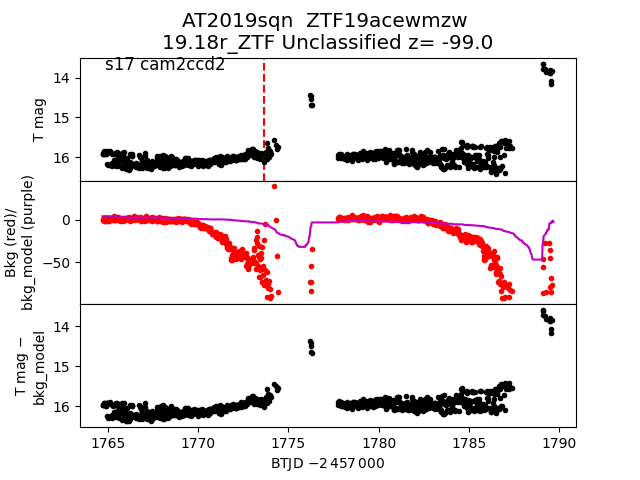
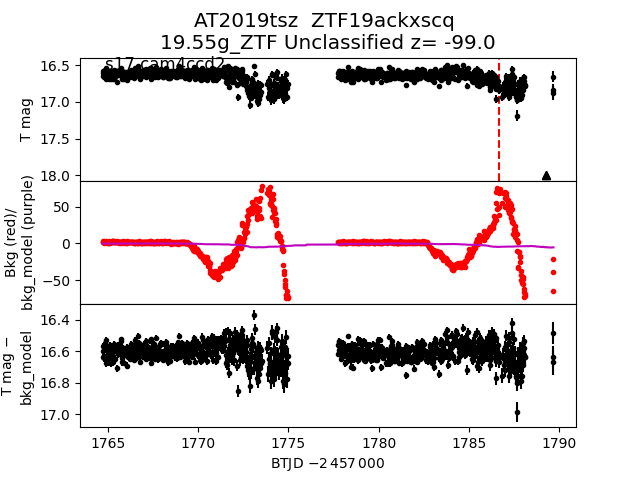
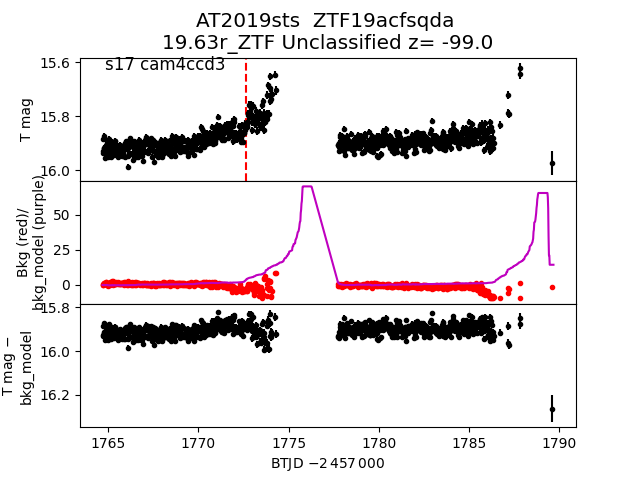
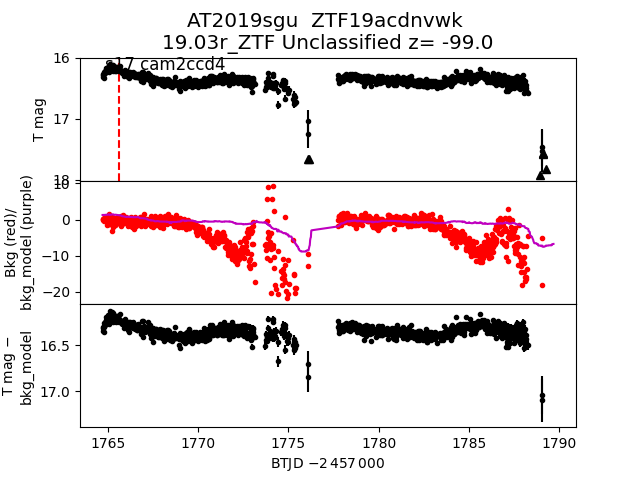
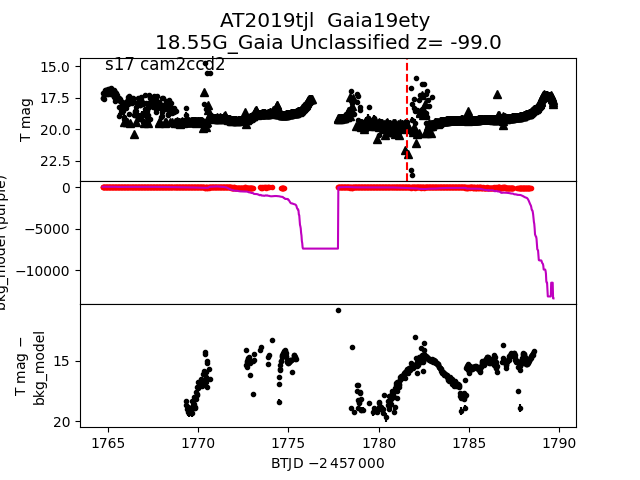
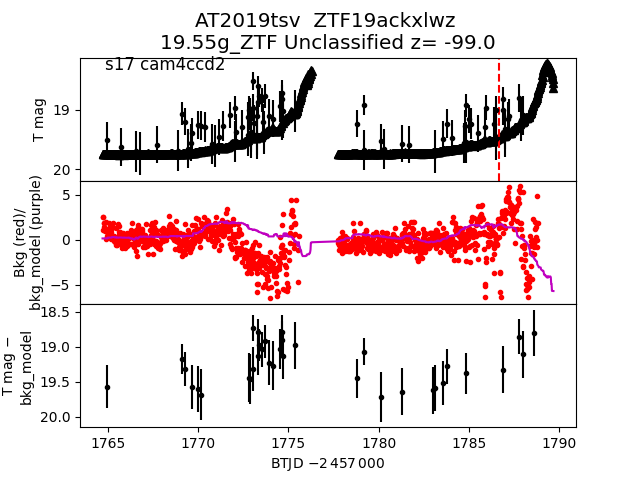
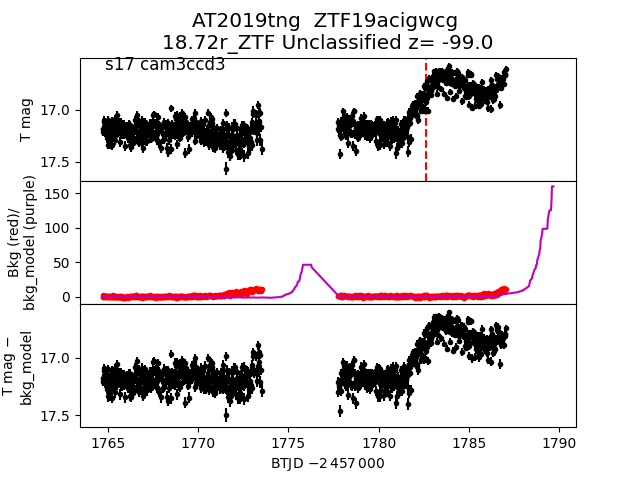
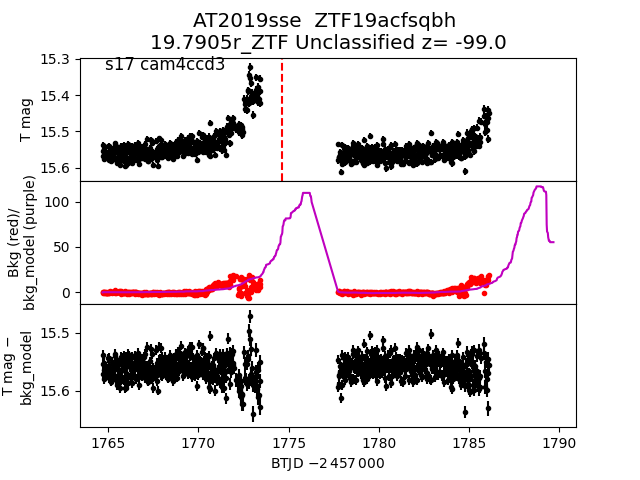
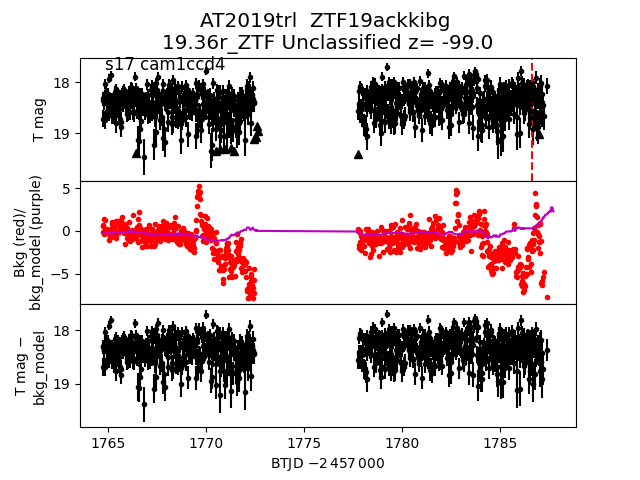
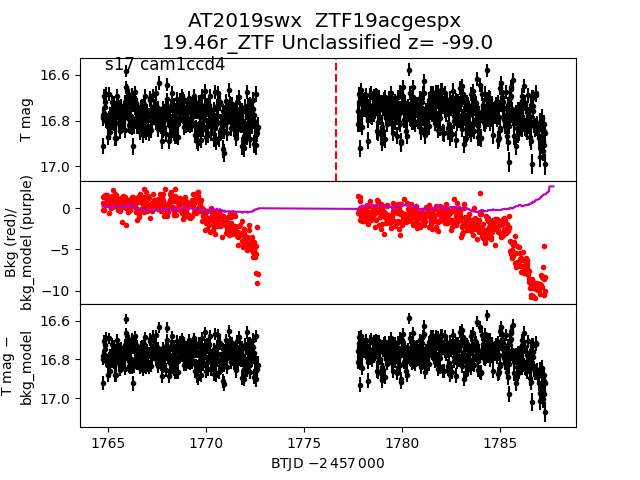
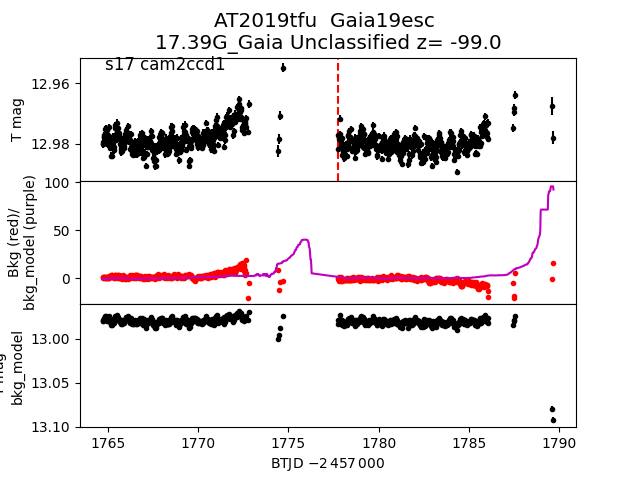
Each figure has three panels. The top panel shows the transient light curve, the middle panel shows the local background (estimated in an annulus), and the bottom panel shows a "background-model corrected" light curve. Details about the background model are in the README.
The vertical red line marks the time of discovery reported to TNS. Other useful metadata from TNS is in the figure title.
Note that the top and bottom panel are in magnitudes, while the middle panel is in differential flux units. The magnitudes are calibrated to the flux in the reference image used for image subtraction. Thus, flux from the host galaxy is included in these magnitudes.
3-sigma upper limits are plotted as triangles with no errorbars. A typical limiting magnitude is 19.6 in 30 minutes or 18.4 in 200 seconds (for low backgrounds).
The links allow you to download the light curve data as a text file.
More details in the README.
2019soi
 2019slt
 2019tsx
 2019sql
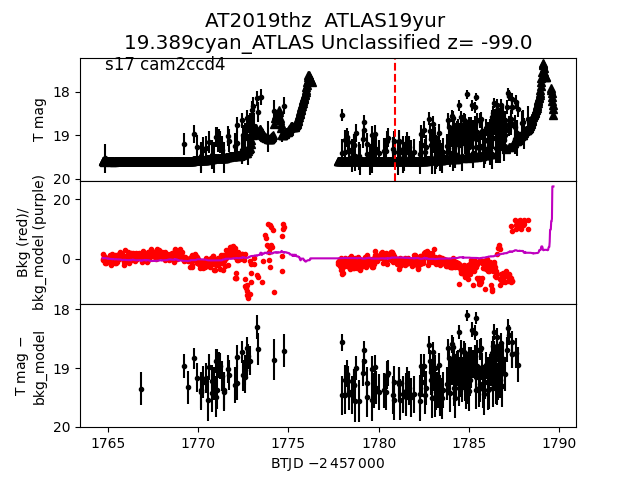
 2019thz
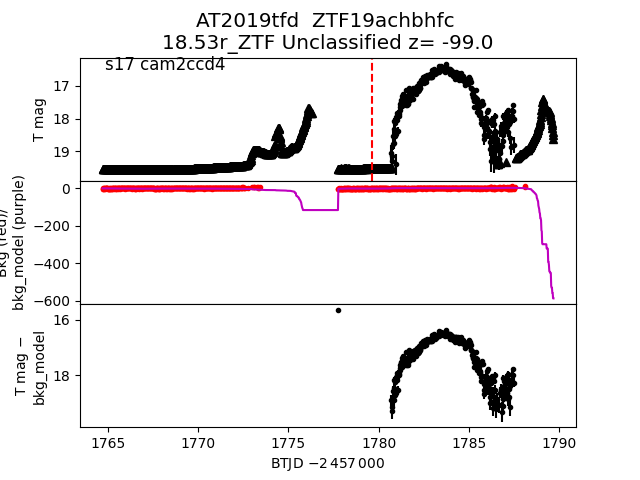
 2019tfd
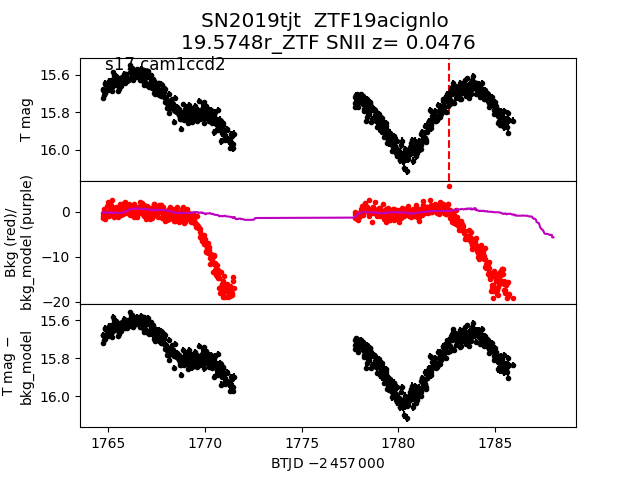
 2019tjt
 2019tsq
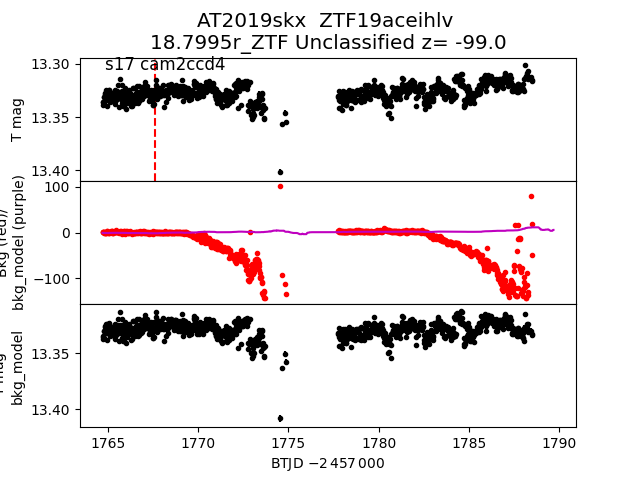
 2019skx
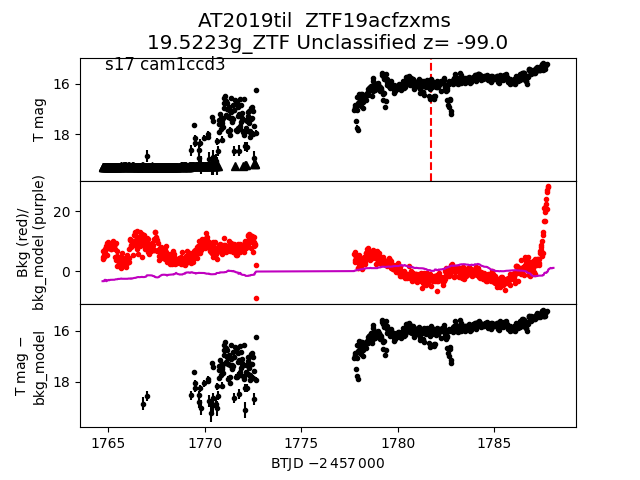
 2019til
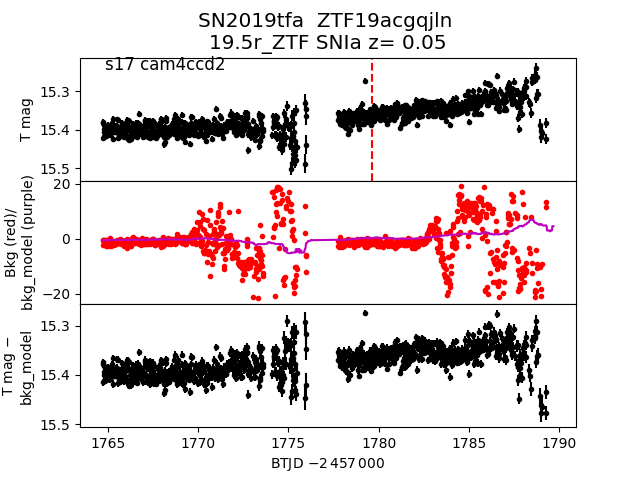
 2019tfa
 2019sxa
 2019skg
 2019stn
 2019tjx
 2019tov
 2019ssx
 2019sos
 2019sep
 2019swy
 2019tum
 2019thj
 2019sqj
 2019tat
 2019sop
 2019sho
 2019tta
 2019tnf
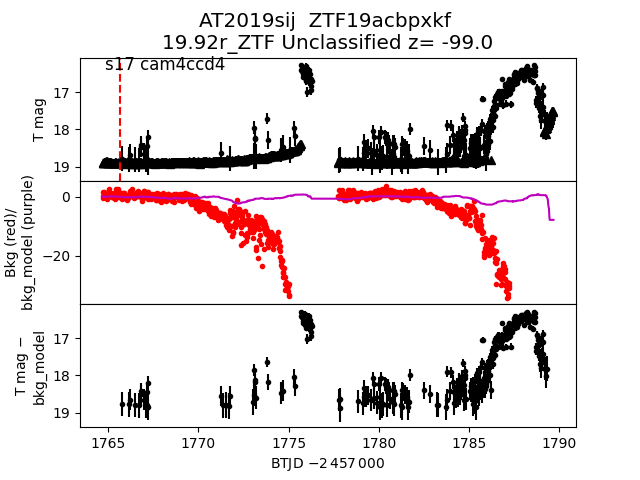
 2019sij
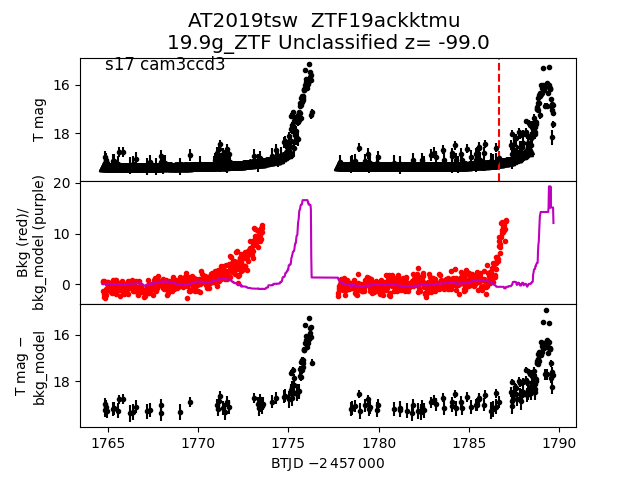
 2019tsw
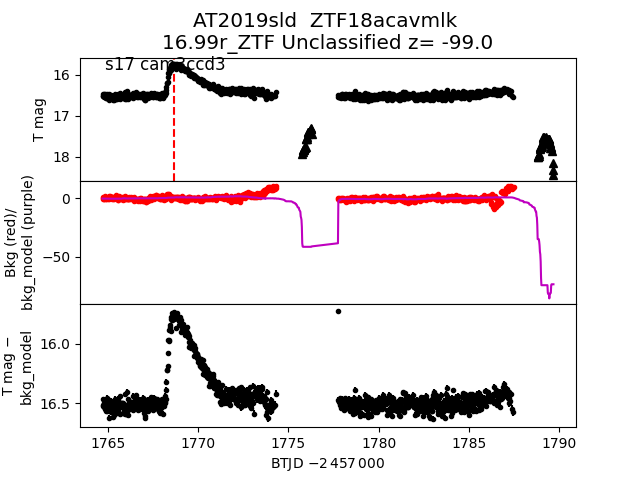
 2019sld
 2019str
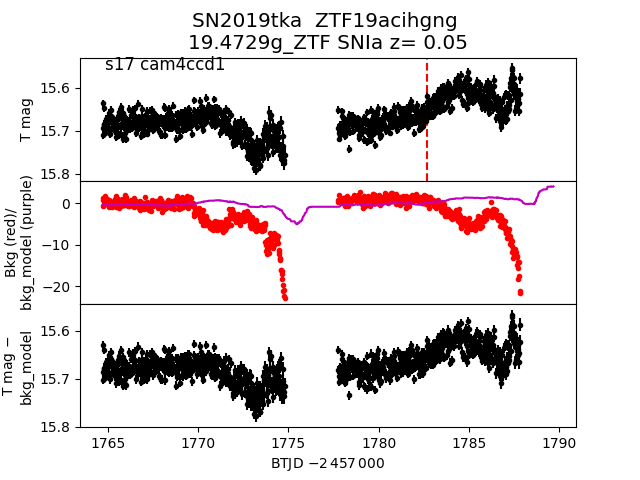
 2019tka
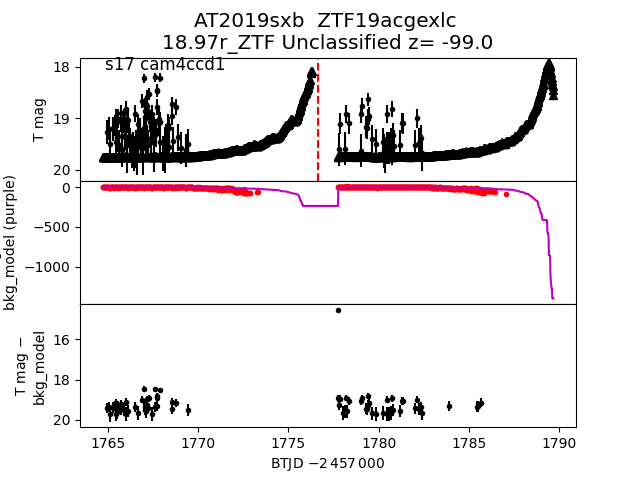
 2019sxb
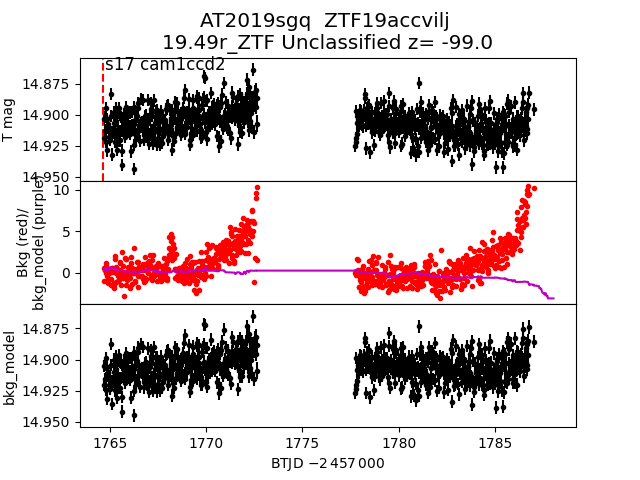
 2019sgq
 2019sqf
 2019tmw
 2019tsm
 2019tjw
 2019tdi
 2019sqo
 2019slh
 2019sta
 2019sxq
 2019tvu
 2019soj
 2019tlu
 2019uag
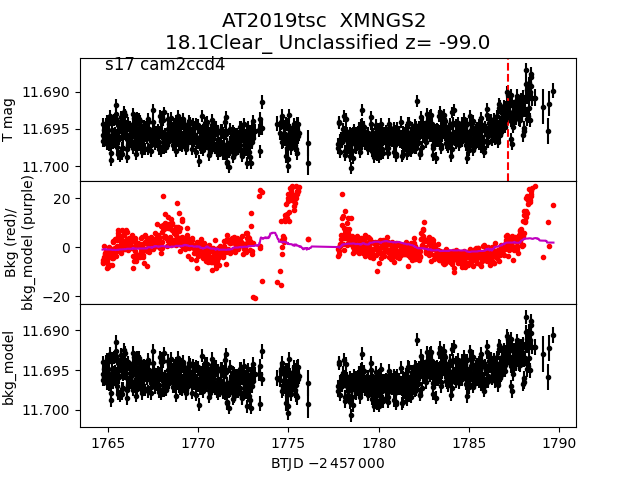
 2019tsc
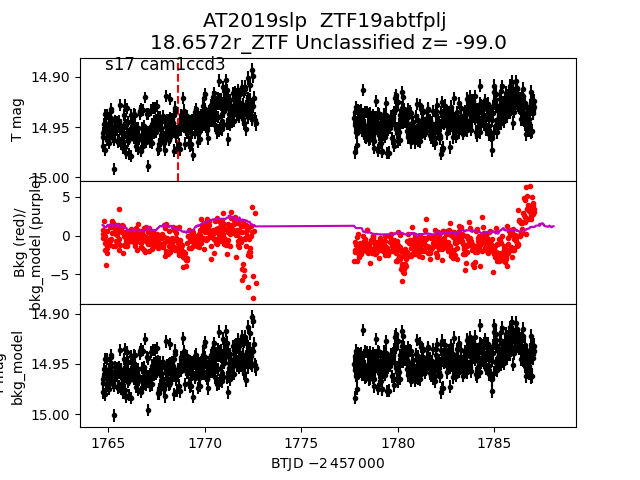
 2019slp
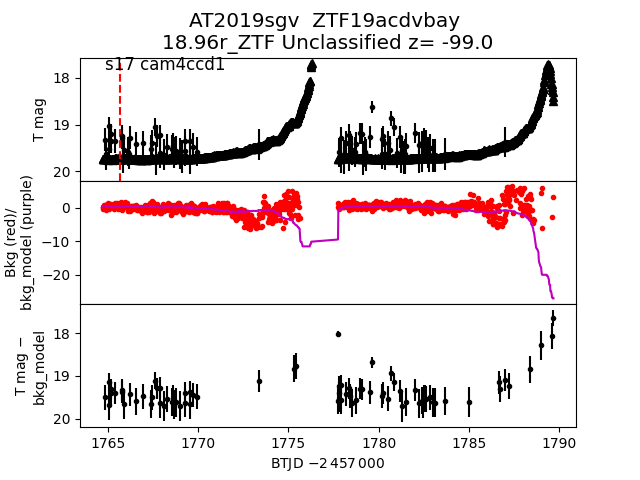
 2019sgv
 2019syl
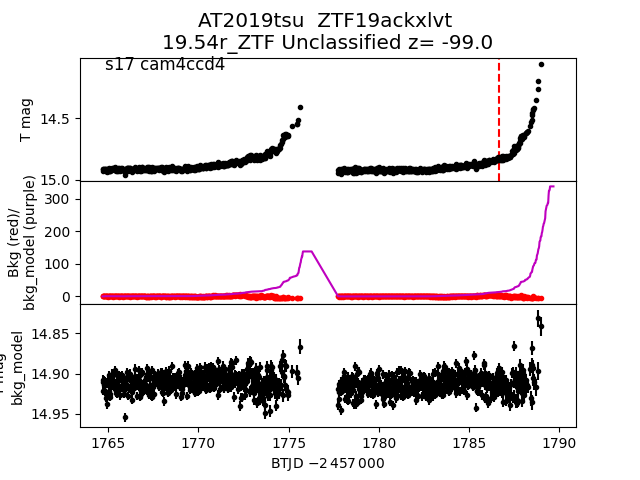
 2019tsu
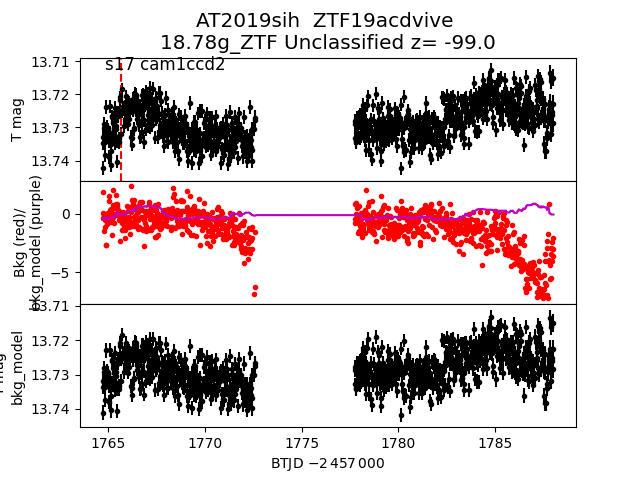
 2019sih
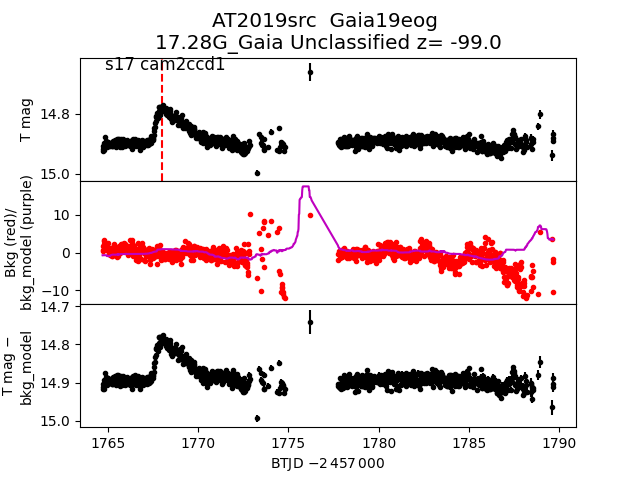
 2019src
 2019snw
 2019stj
 2019tbg
 2019sxe
 2019tae
 2019tju
 2019tlp
 2019sqm
 2019slj
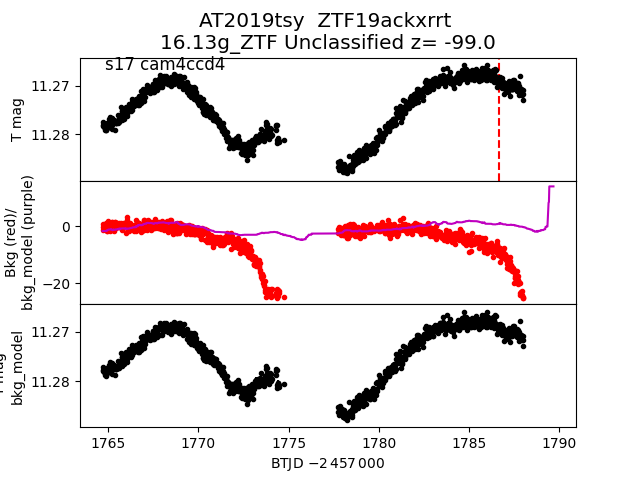
 2019tsy
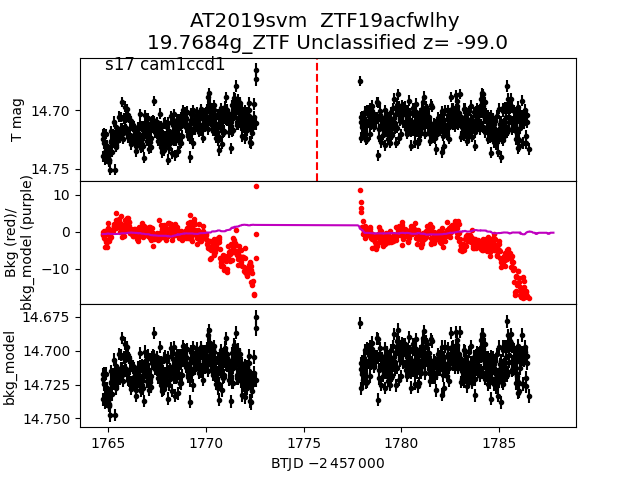
 2019svm
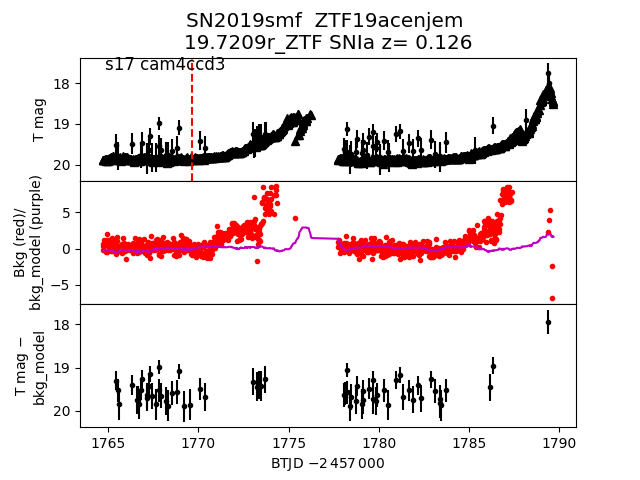
 2019smf
 2019tlo
 2019soh
 2019sme
 2019sqn
 2019tsz
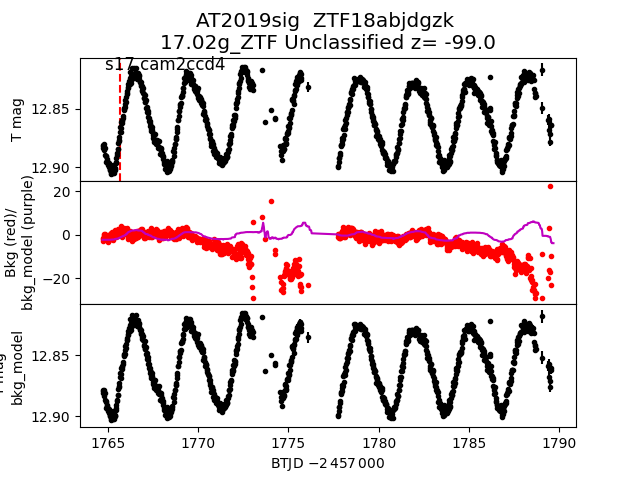
 2019sig
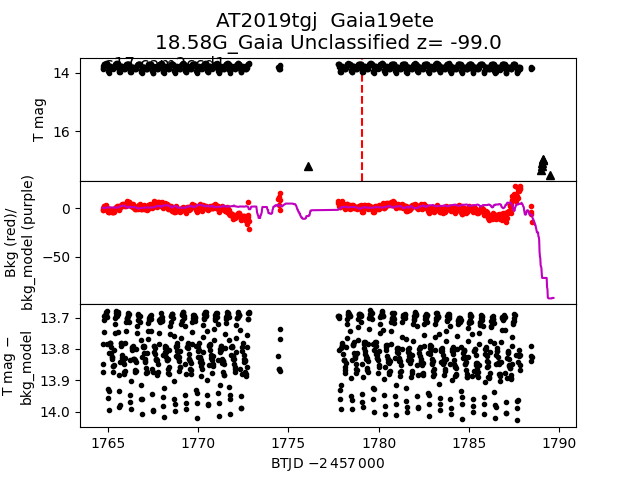
 2019tgj
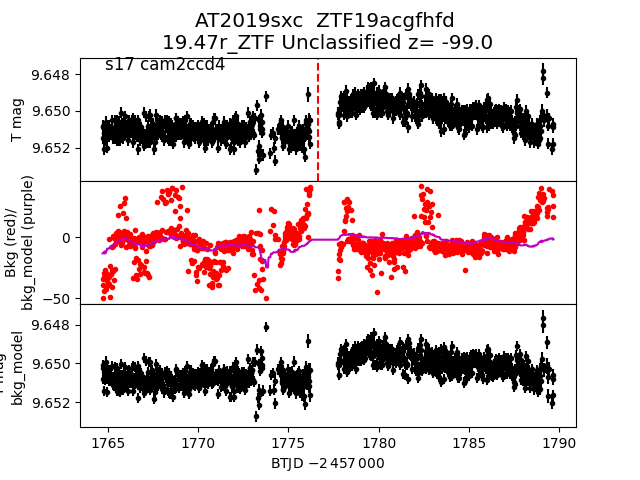
 2019sxc
 2019sts
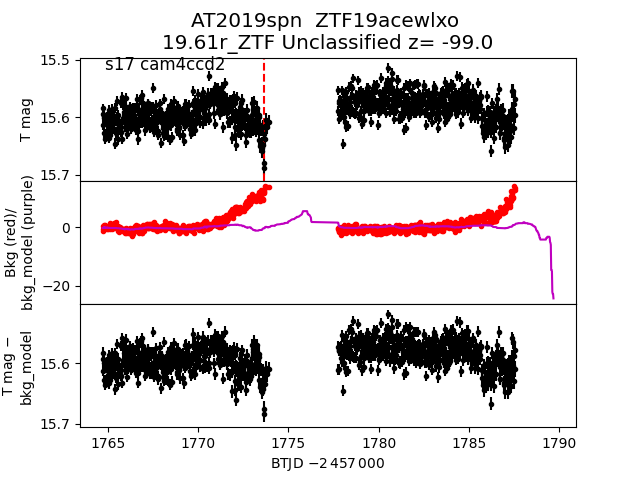
 2019spn
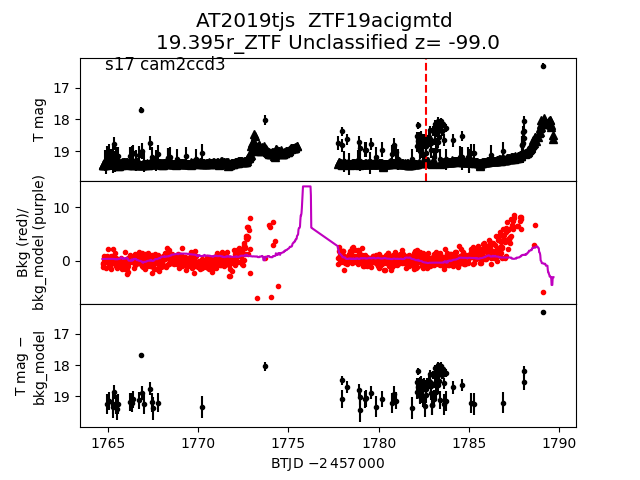
 2019tjs
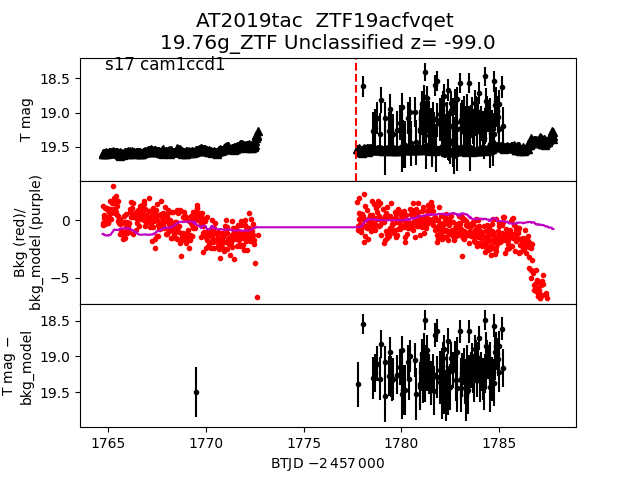
 2019tac
 2019sgu
 2019tjl
 2019tsv
 2019tjz
 2019tng
 2019sse
 2019trl
 2019swx
 2019tfu
 2019sqk