all transients in sector16 (73 total)
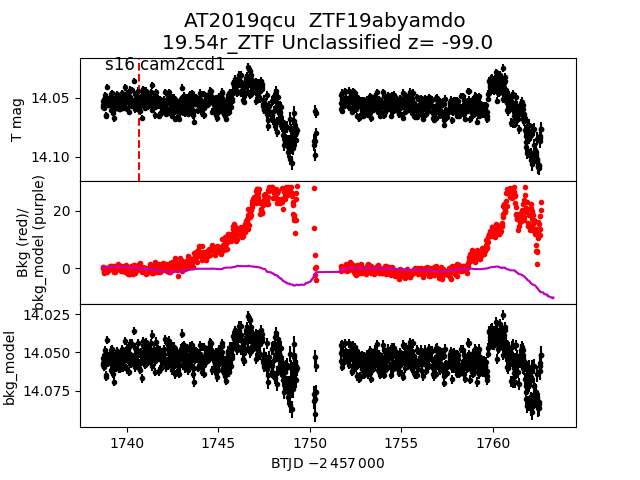
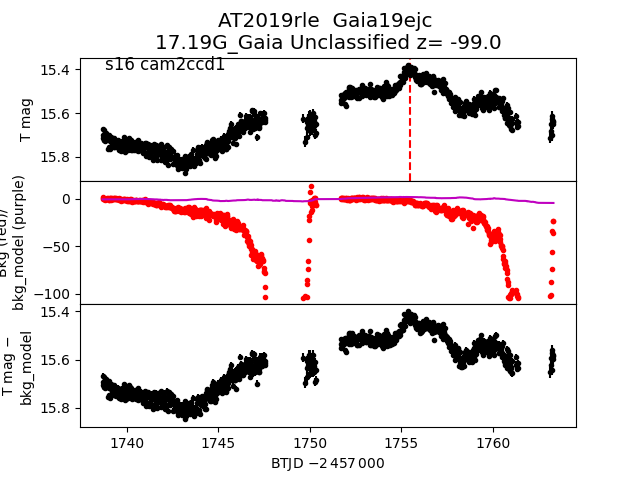
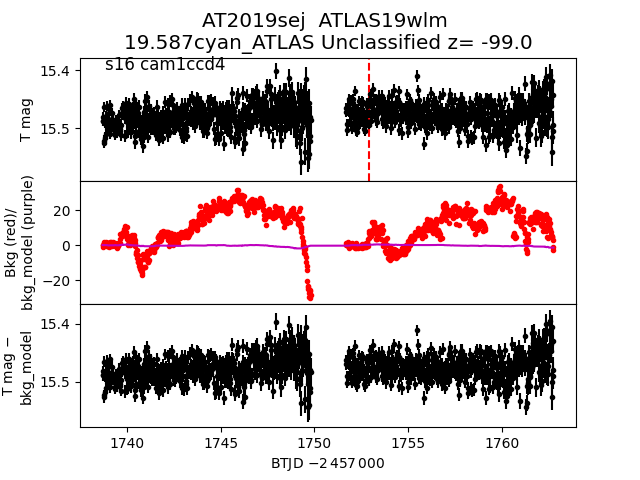
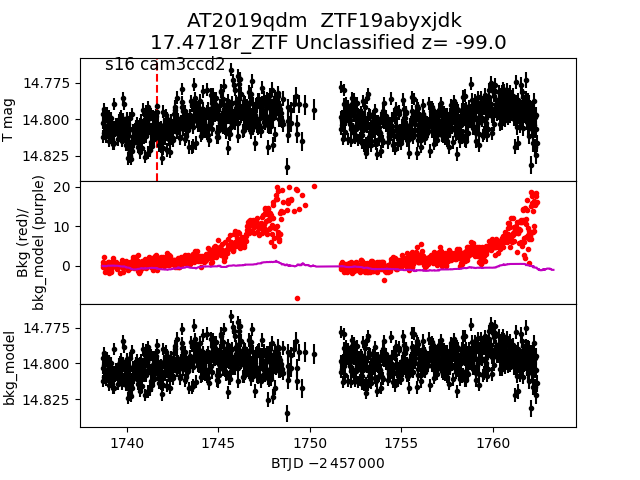
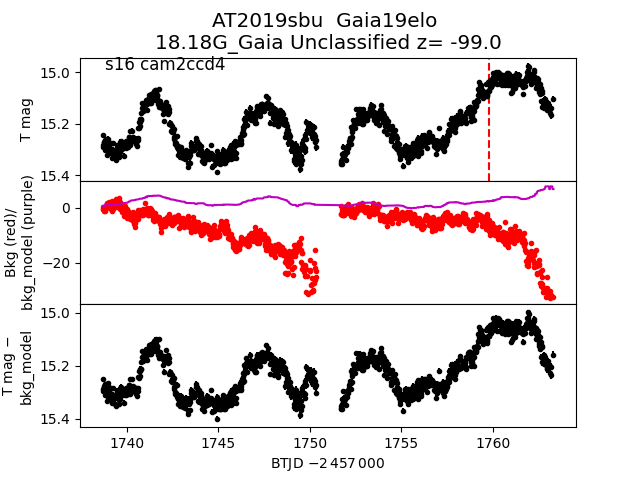
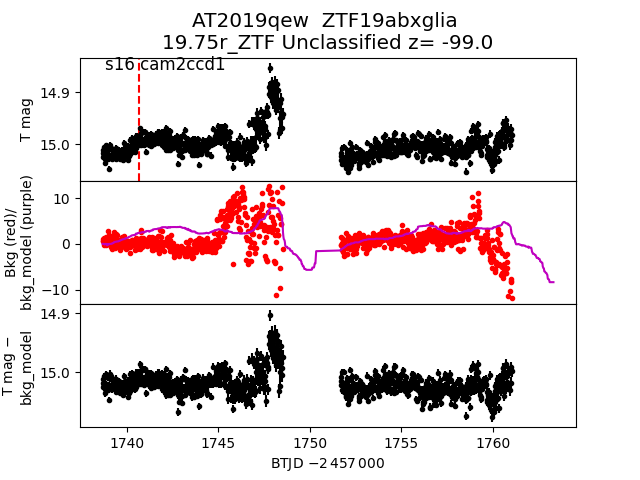
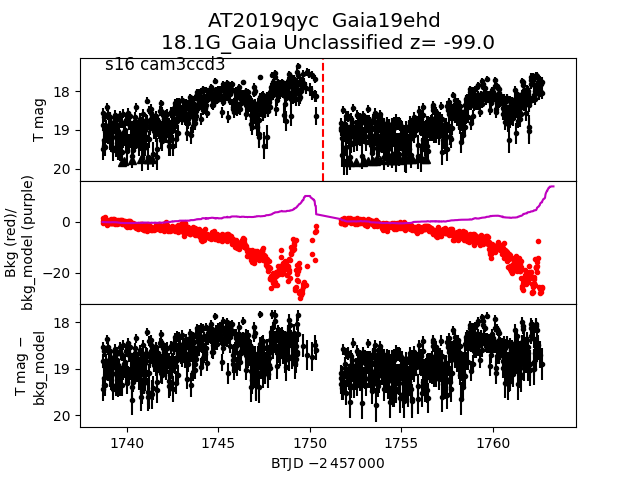
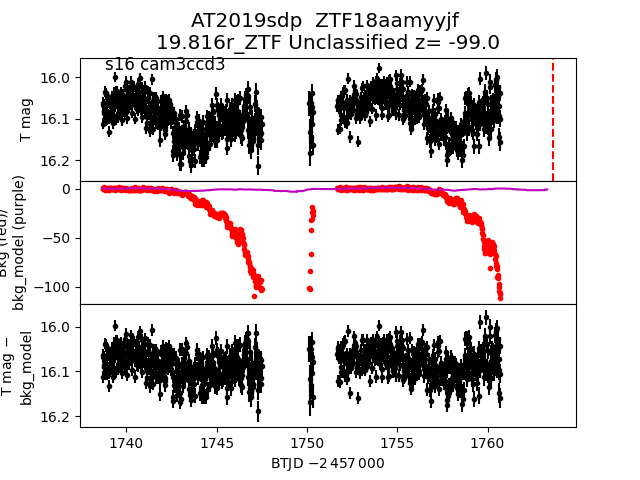
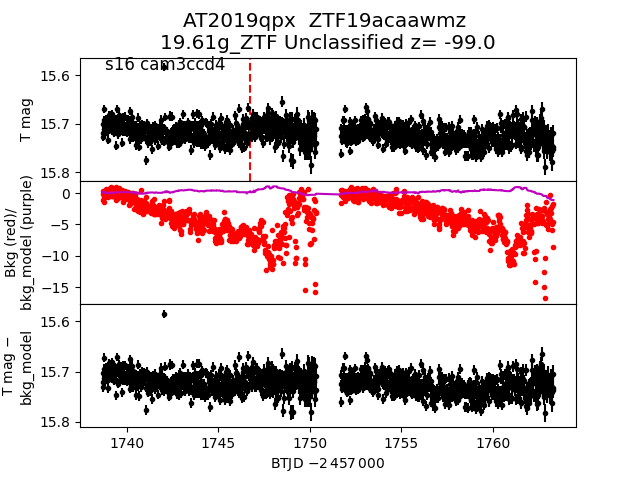
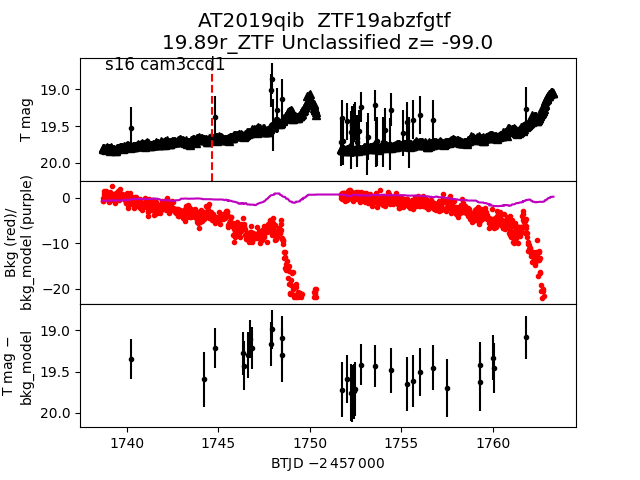
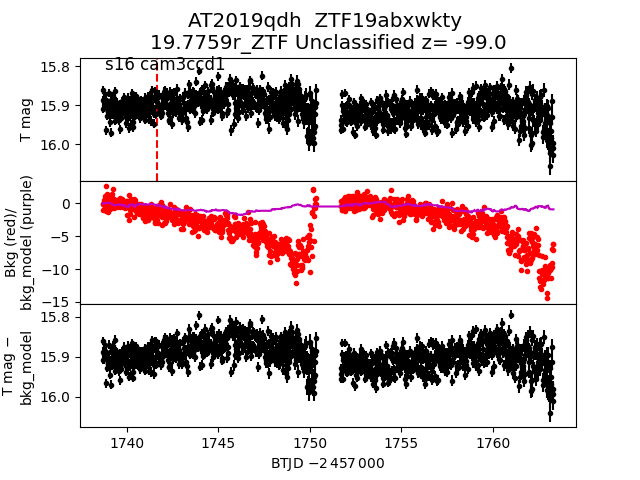
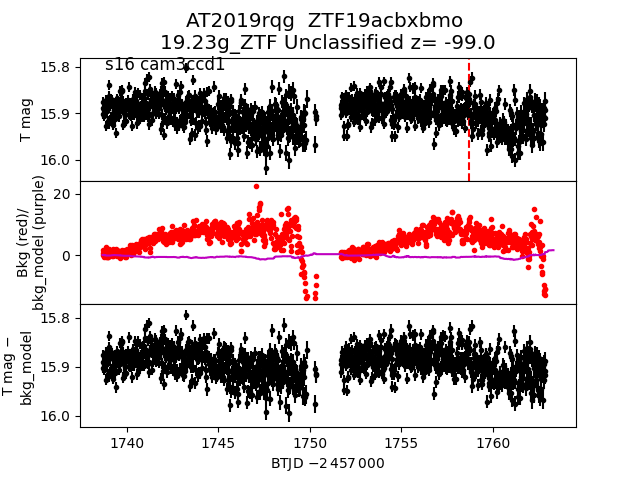
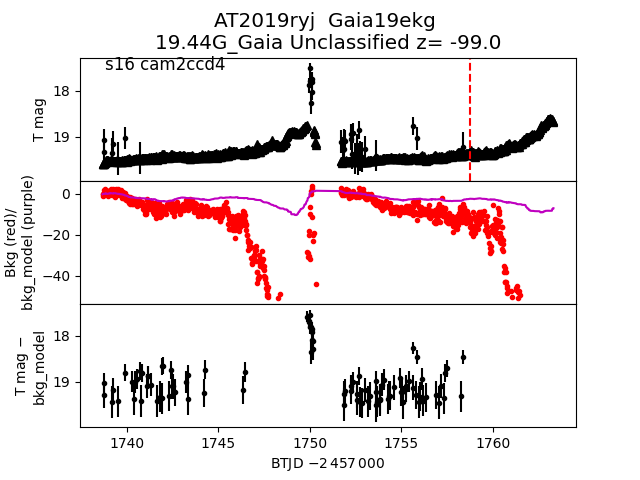
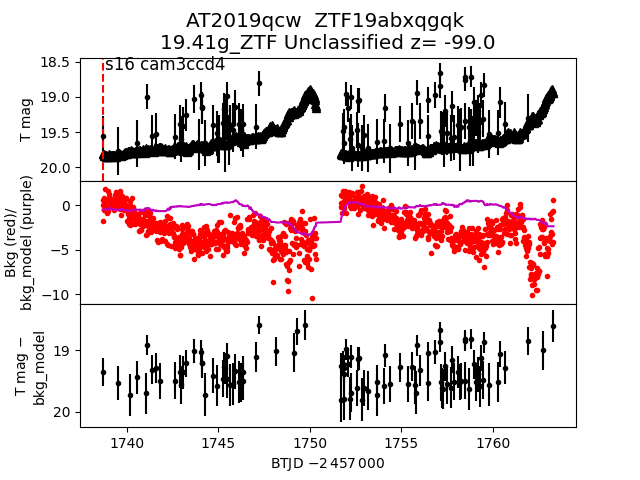
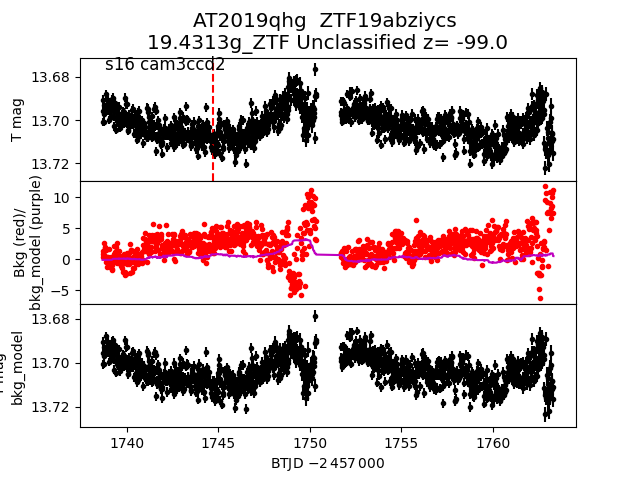
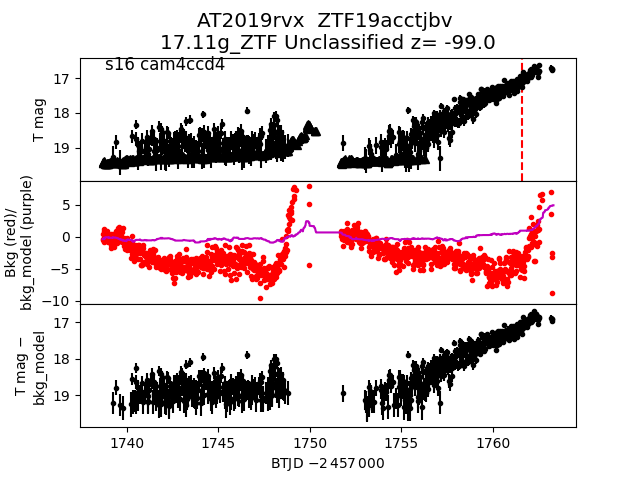
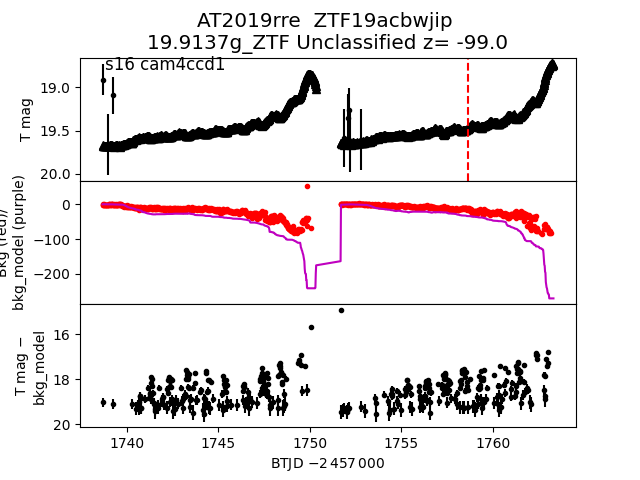
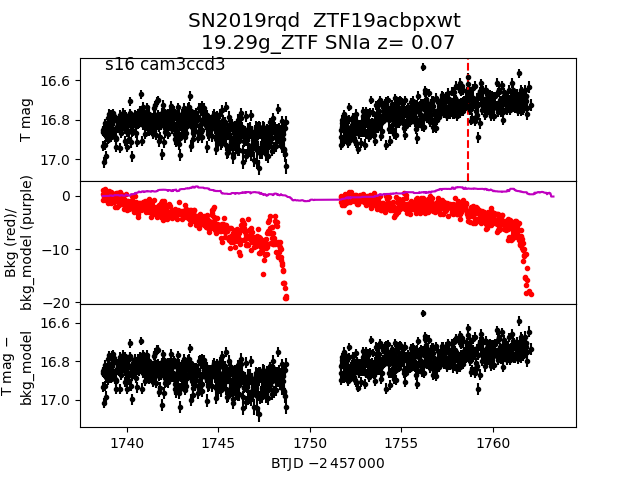
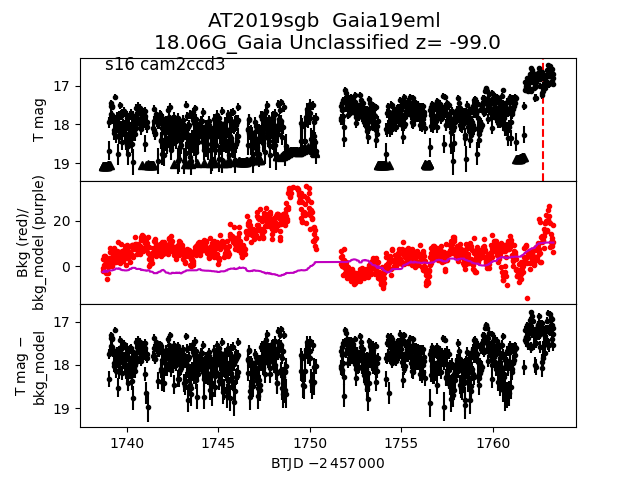
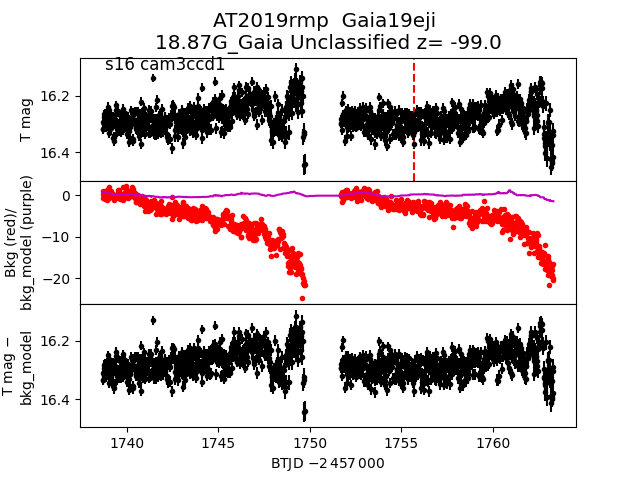
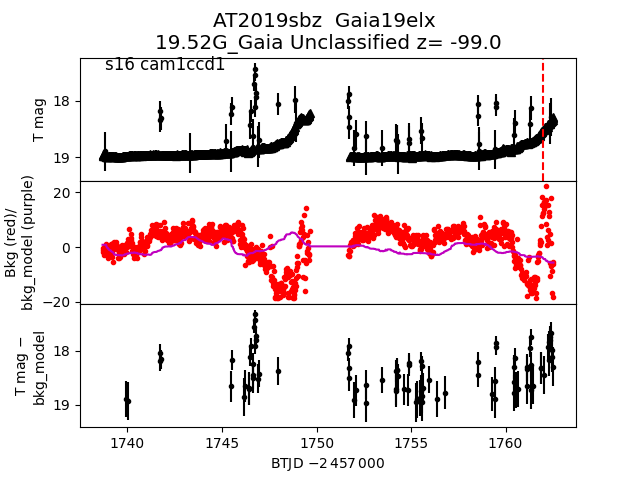
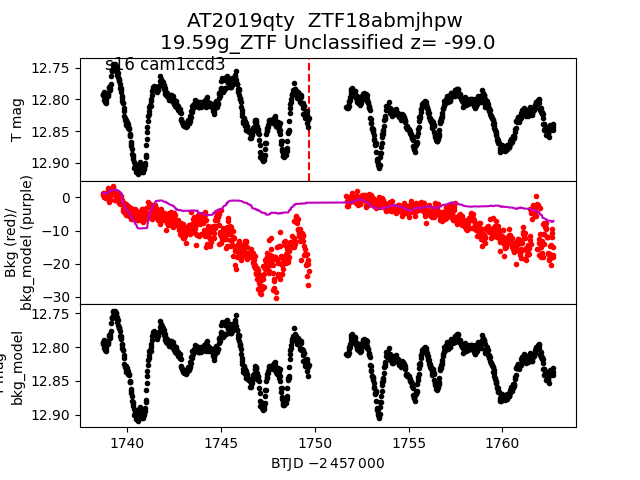
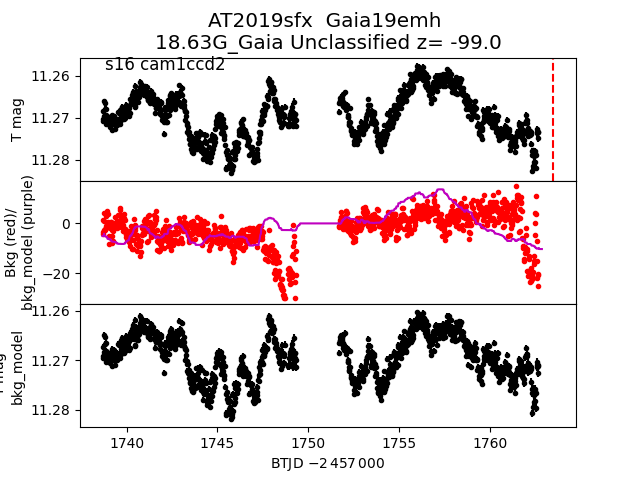
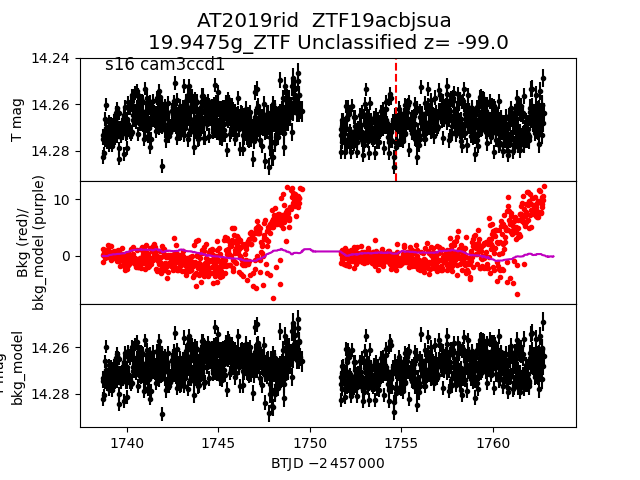
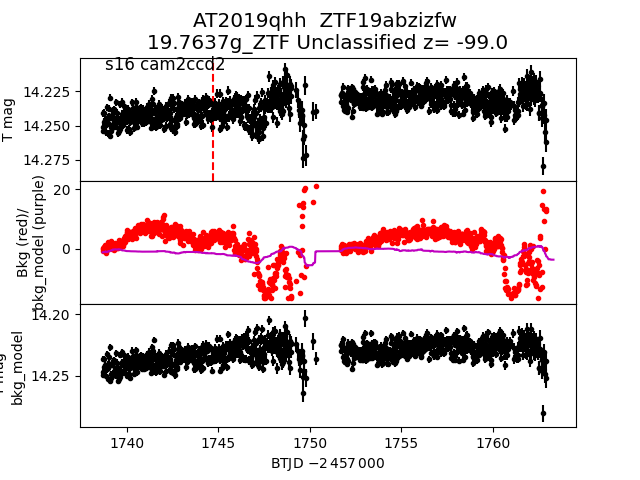
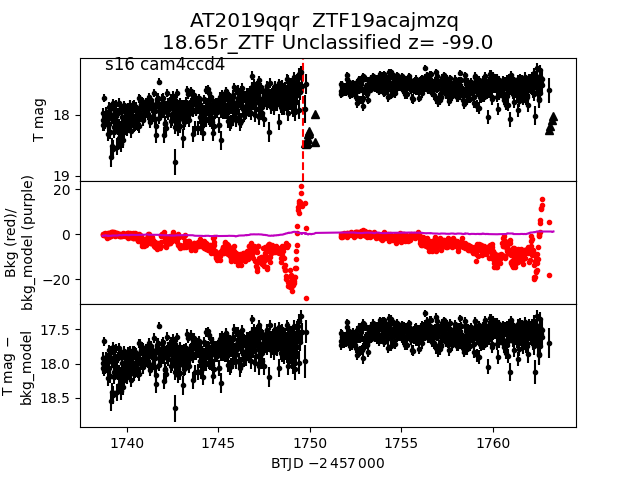
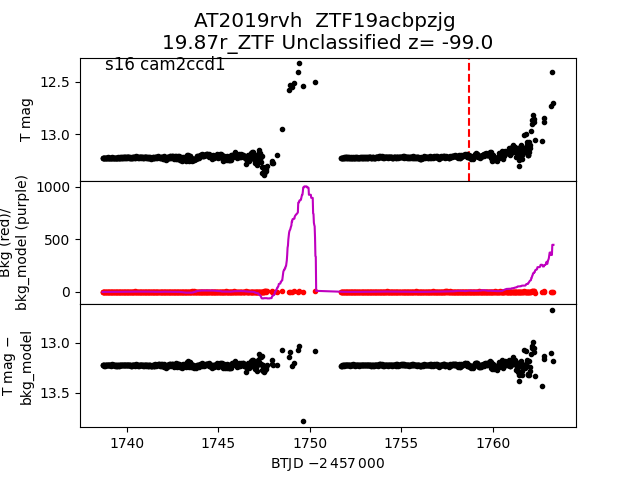
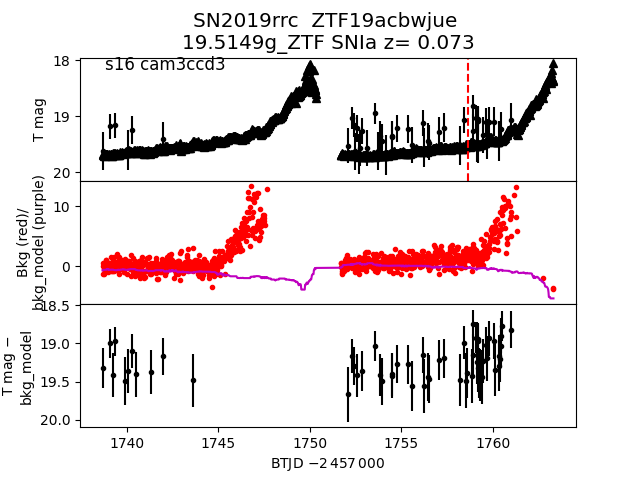
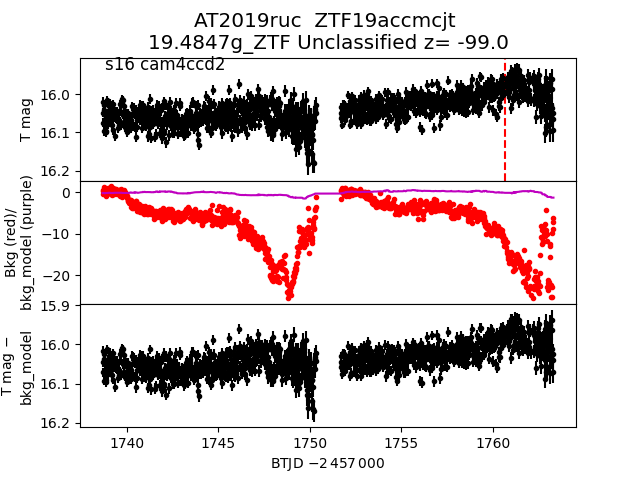
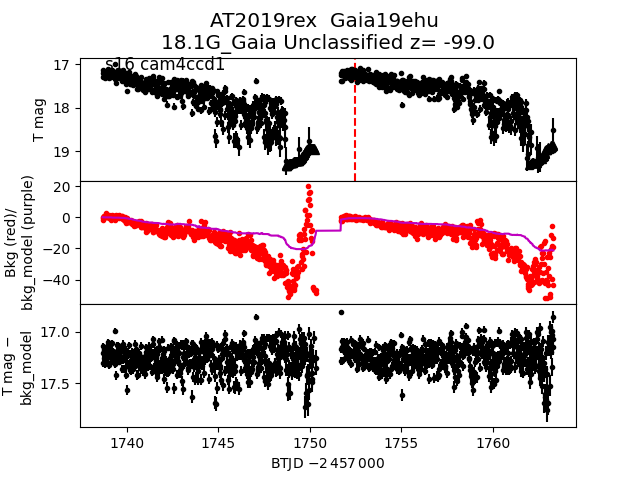
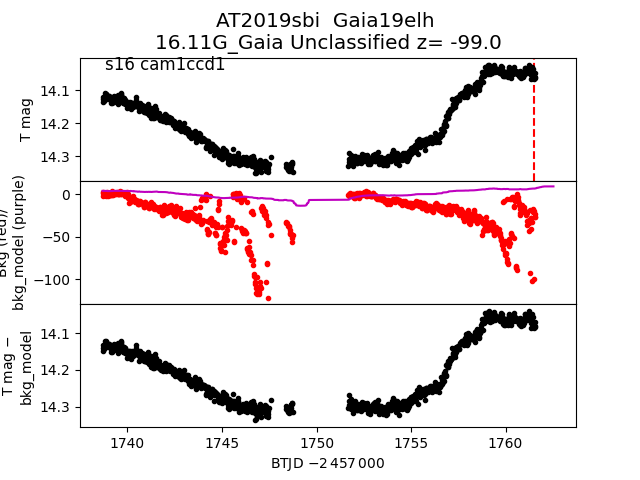
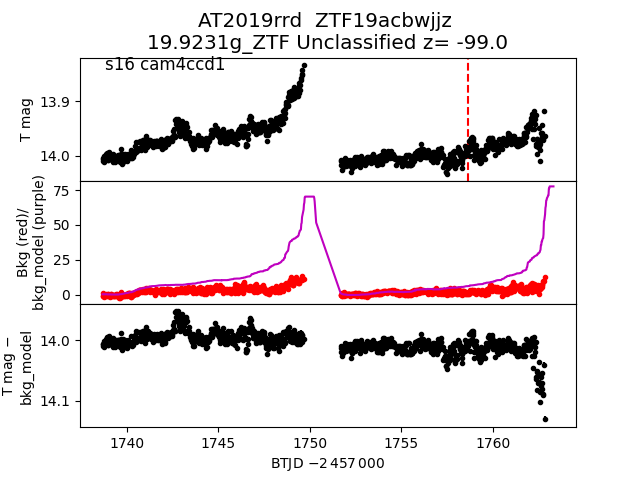
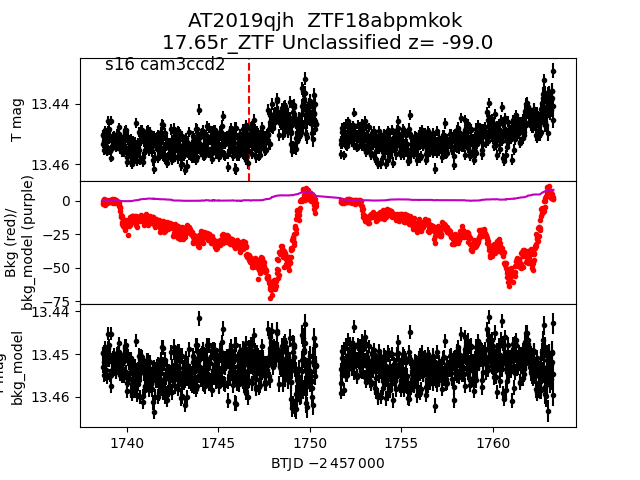
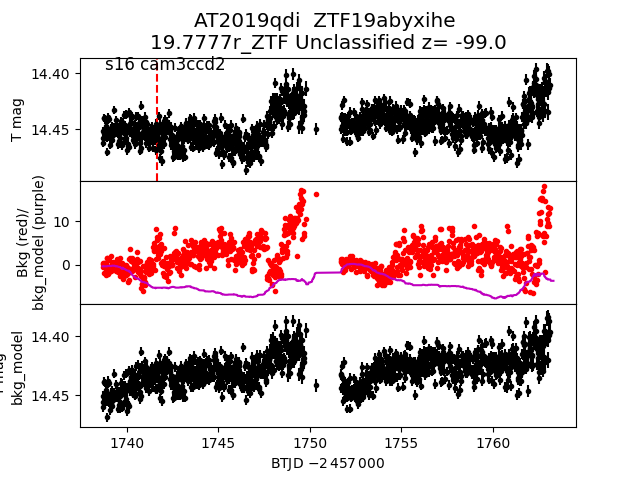
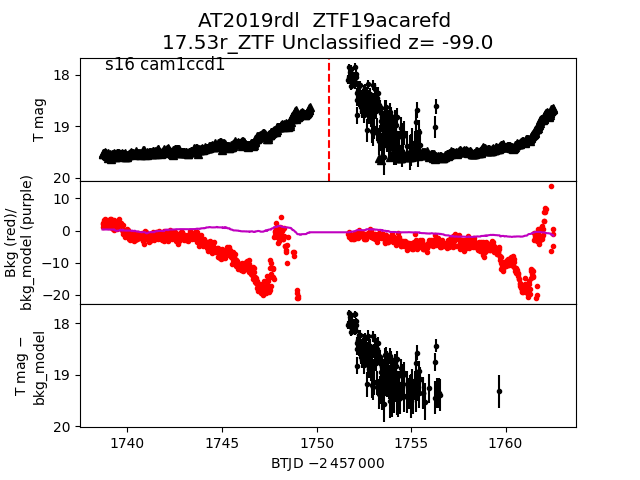
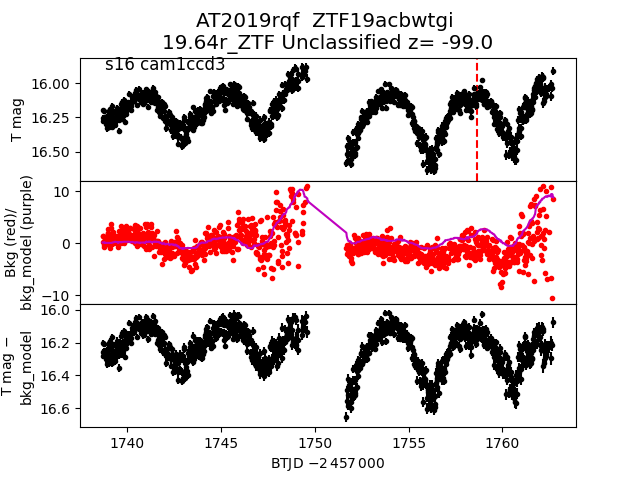
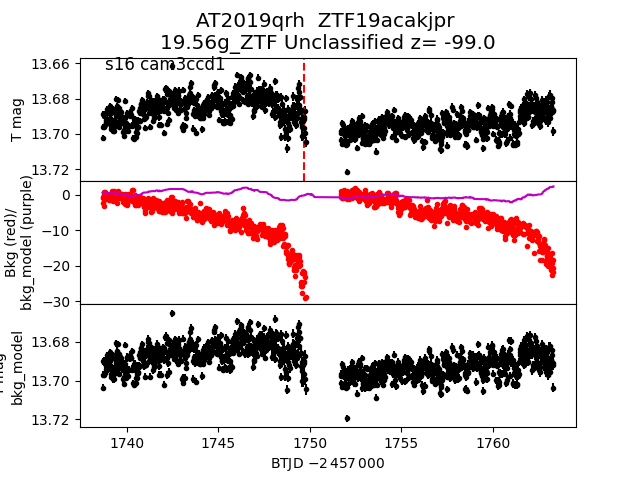
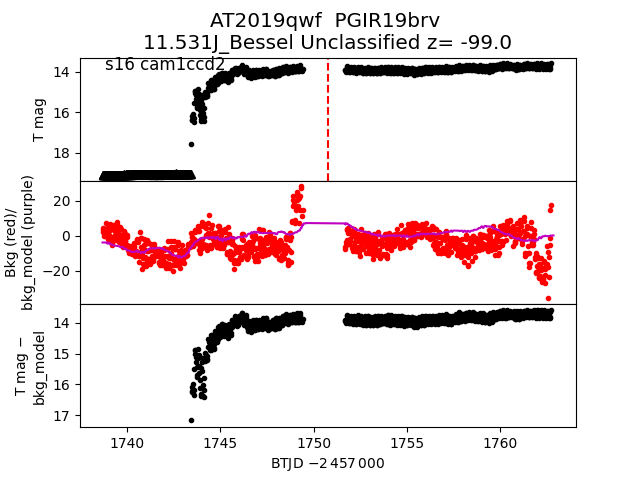
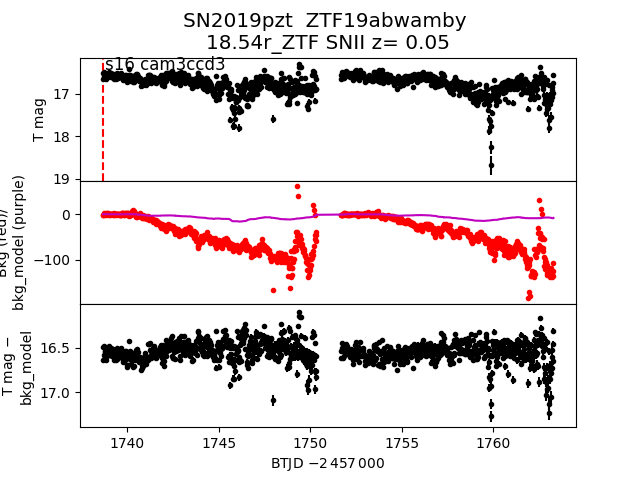
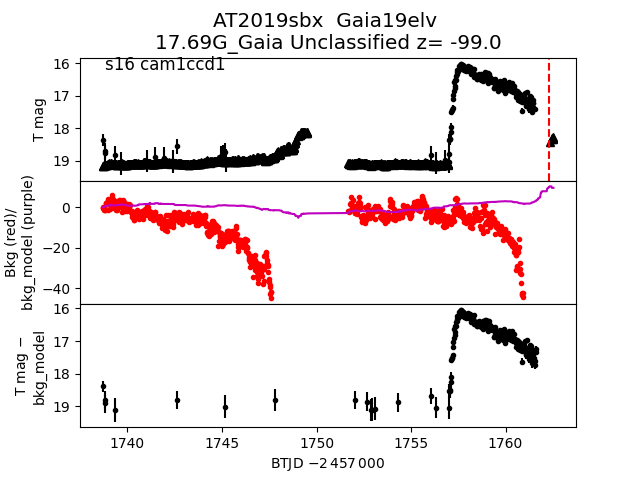
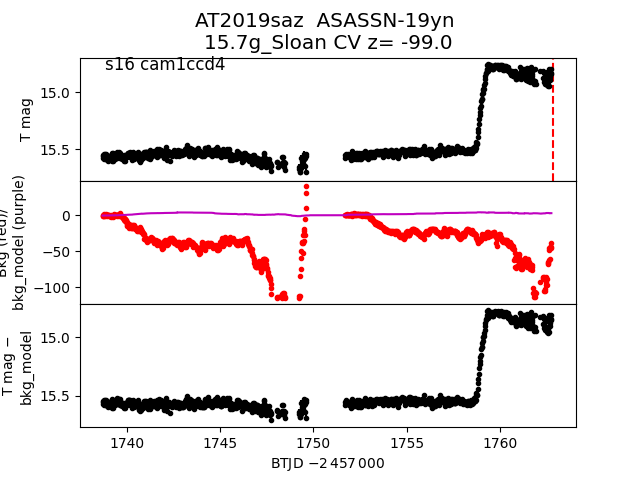
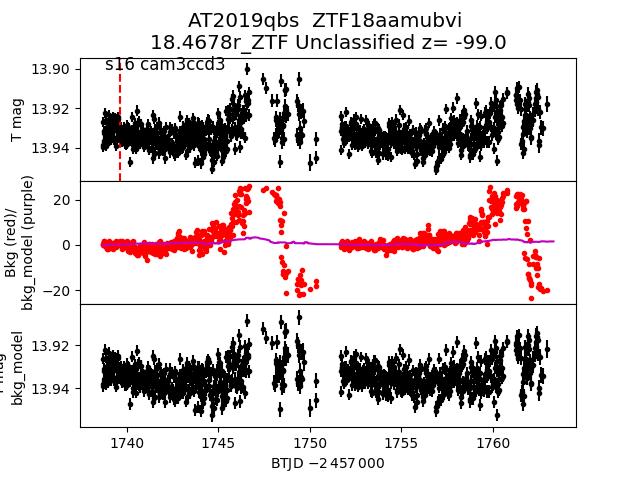
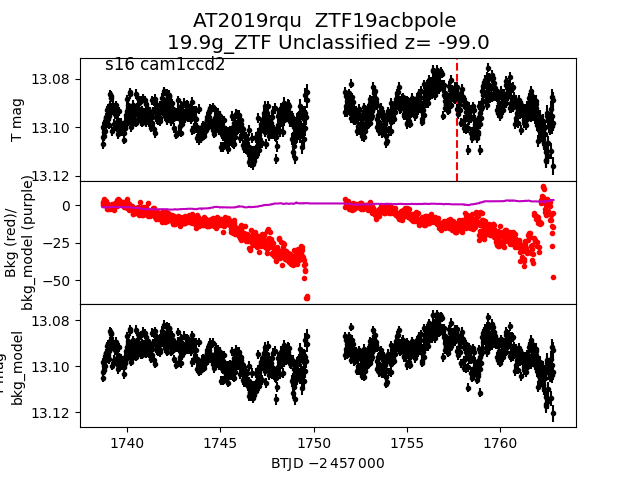
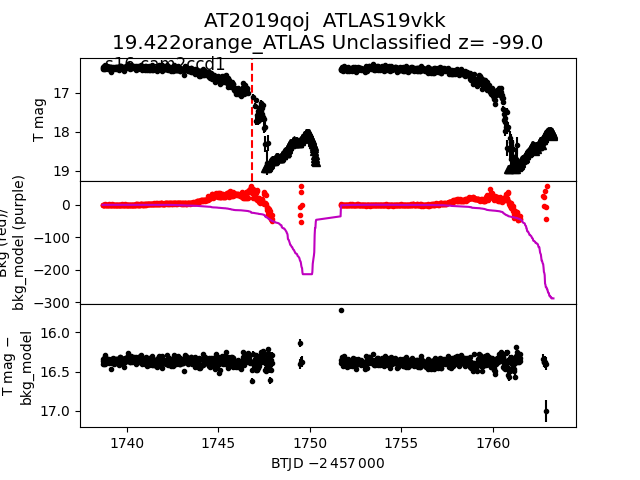
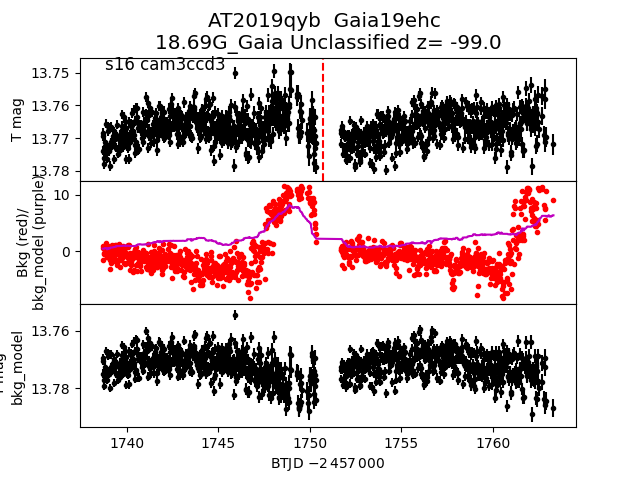
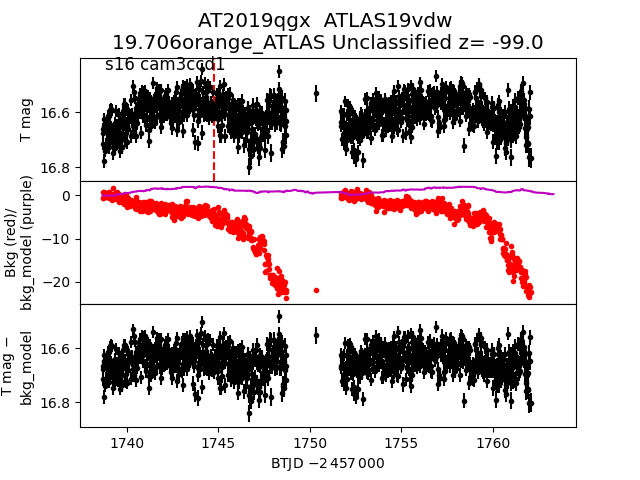
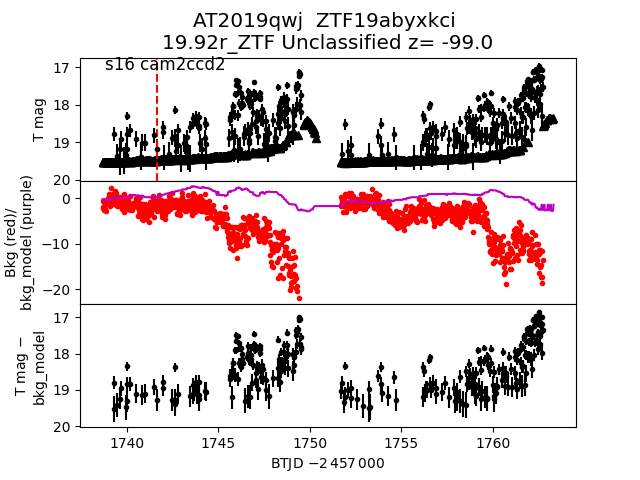
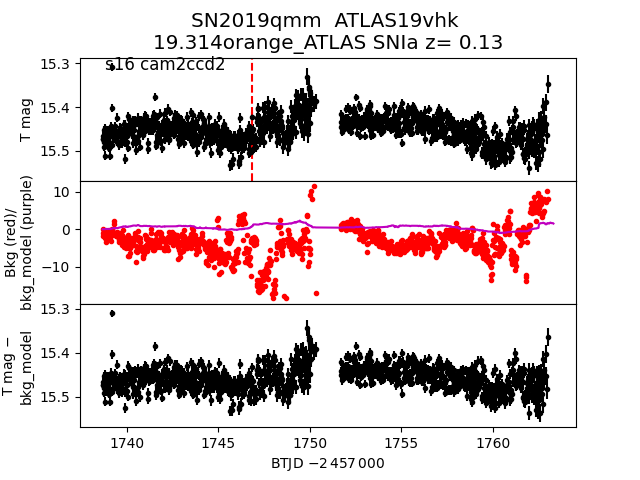
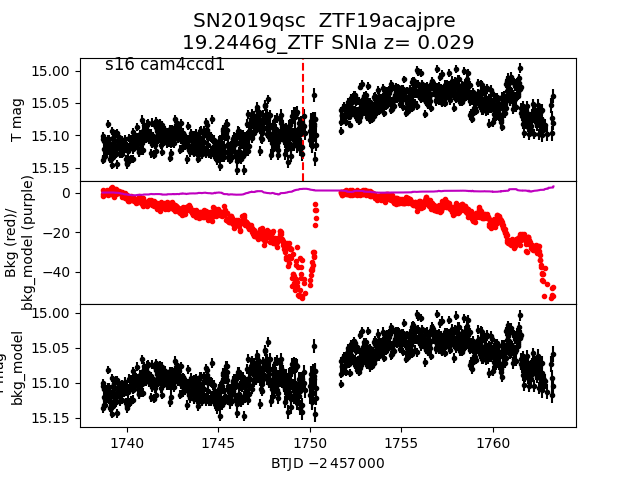
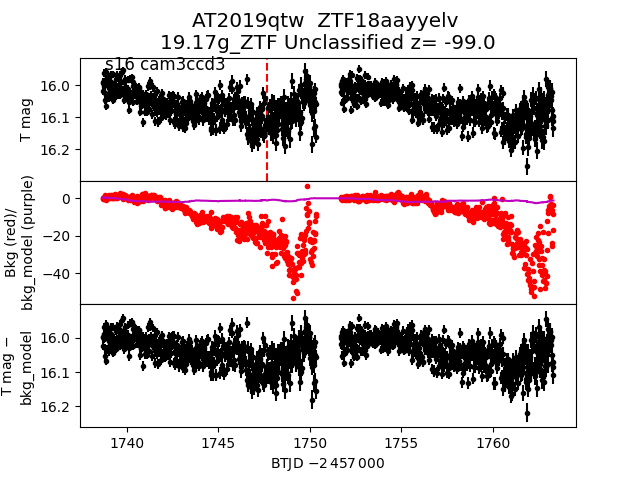
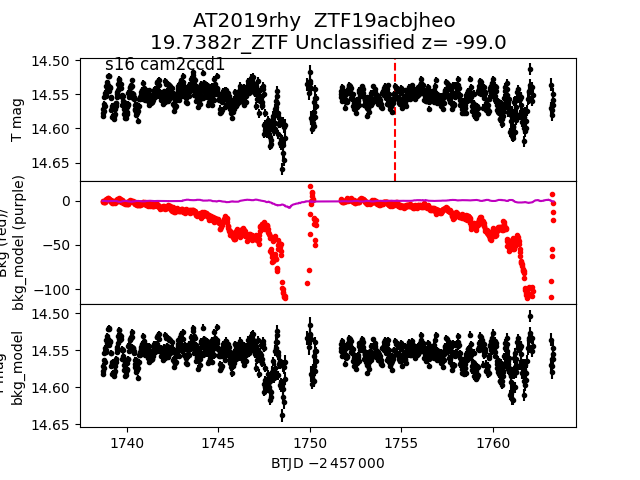
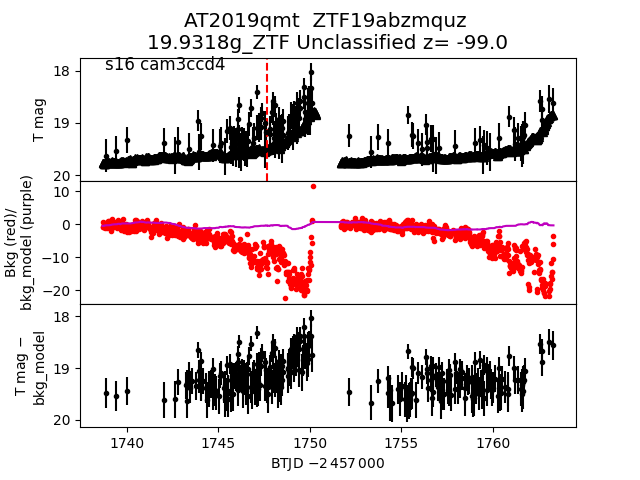
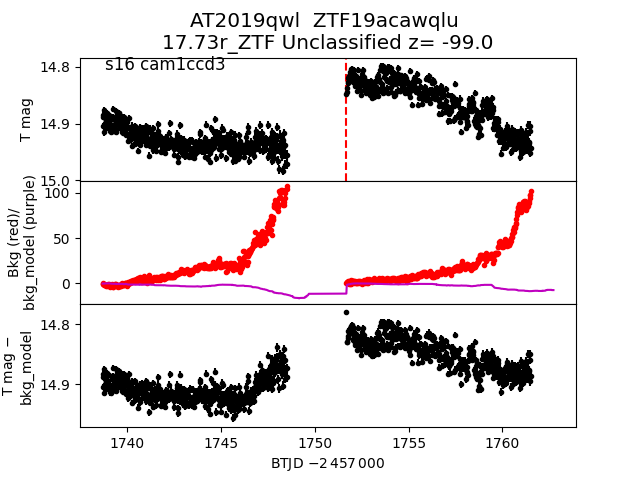
Each figure has three panels. The top panel shows the transient light curve, the middle panel shows the local background (estimated in an annulus), and the bottom panel shows a "background-model corrected" light curve. Details about the background model are in the README.
The vertical red line marks the time of discovery reported to TNS. Other useful metadata from TNS is in the figure title.
Note that the top and bottom panel are in magnitudes, while the middle panel is in differential flux units. The magnitudes are calibrated to the flux in the reference image used for image subtraction. Thus, flux from the host galaxy is included in these magnitudes.
3-sigma upper limits are plotted as triangles with no errorbars. A typical limiting magnitude is 19.6 in 30 minutes or 18.4 in 200 seconds (for low backgrounds).
The links allow you to download the light curve data as a text file.
More details in the README.
2019rle
 2019sej
 2019qdm
 2019sbu
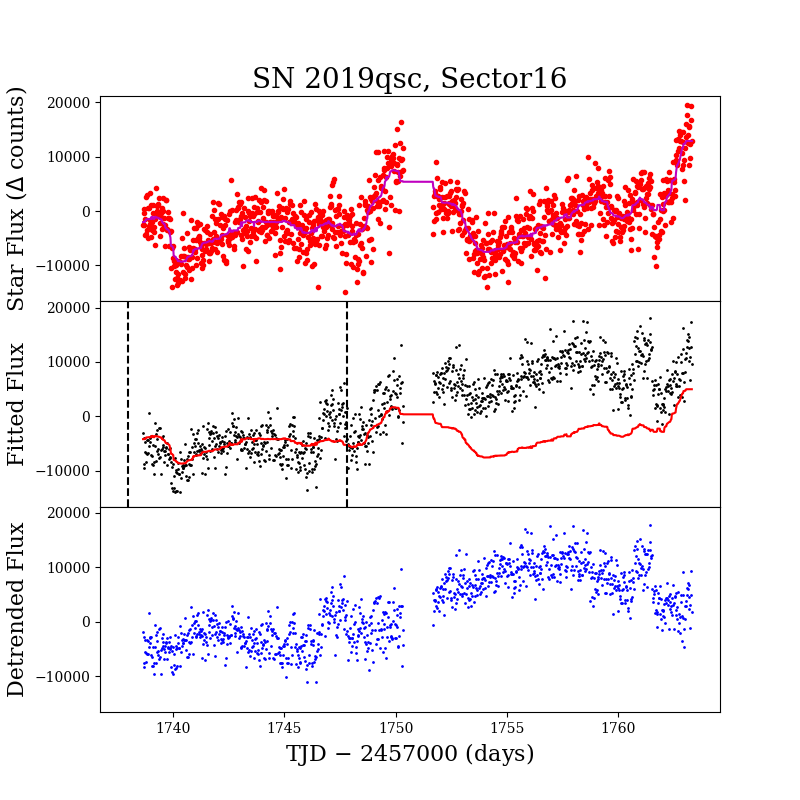
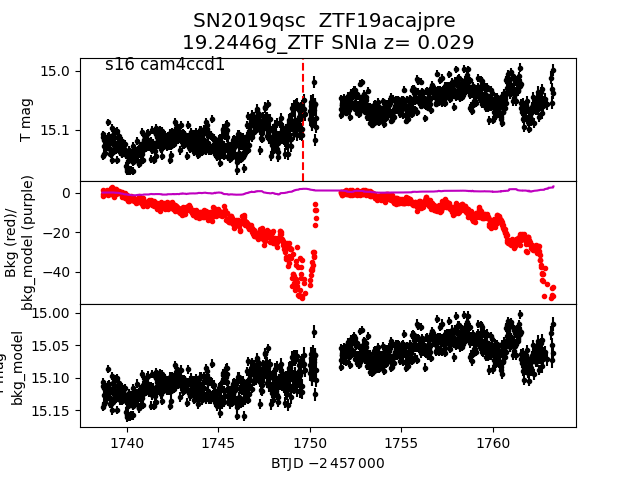
 2019qsc
 2019qew
 2019qyc
 2019sdp
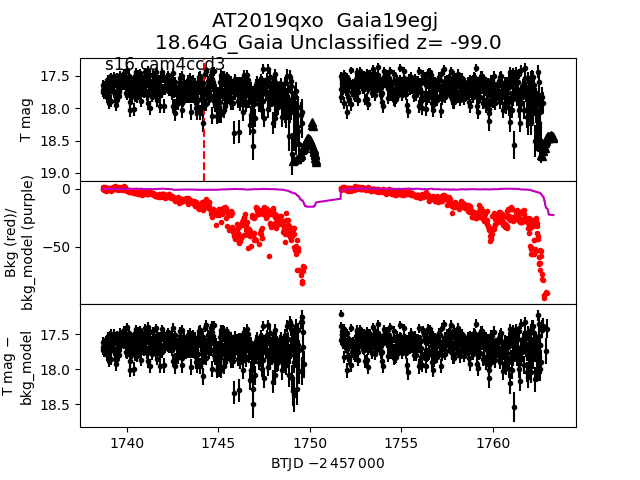
 2019qxo
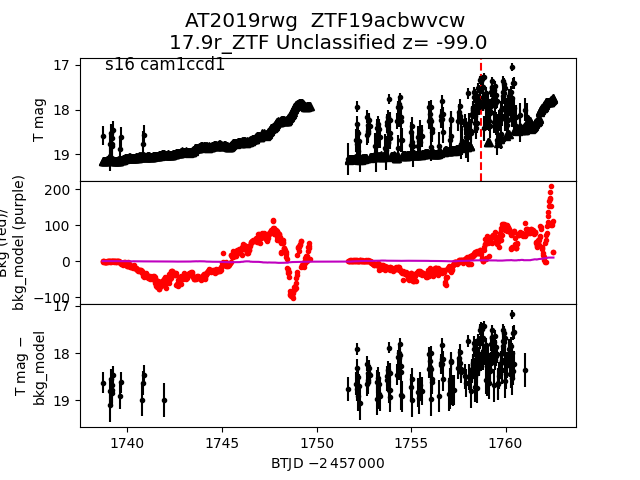
 2019rwg
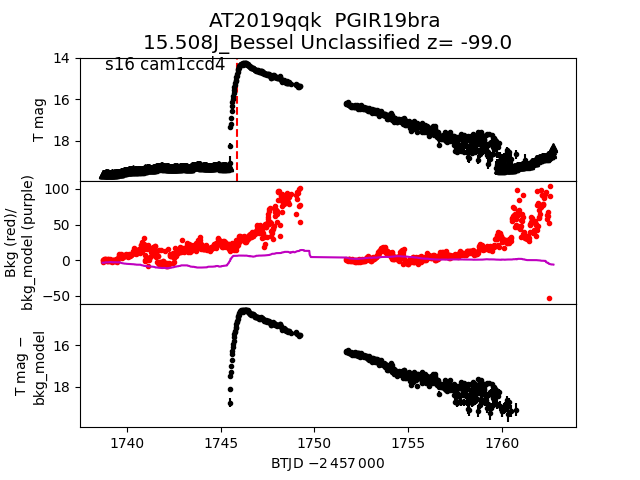
 2019qqk
 2019qpx
 2019qib
 2019qdh
 2019rqg
 2019ryj
 2019qcw
 2019qhg
 2019rvx
 2019rre
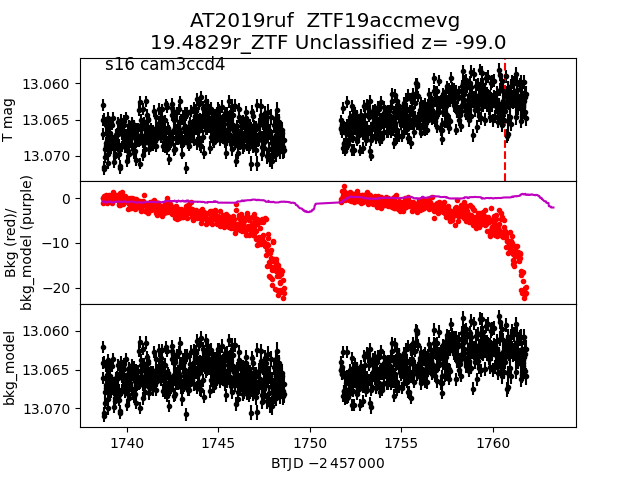
 2019ruf
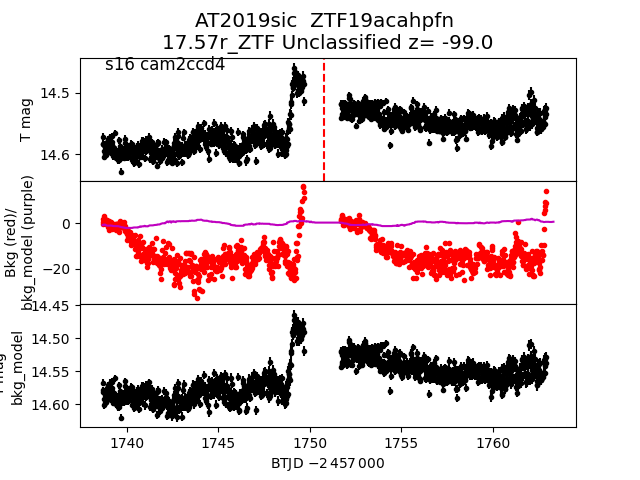
 2019sic
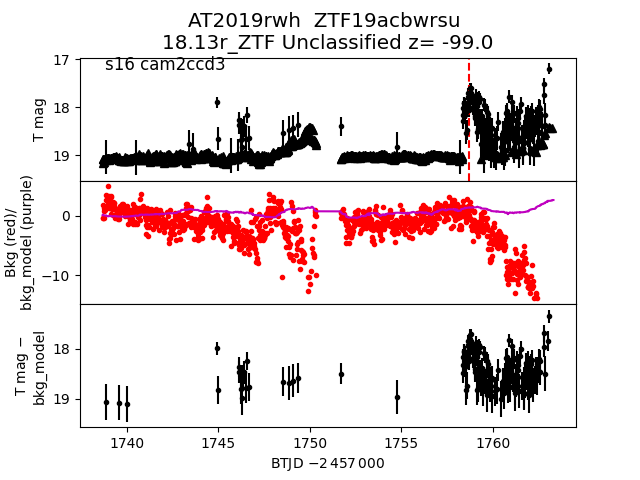
 2019rwh
 2019rqd
 2019sgb
 2019rmp
 2019sbz
 2019qty
 2019sfx
 2019rid
 2019qhh
 2019qqr
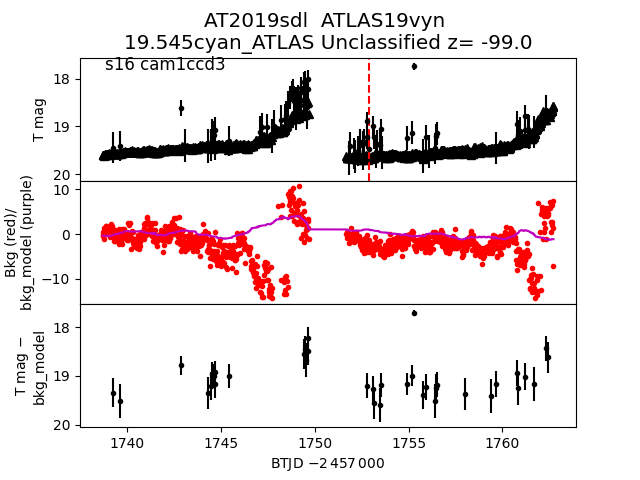
 2019sdl
 2019qmm_detrended
 2019qsc
 2019rvh
 2019rrc
 2019ruc
 2019rex
 2019sbi
 2019rrd
 2019qjh
 2019qdi
 2019rdl
 2019rqf
 2019qrh
 2019qwf
 2019pzt
 2019sbx
 2019saz
 2019qbs
 2019qpc
 2019rqu
 2019qoj
 2019qyb
 2019qgx
 2019qwj
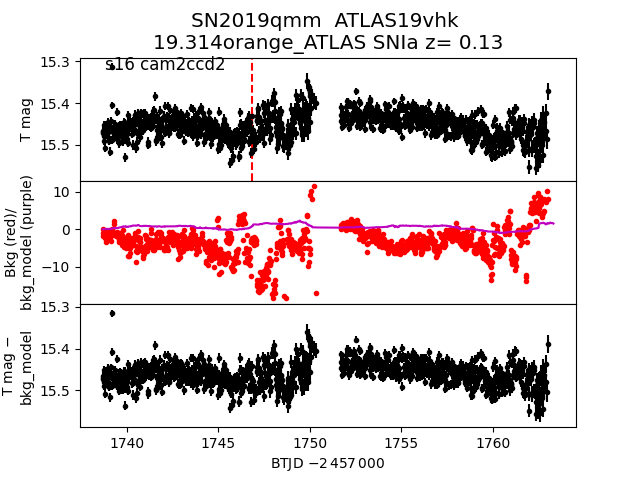
 2019qmm
 2019qsc_detrended
 2019qtw
 2019rhy
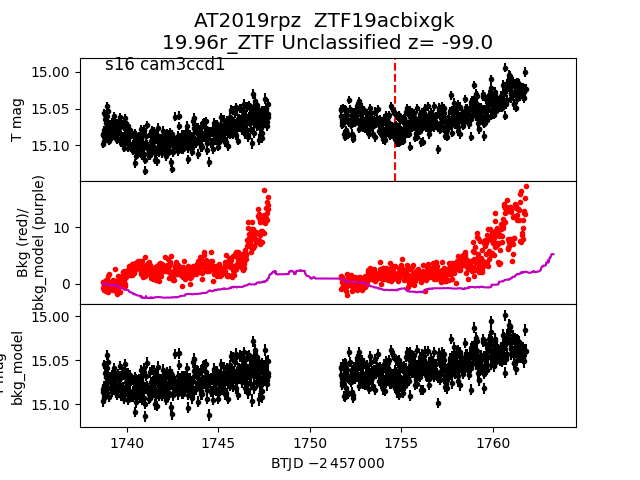
 2019rpz
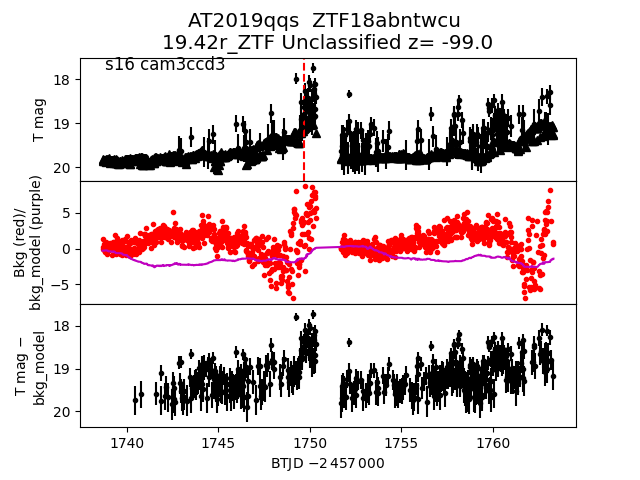
 2019qqs
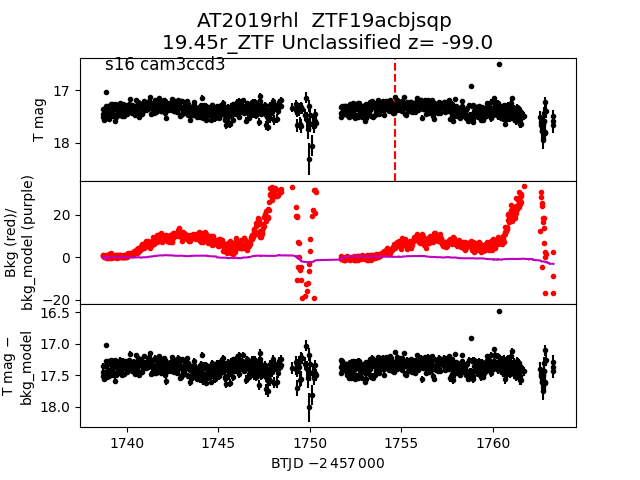
 2019rhl
 2019qmt
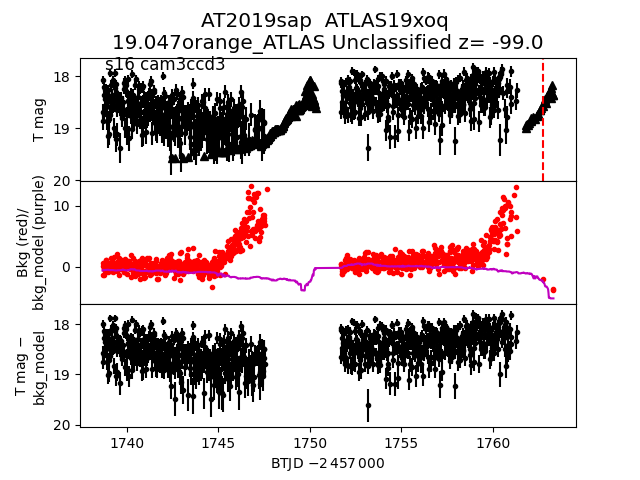
 2019sap
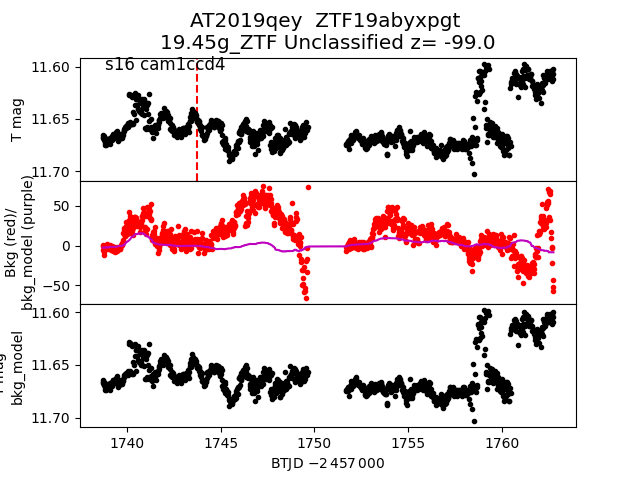
 2019qey
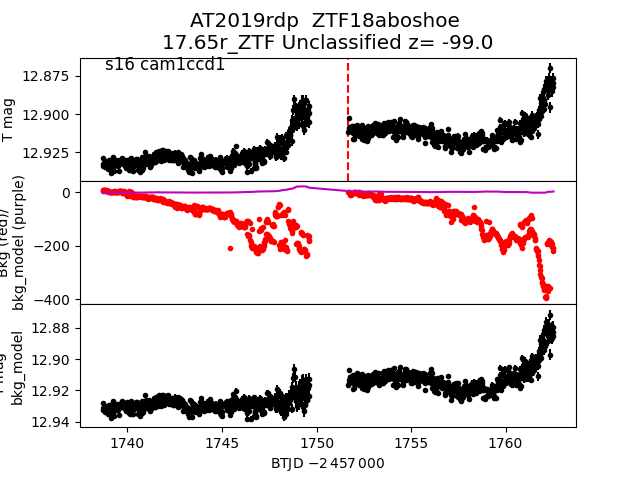
 2019rdp
 2019qwl
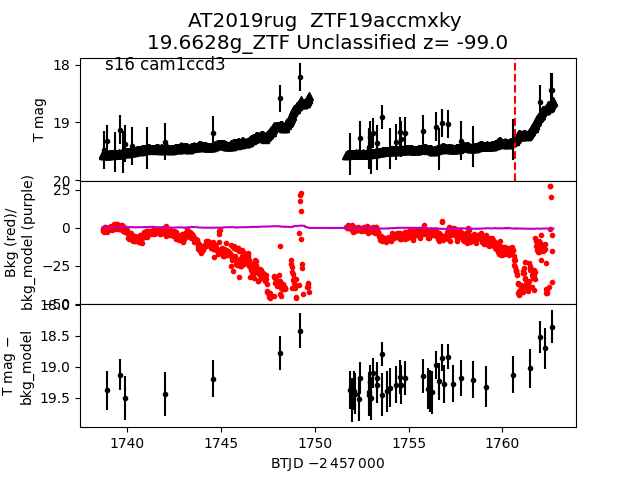
 2019rug
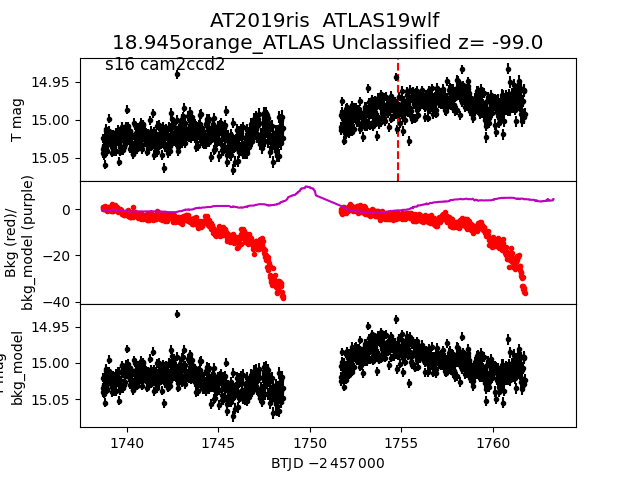
 2019ris
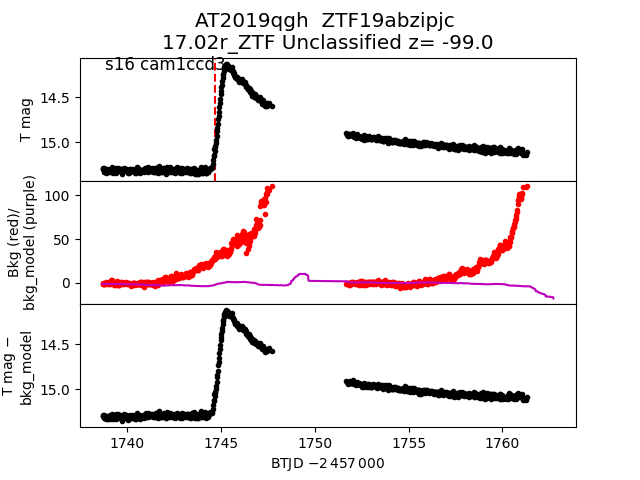
 2019qgh
 2019qcu