all transients in sector15 (90 total)
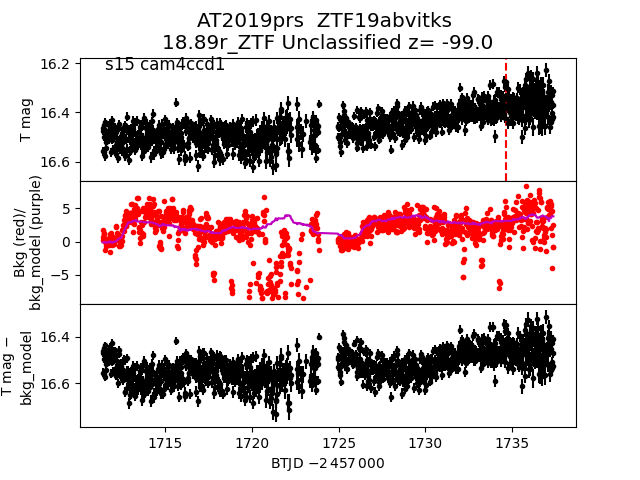
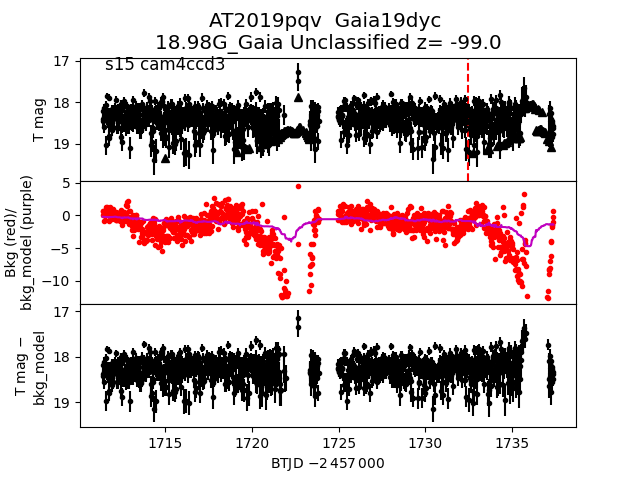
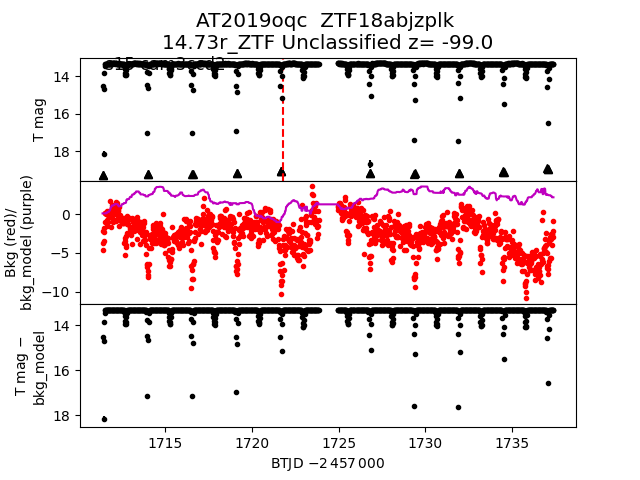
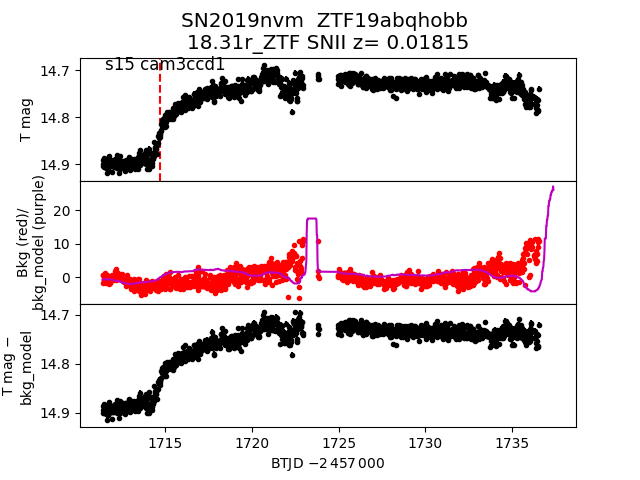
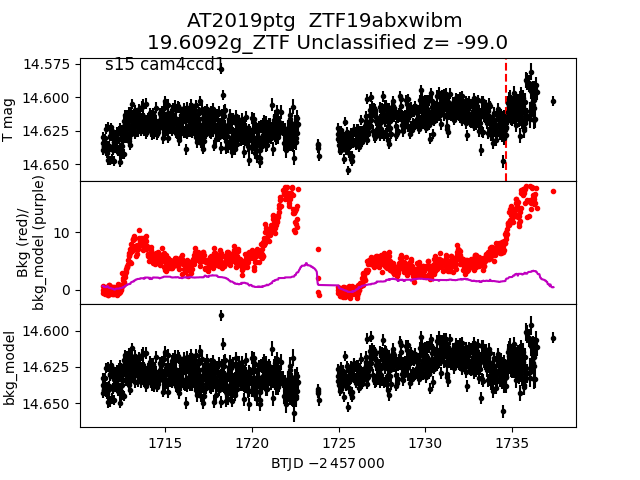
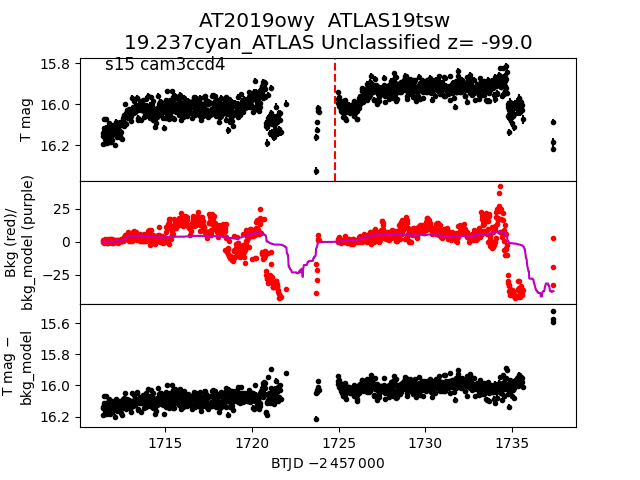
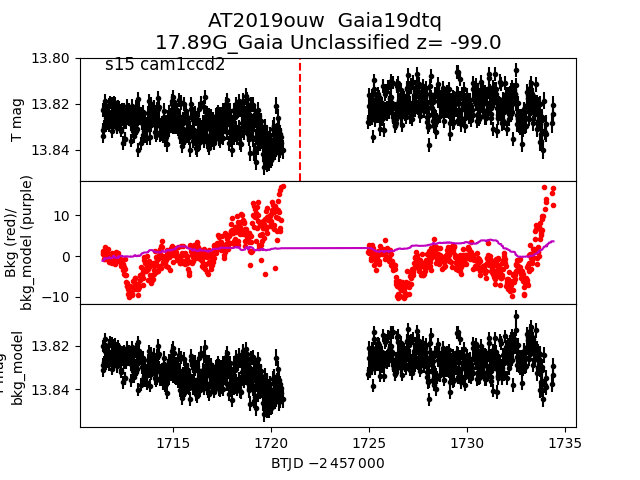
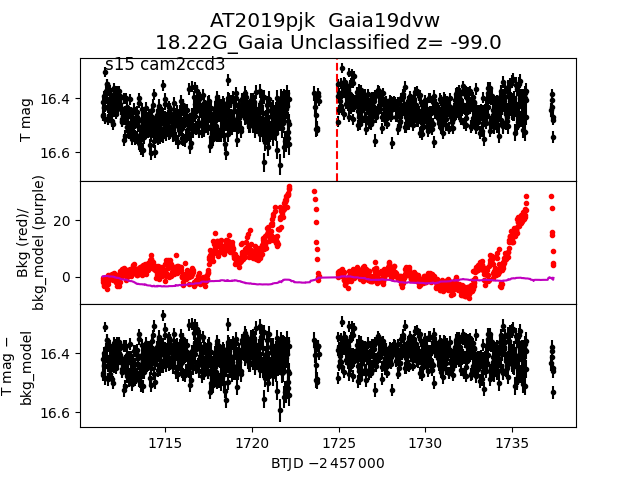
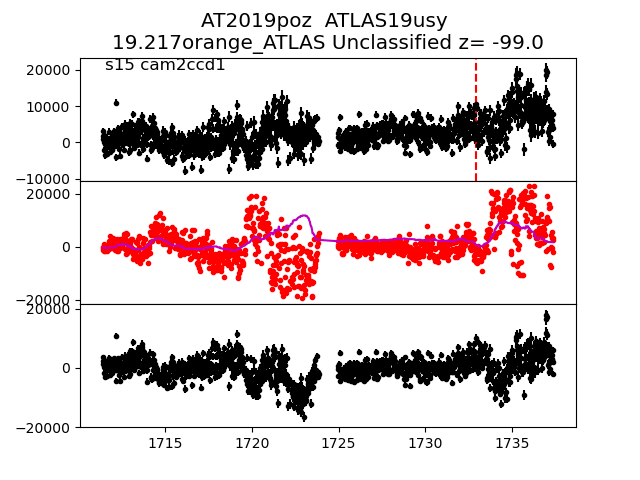
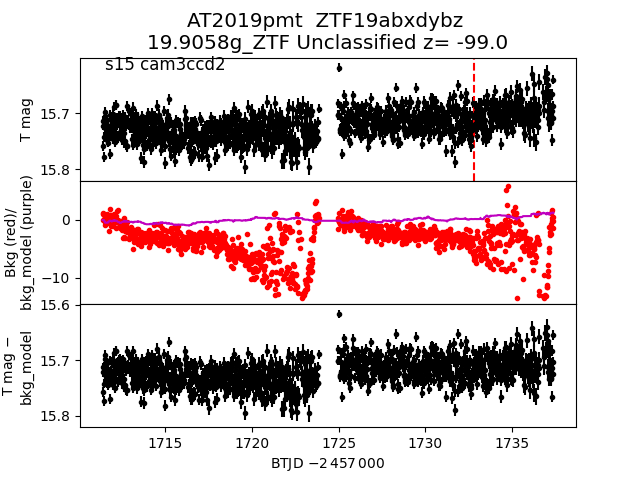
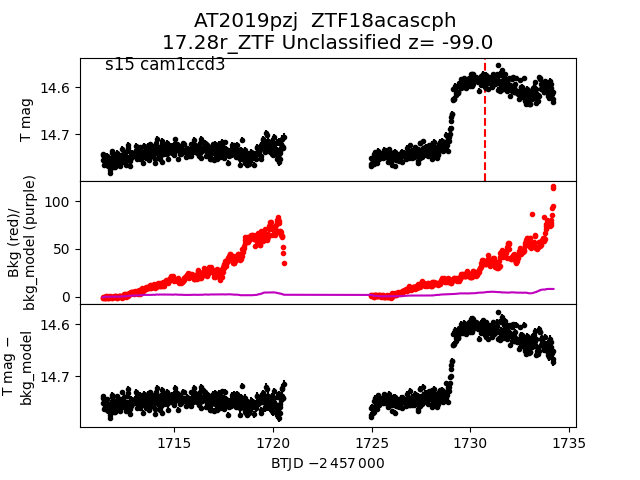
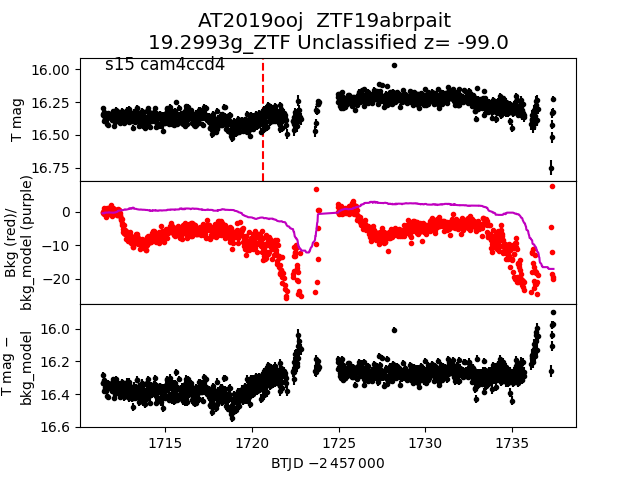
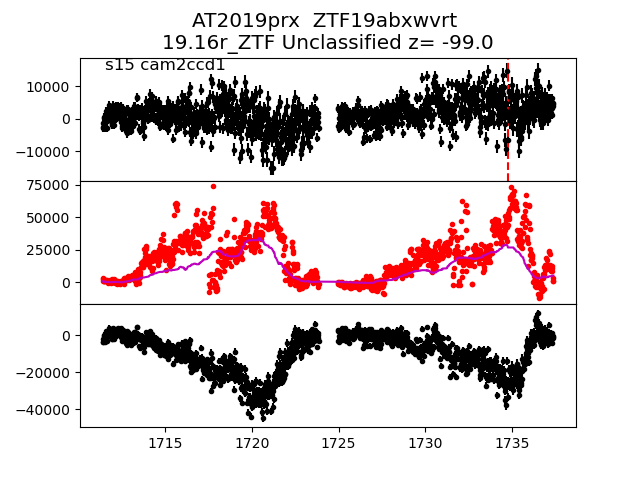
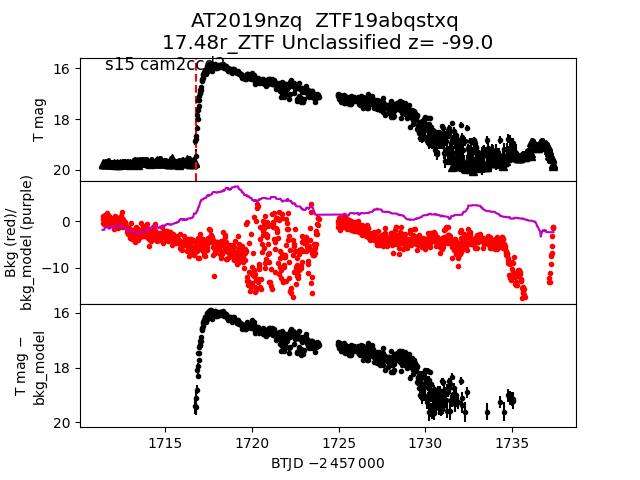
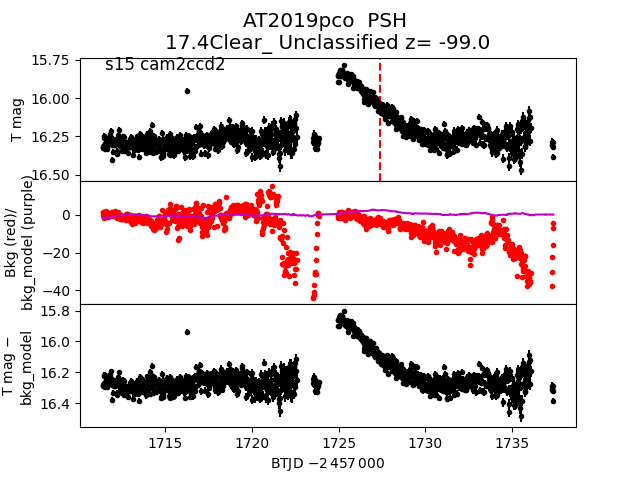
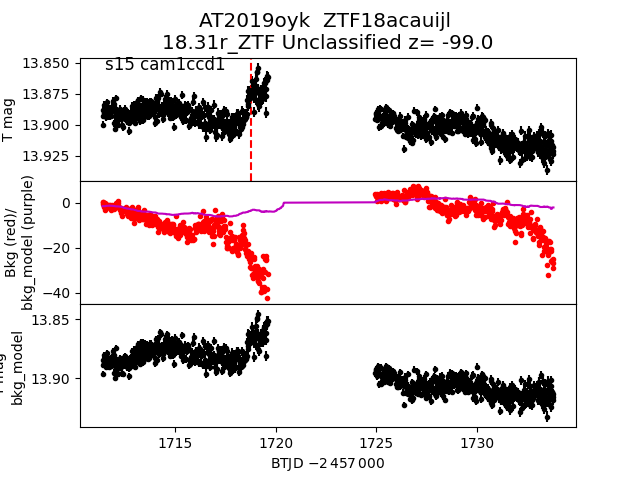
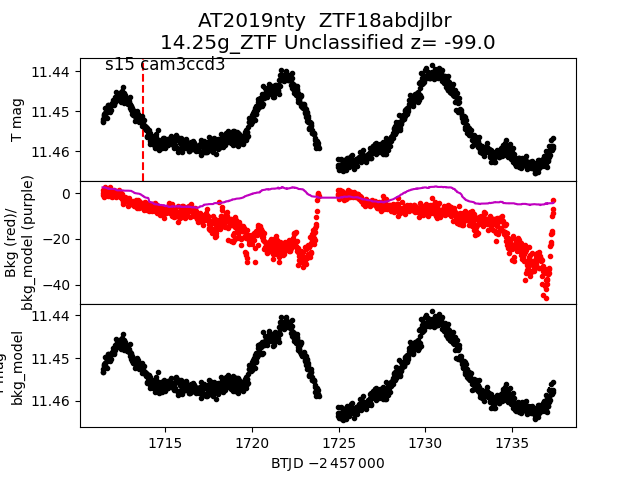
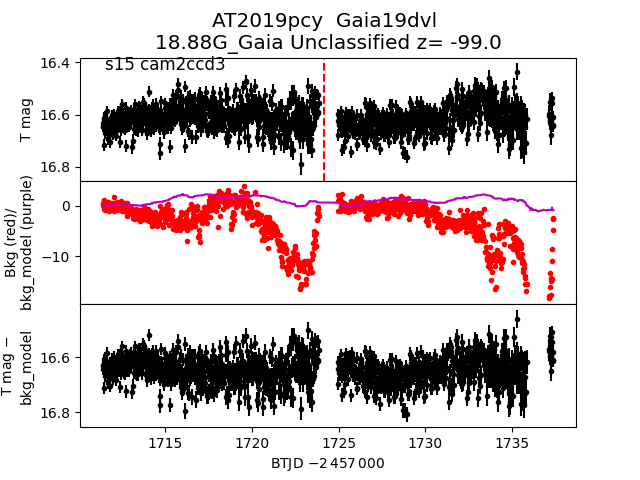
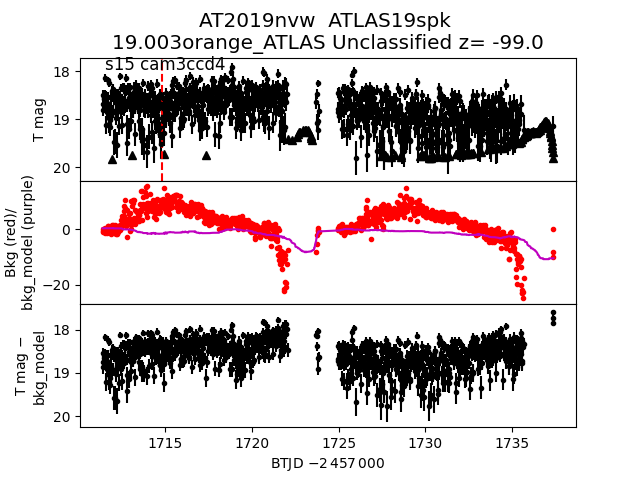
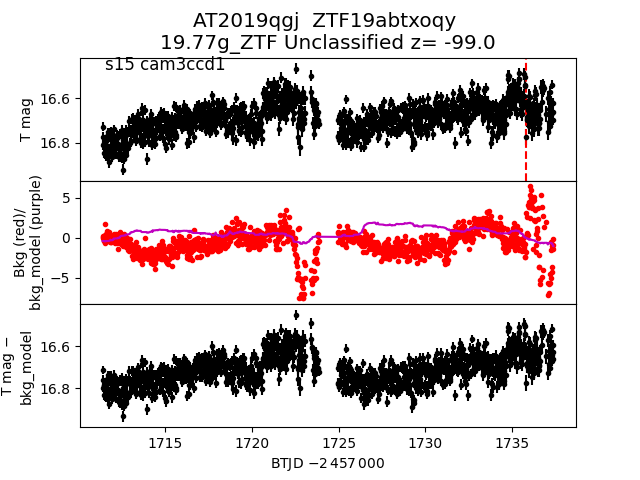
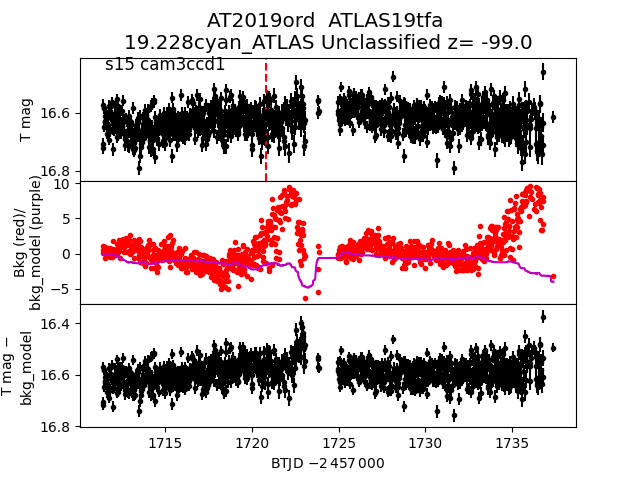
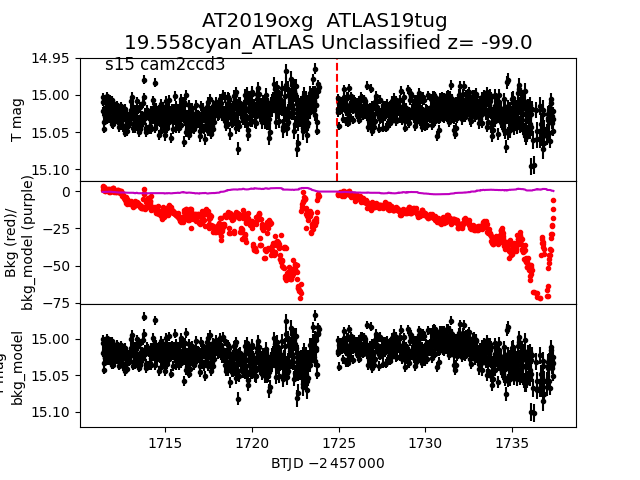
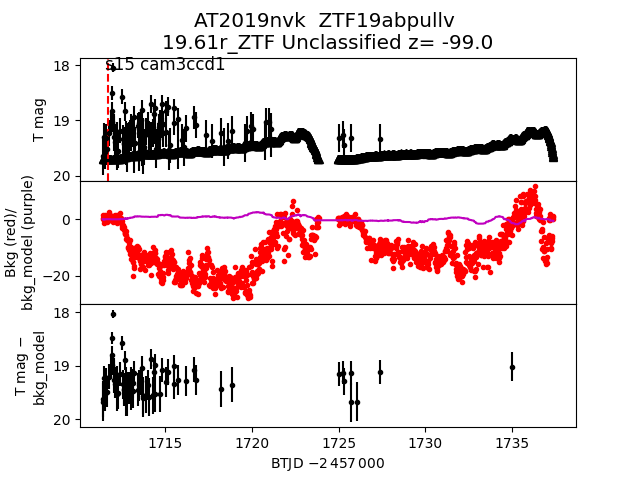
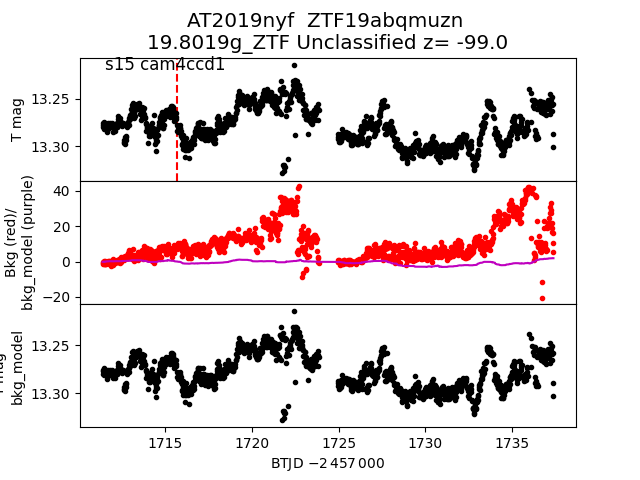
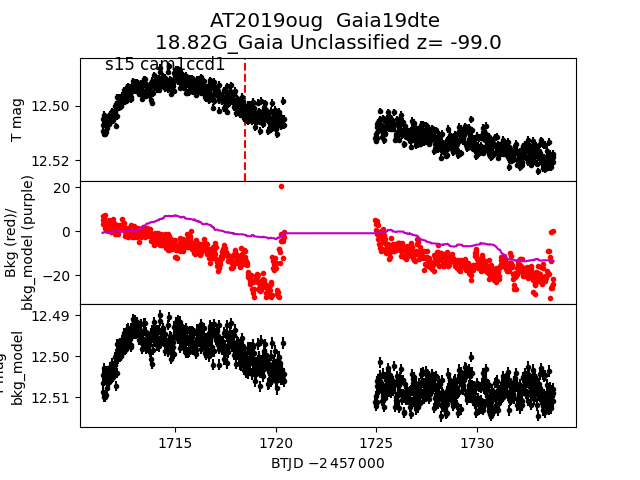
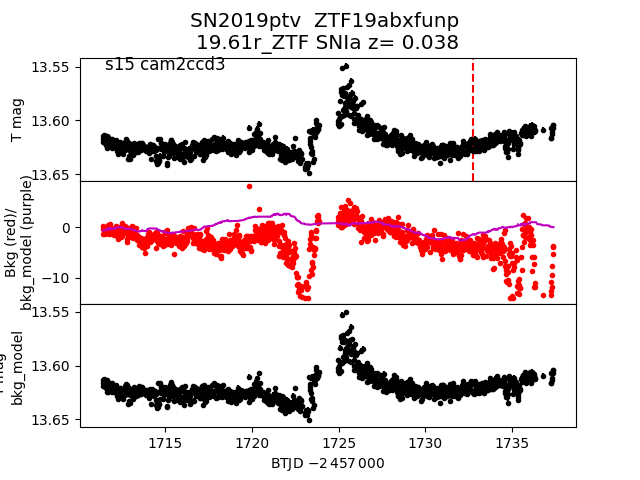
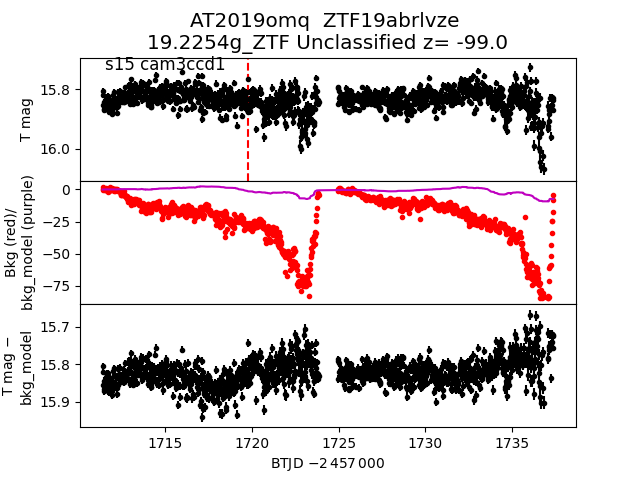
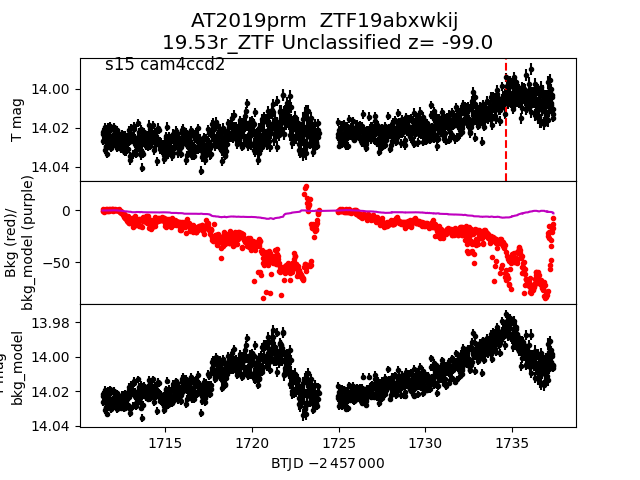
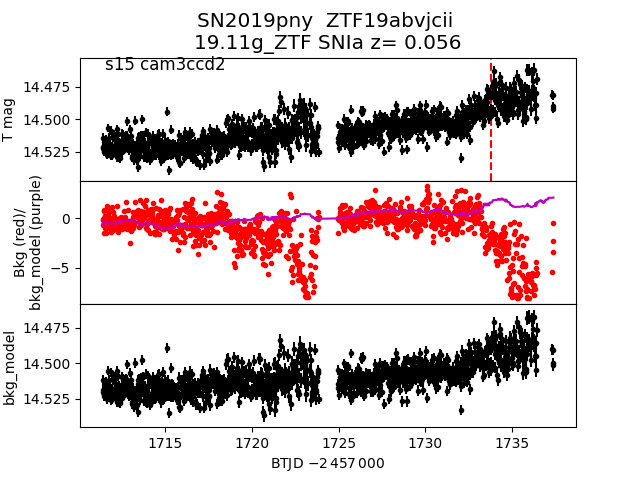
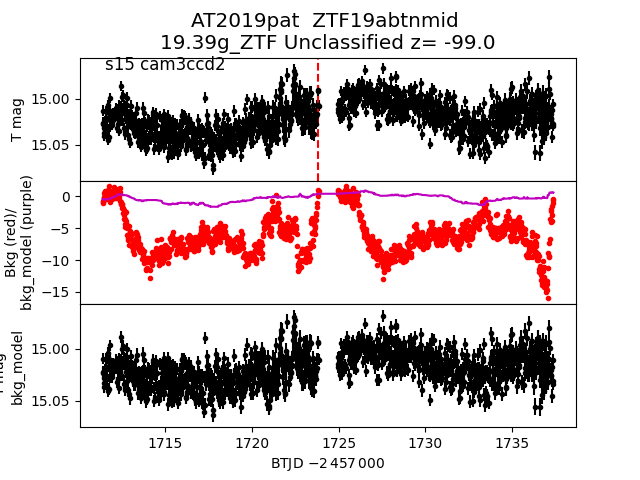
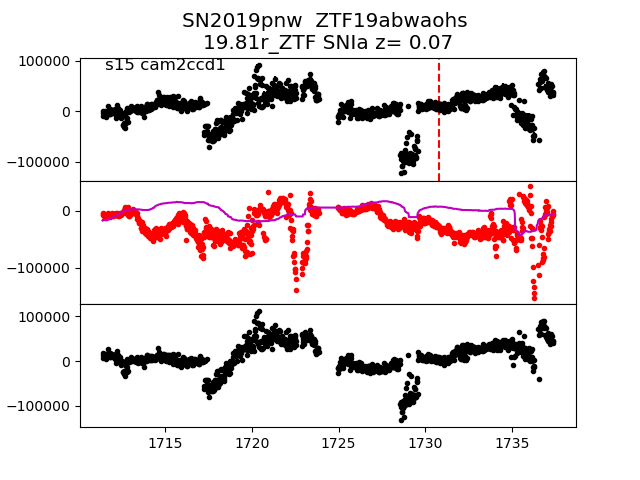
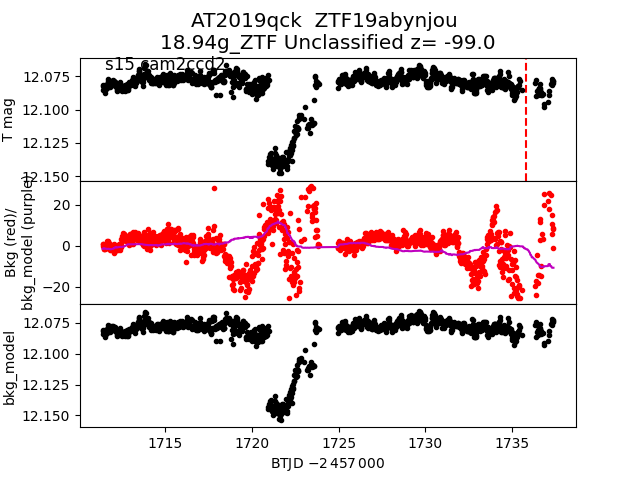
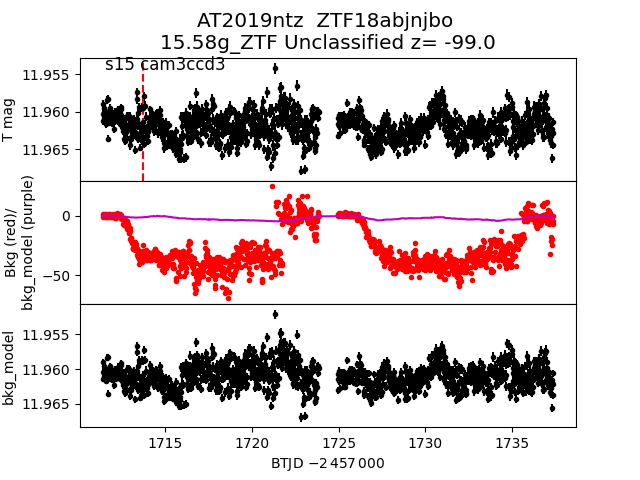
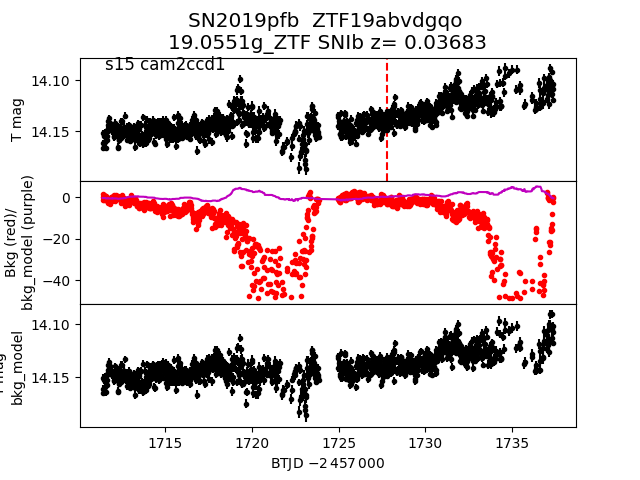
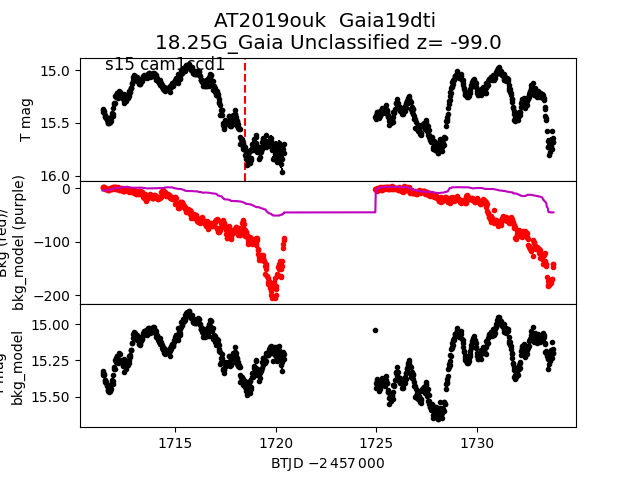
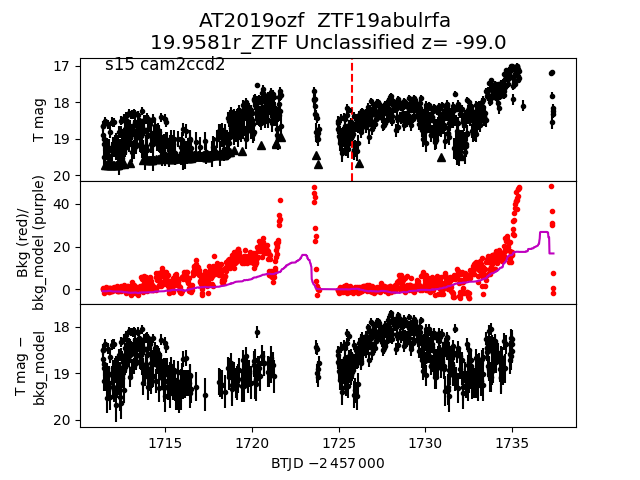
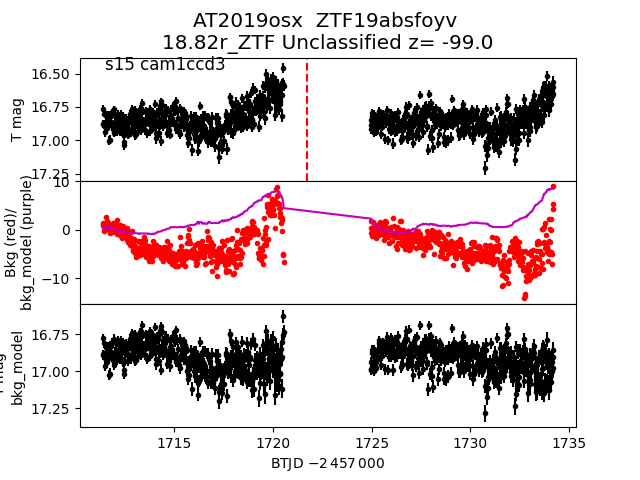
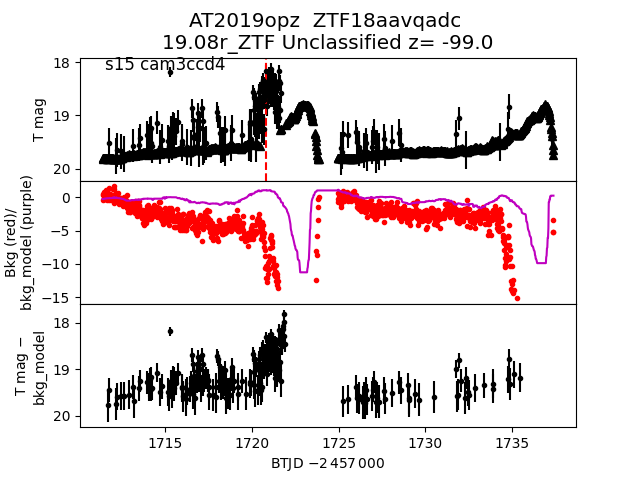
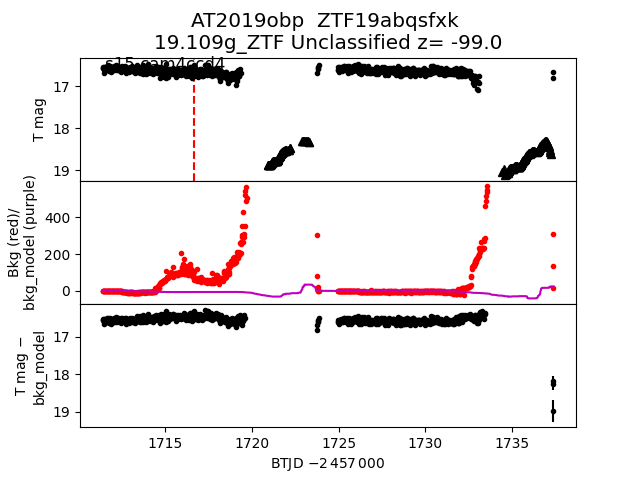
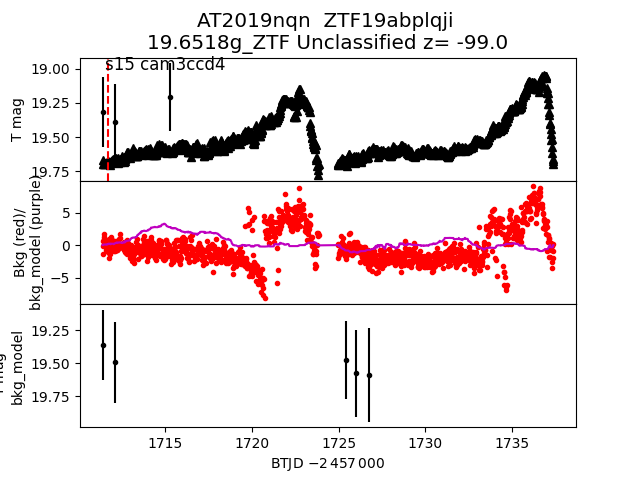
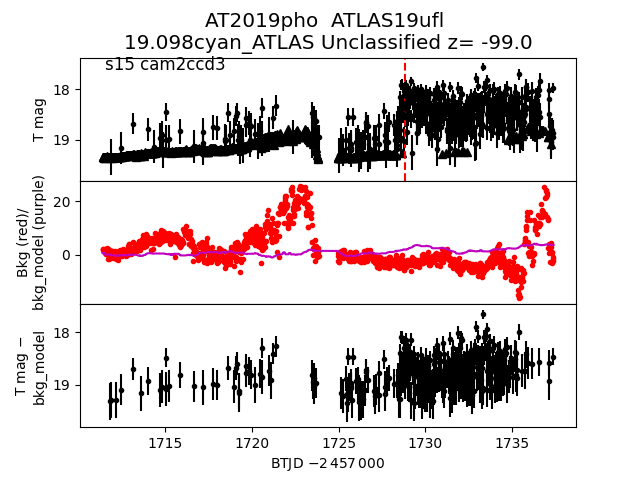
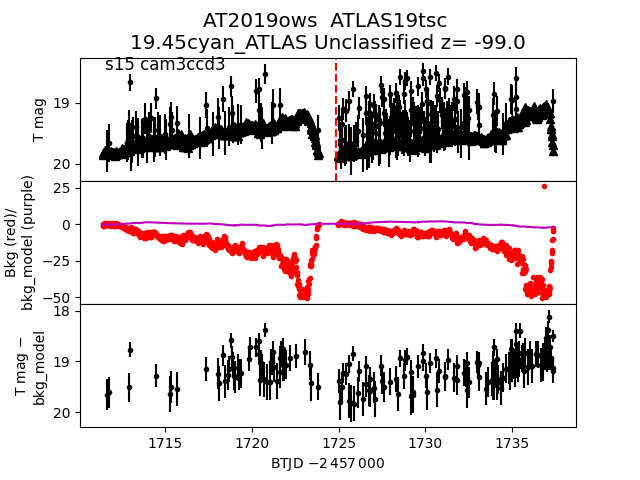
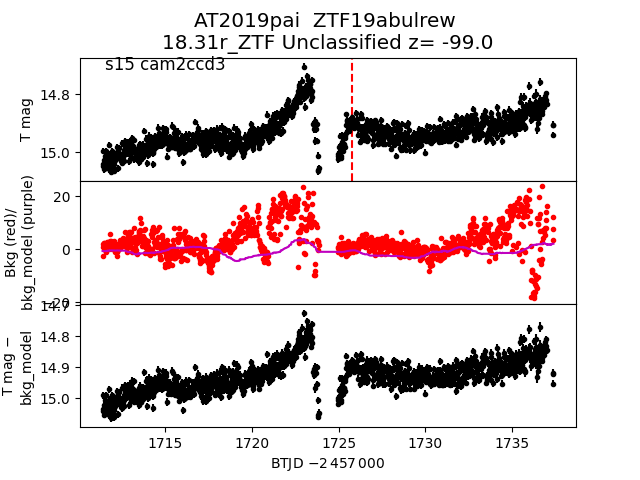
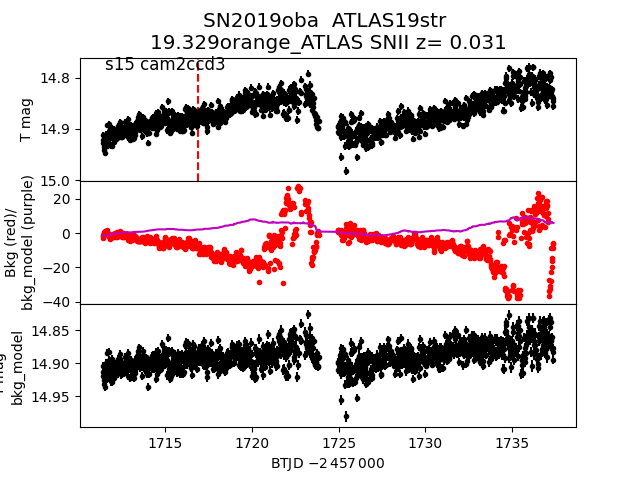
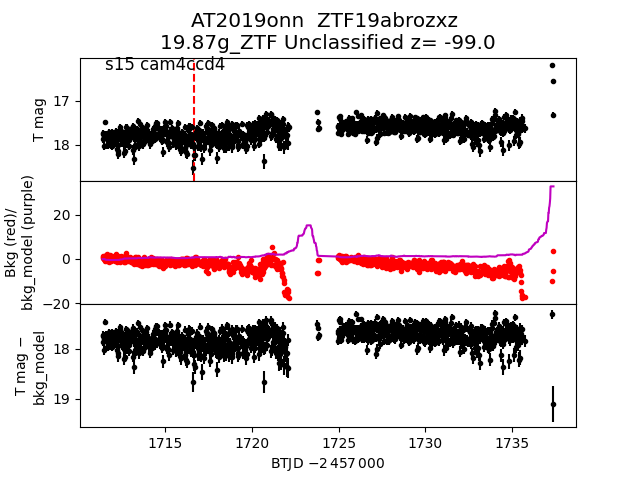
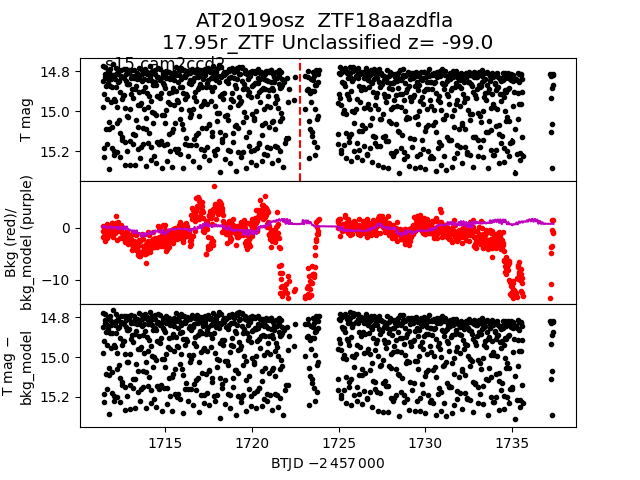
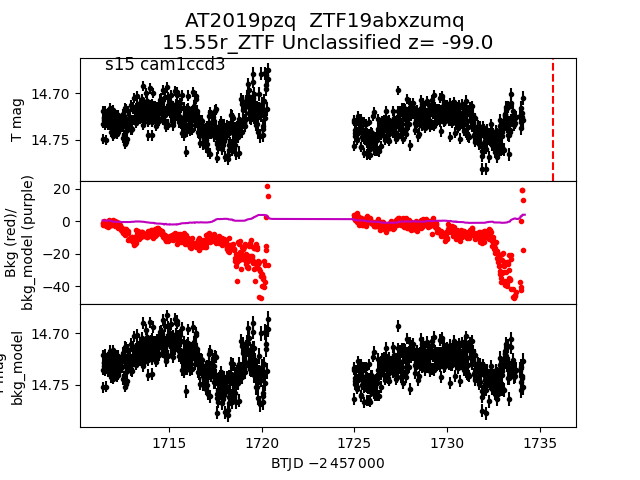
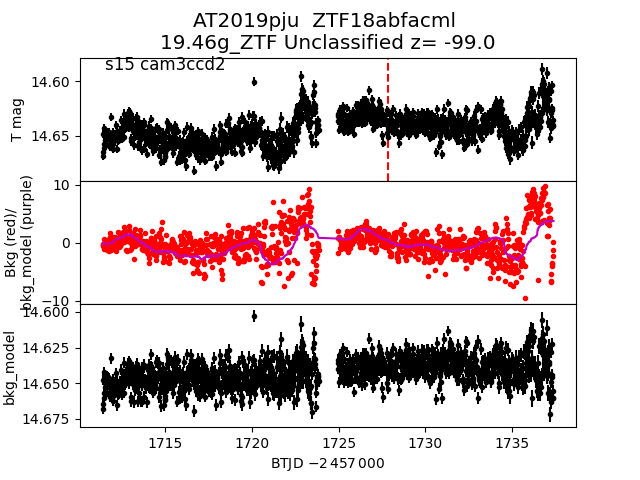
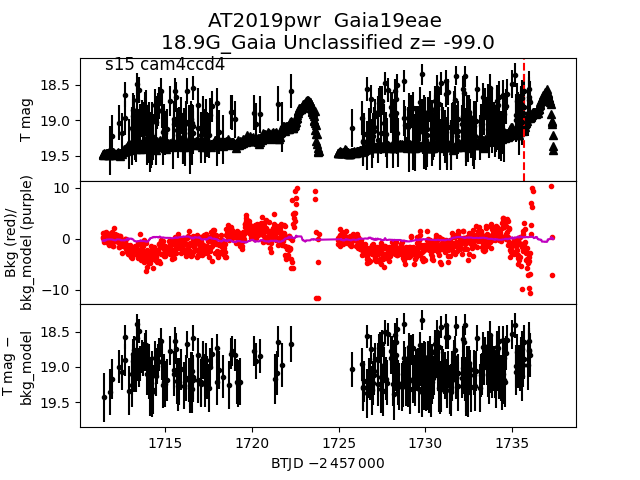
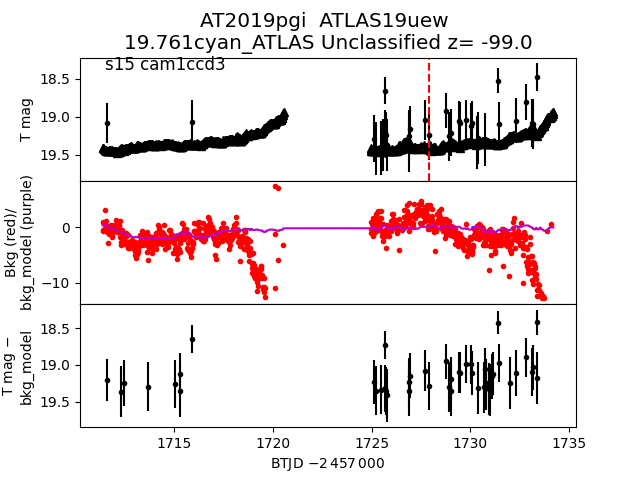
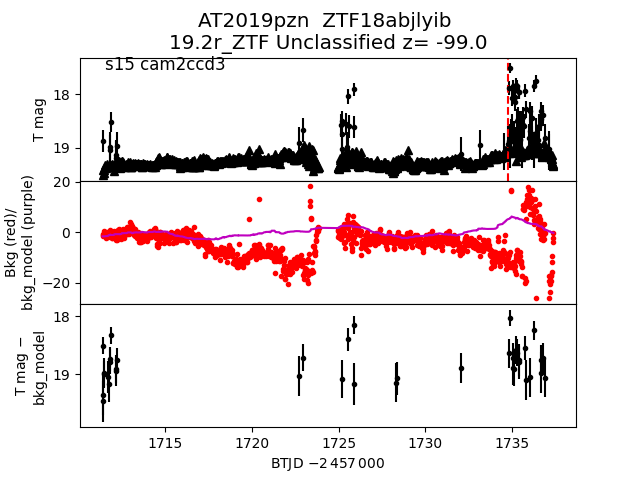
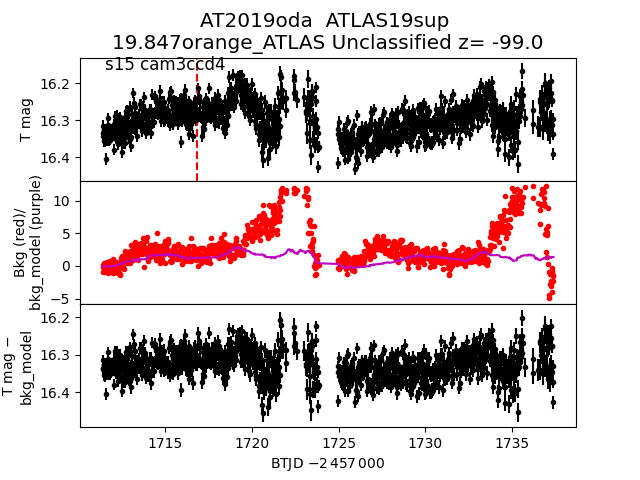
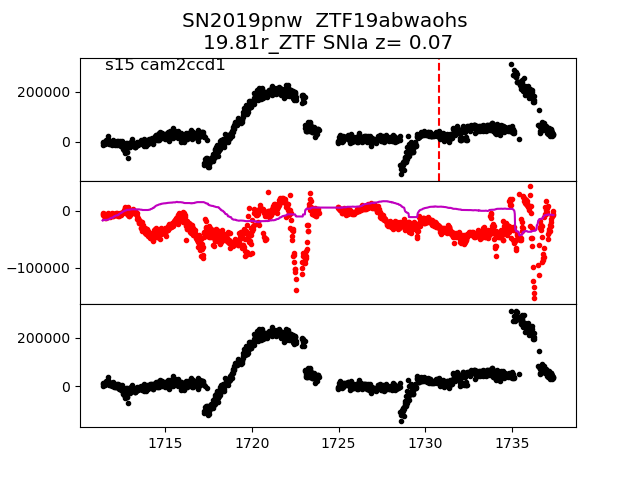
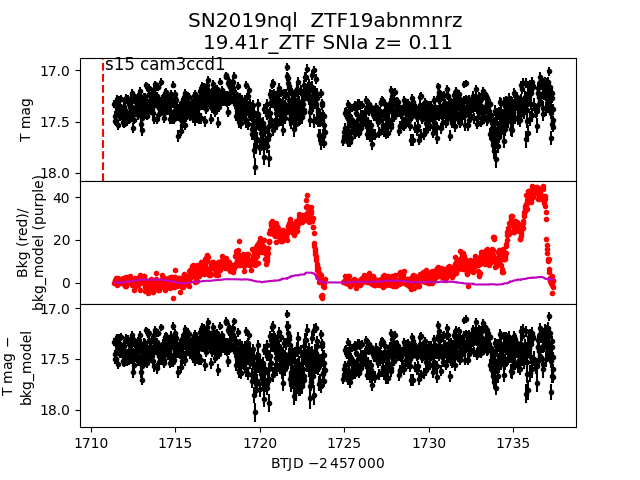
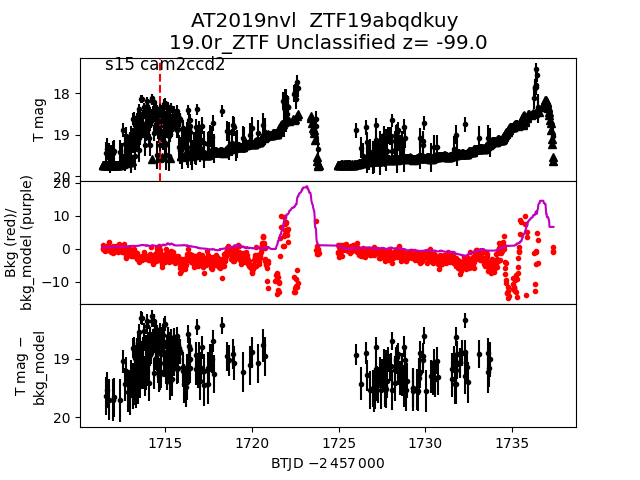
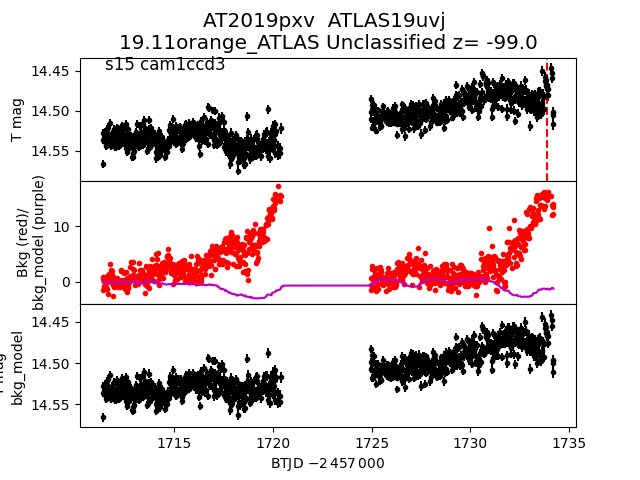
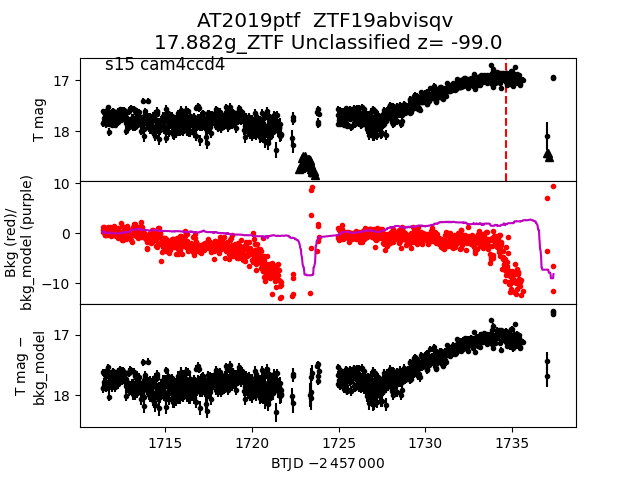
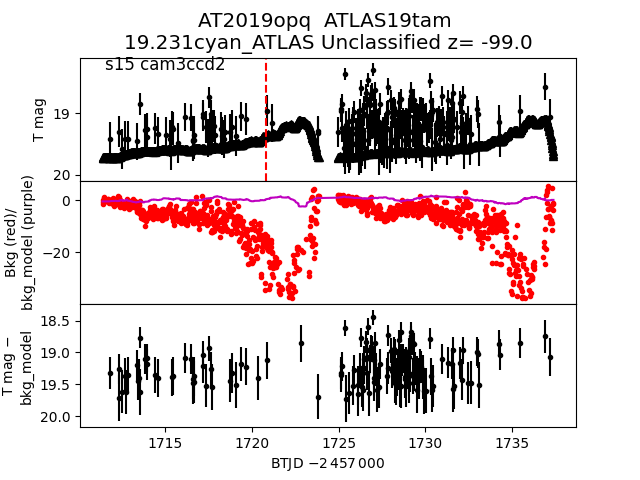
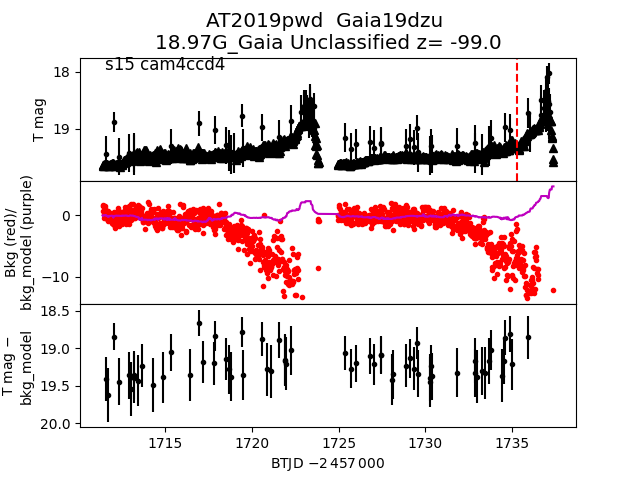
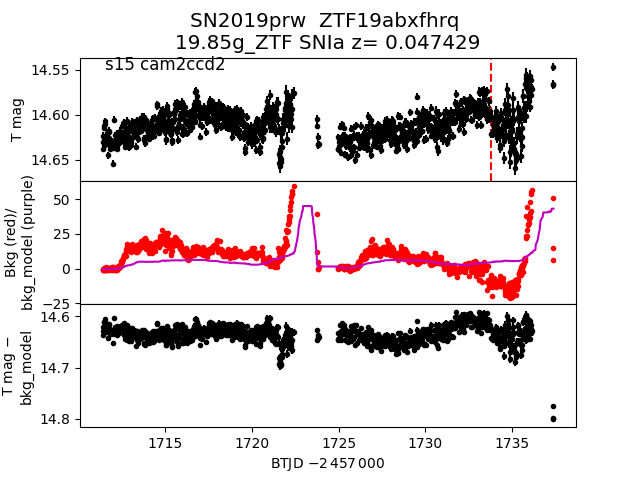
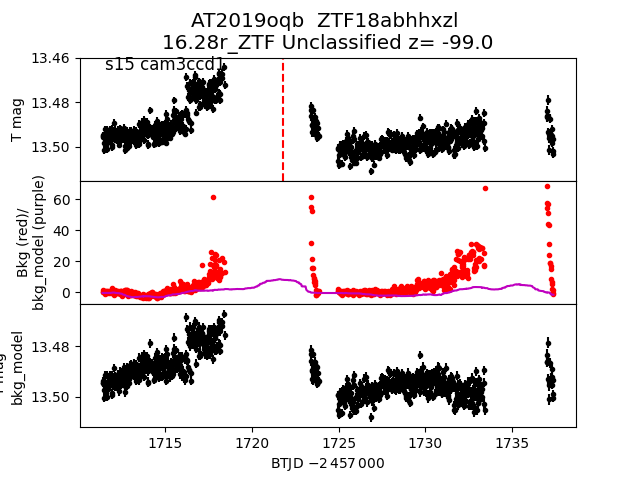
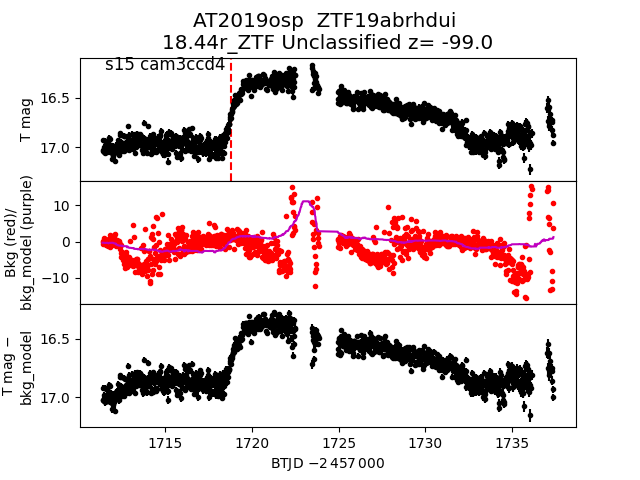
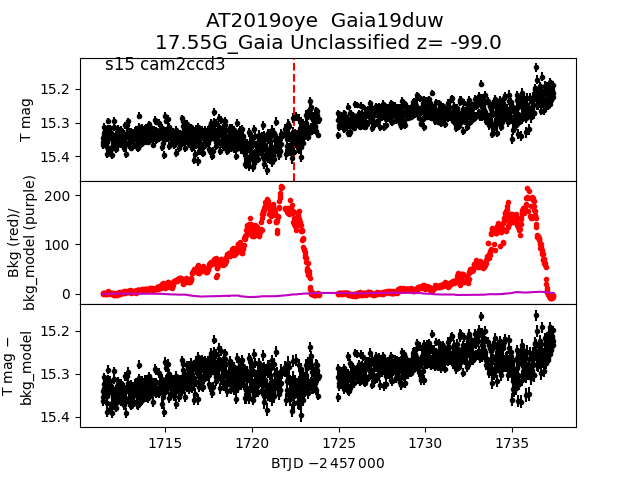
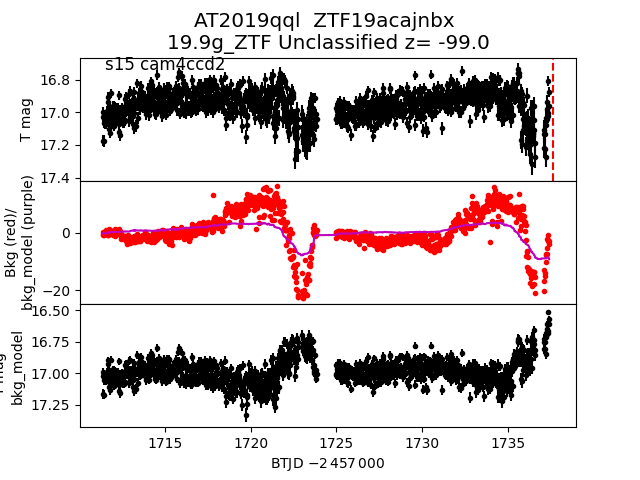
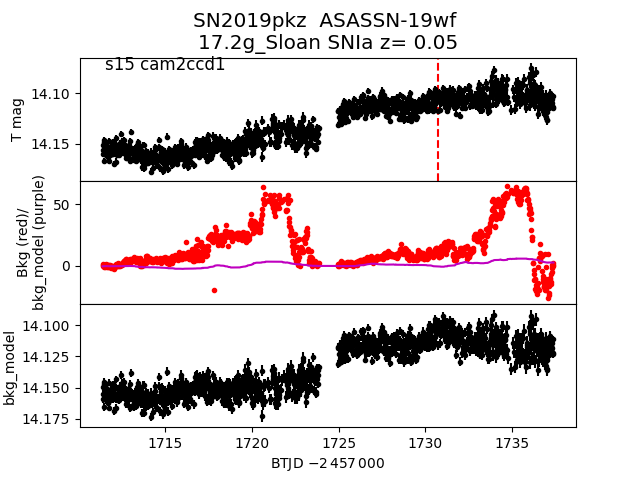
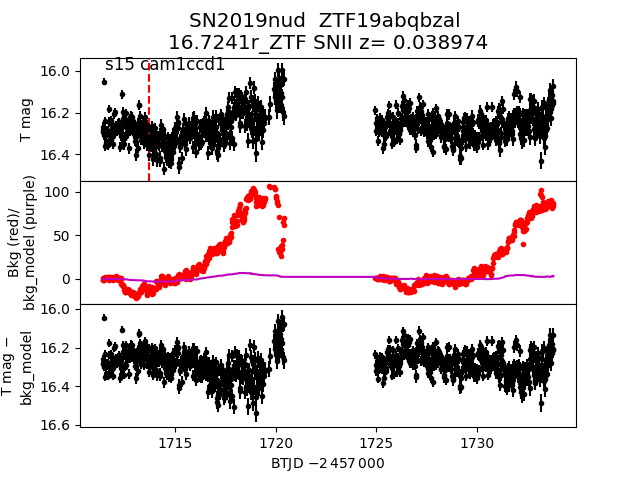
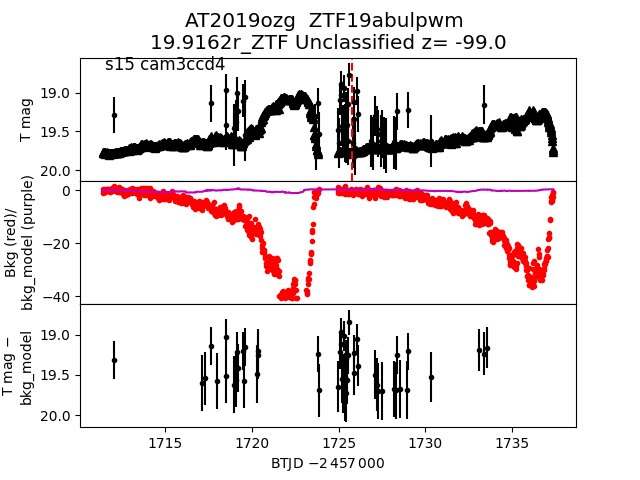
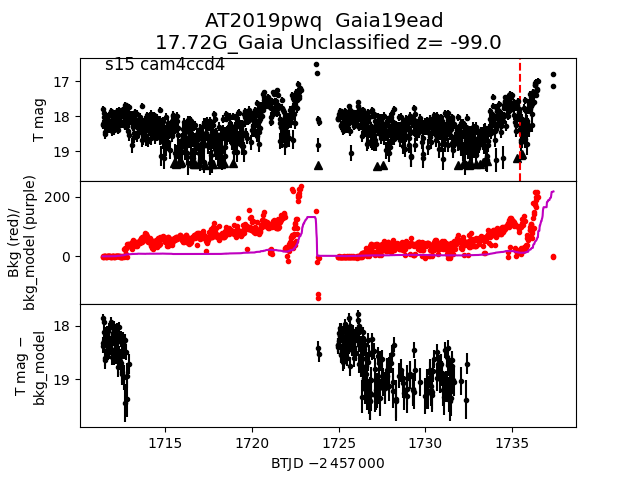
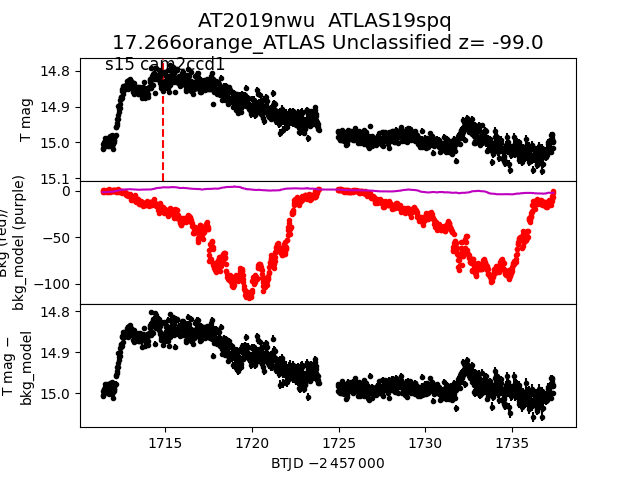
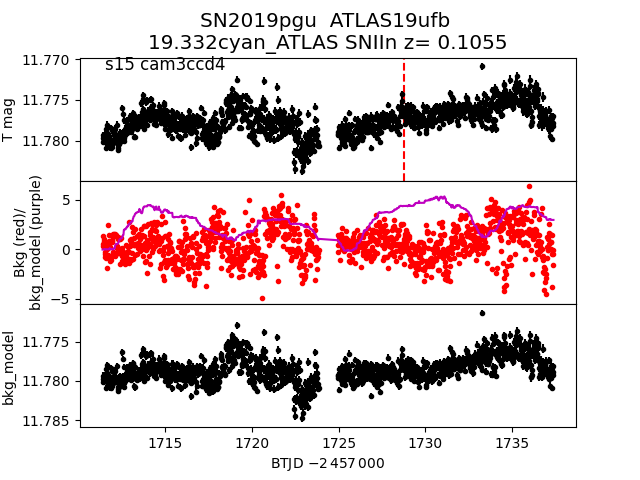
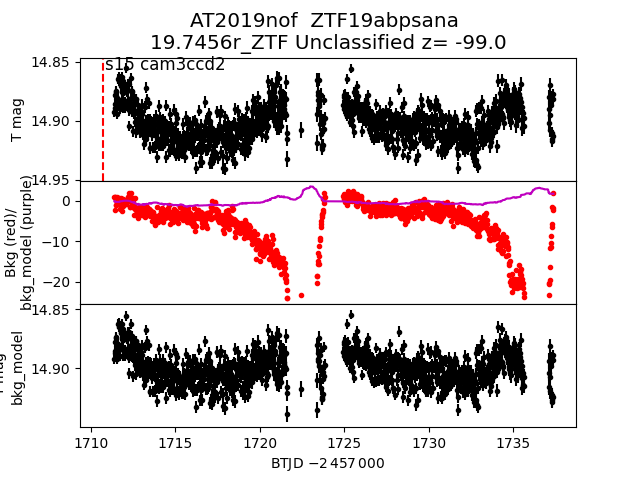
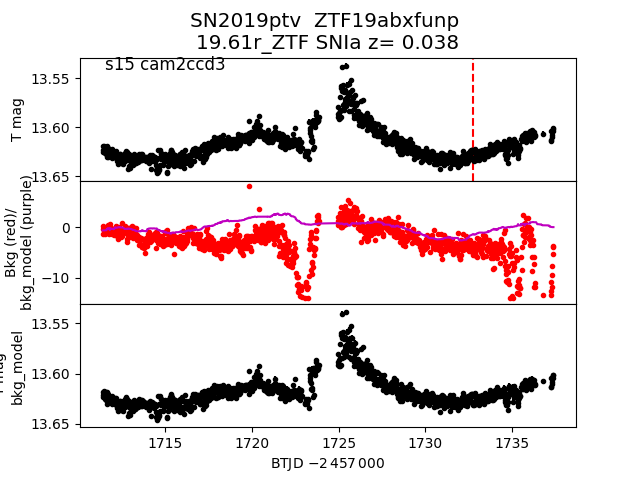
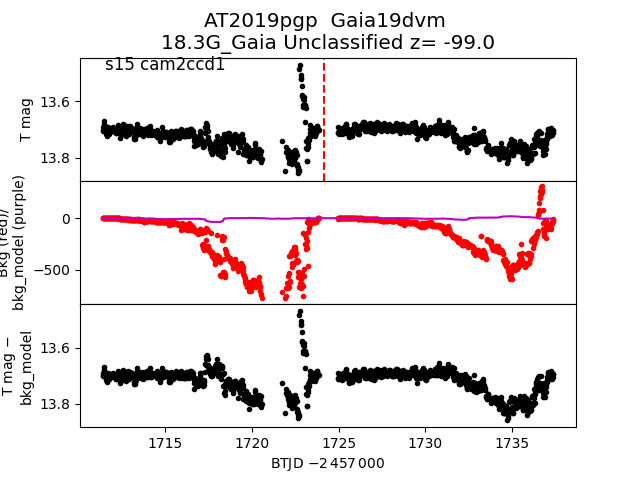
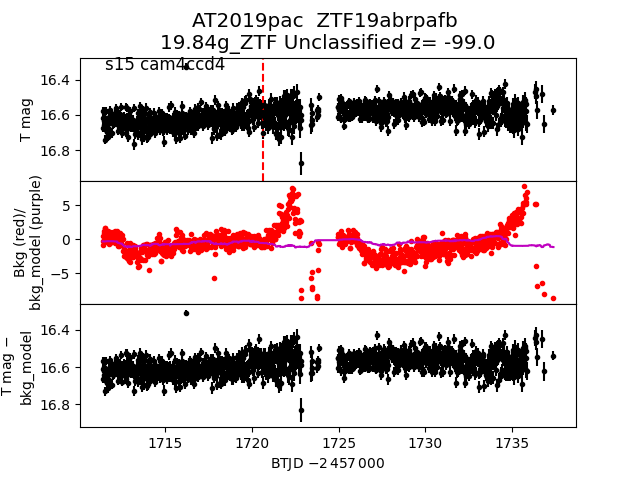
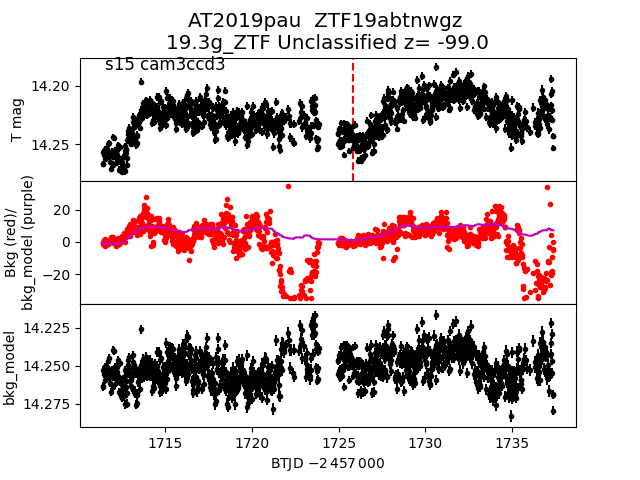
Each figure has three panels. The top panel shows the transient light curve, the middle panel shows the local background (estimated in an annulus), and the bottom panel shows a "background-model corrected" light curve. Details about the background model are in the README.
The vertical red line marks the time of discovery reported to TNS. Other useful metadata from TNS is in the figure title.
Note that the top and bottom panel are in magnitudes, while the middle panel is in differential flux units. The magnitudes are calibrated to the flux in the reference image used for image subtraction. Thus, flux from the host galaxy is included in these magnitudes.
3-sigma upper limits are plotted as triangles with no errorbars. A typical limiting magnitude is 19.6 in 30 minutes or 18.4 in 200 seconds (for low backgrounds).
The links allow you to download the light curve data as a text file.
More details in the README.
2019pqv
 2019oqc
 2019nvm
 2019ptg
 2019owy
 2019ouw
 2019pjk
 2019poz
 2019pmt
 2019pzj
 2019ooj
 2019prx
 2019nzq
 2019pco
 2019oyk
 2019nty
 2019pcy
 2019nvw
 2019qgj
 2019ord
 2019oxg
 2019nvk
 2019nyf
 2019oug
 2019ptv_detrended
 2019omq
 2019prm
 2019pny
 2019pat
 2019pnw_detrended
 2019qck
 2019ntz
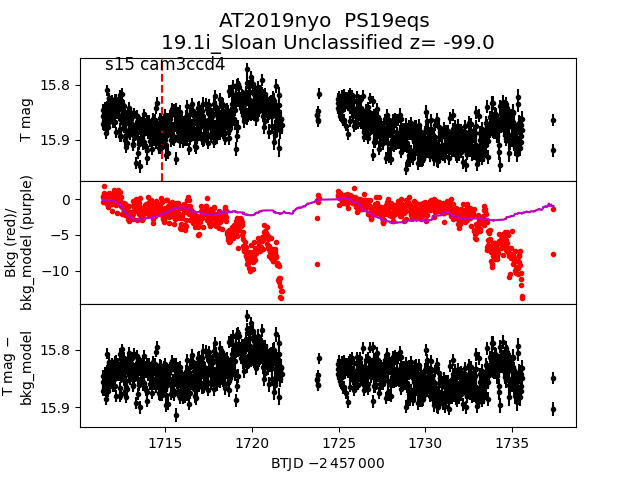
 2019nyo
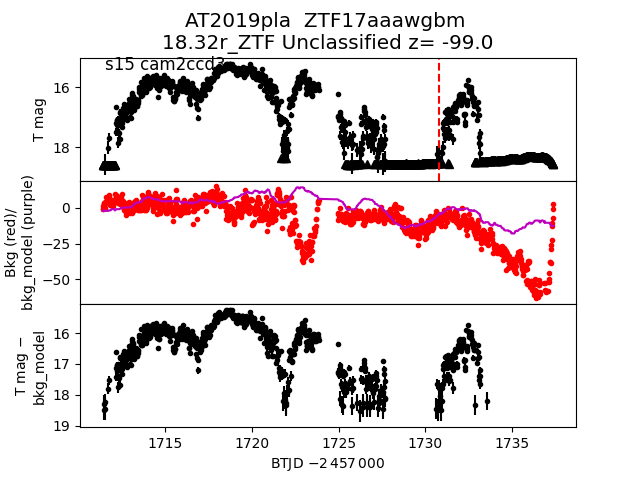
 2019pla
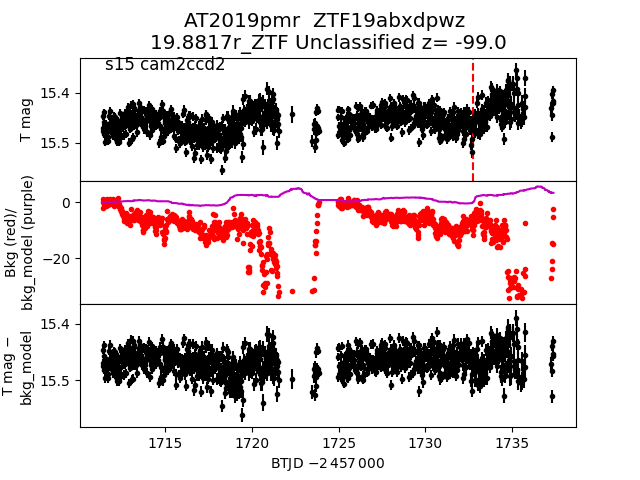
 2019pmr
 2019pfb
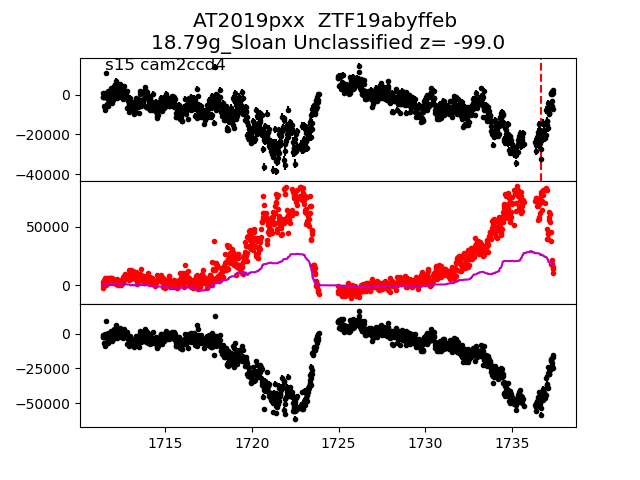
 2019pxx
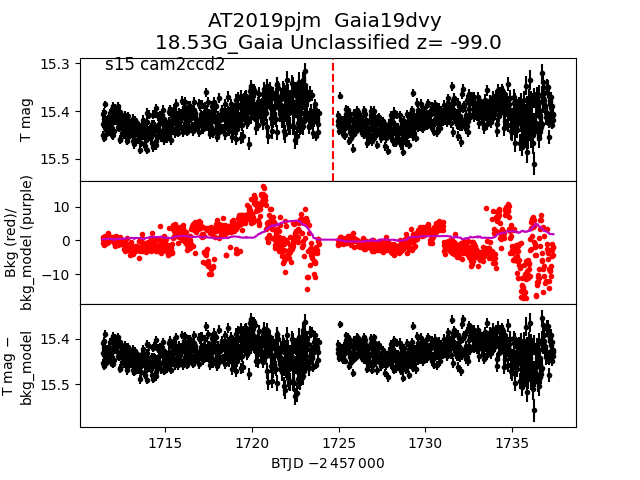
 2019pjm
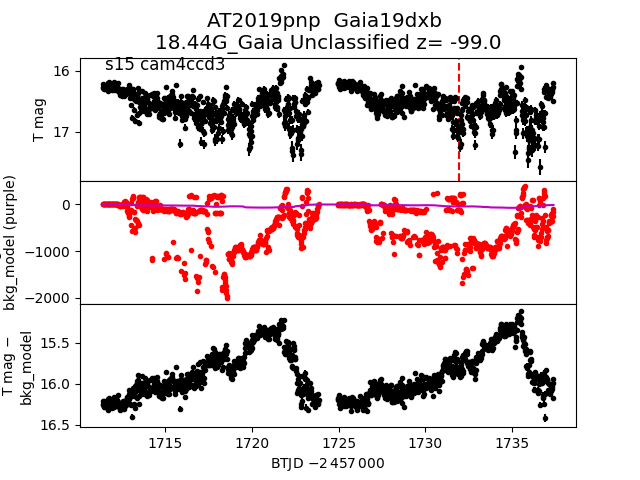
 2019pnp
 2019ouk
 2019ozf
 2019osx
 2019opz
 2019obp
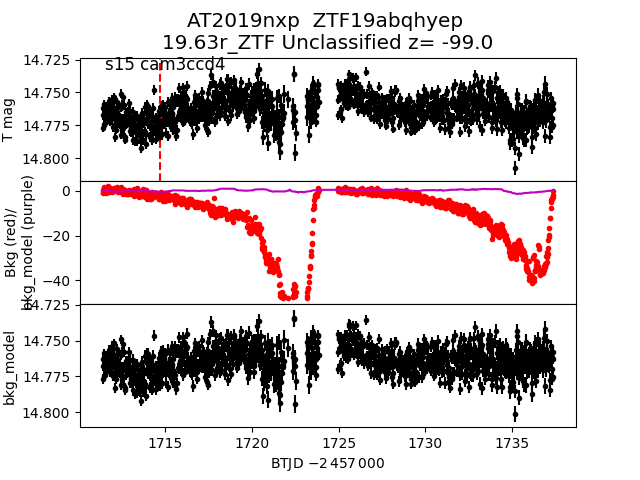
 2019nxp
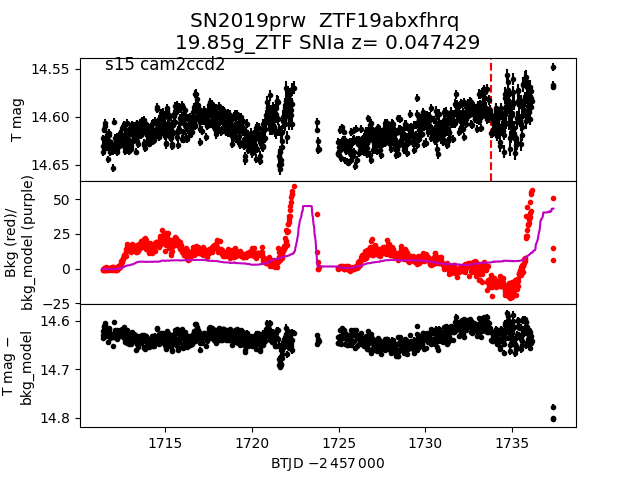
 2019prw
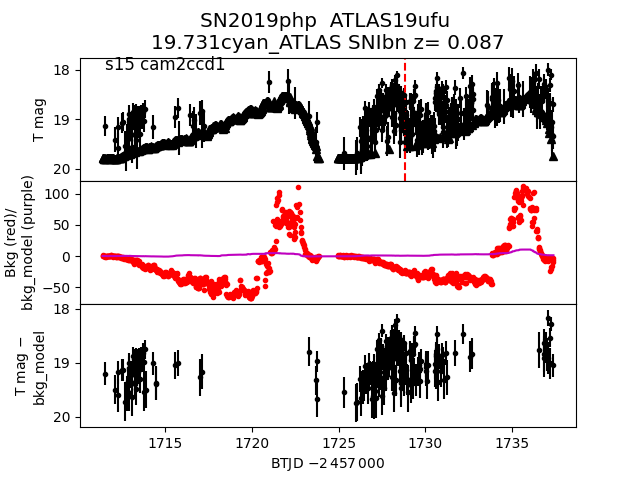
 2019php
 2019nqn
 2019pho
 2019ows
 2019pai
 2019oba
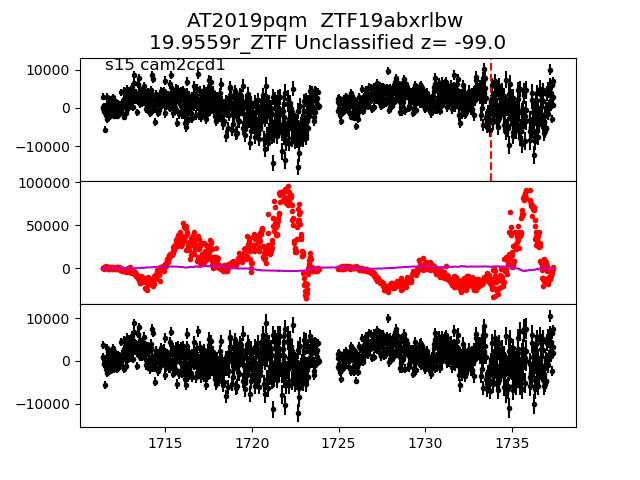
 2019pqm
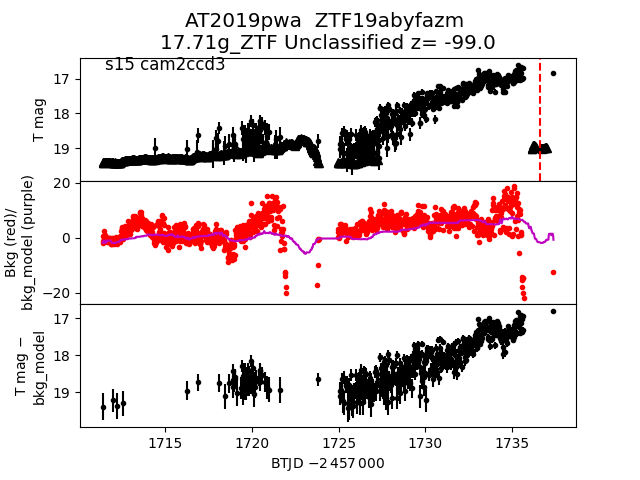
 2019pwa
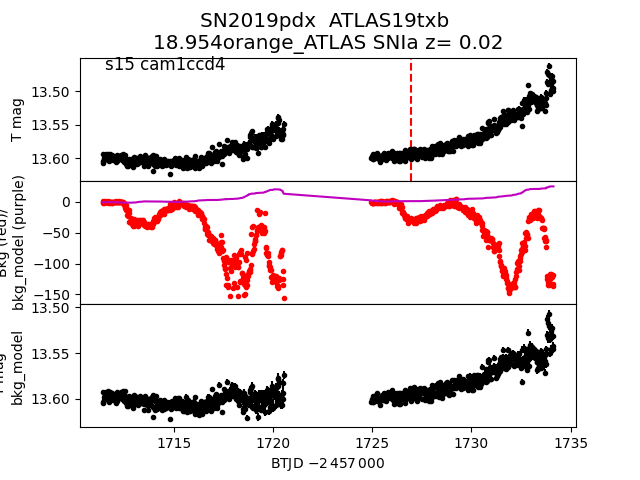
 2019pdx
 2019onn
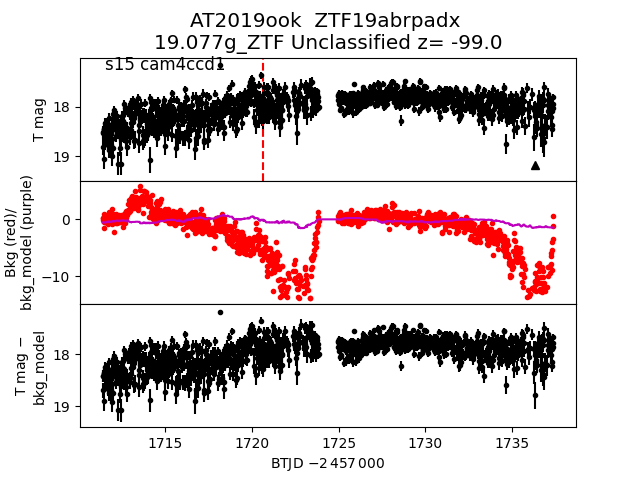
 2019ook
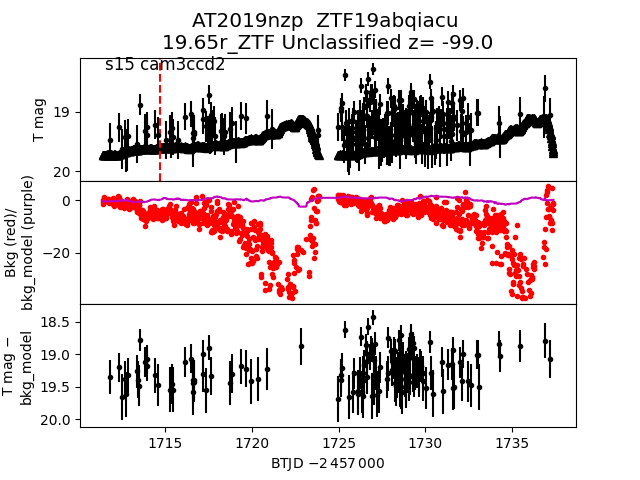
 2019nzp
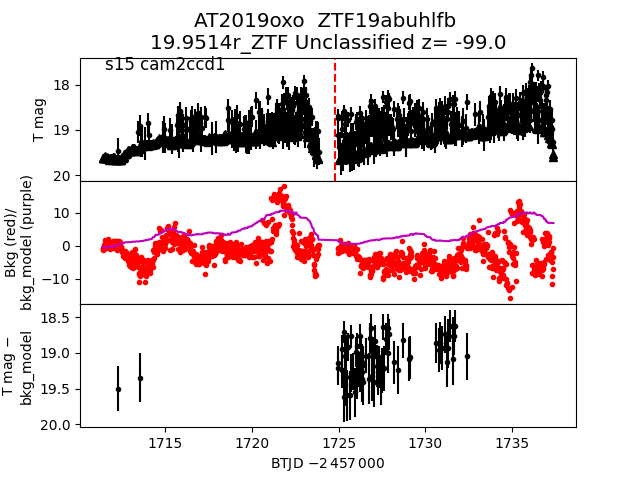
 2019oxo
 2019osz
 2019pzq
 2019pju
 2019pwr
 2019pgi
 2019pzn
 2019oda
 2019pnw
 2019nql
 2019nvl
 2019pxv
 2019ptf
 2019opq
 2019pwd
 2019prw_detrended
 2019oqb
 2019osp
 2019oye
 2019qql
 2019pkz
 2019nud
 2019ozg
 2019pwq
 2019nwu
 2019pgu
 2019nof
 2019ptv
 2019pgp
 2019pac
 2019pau
 2019prs