all transients in sector14 (85 total)
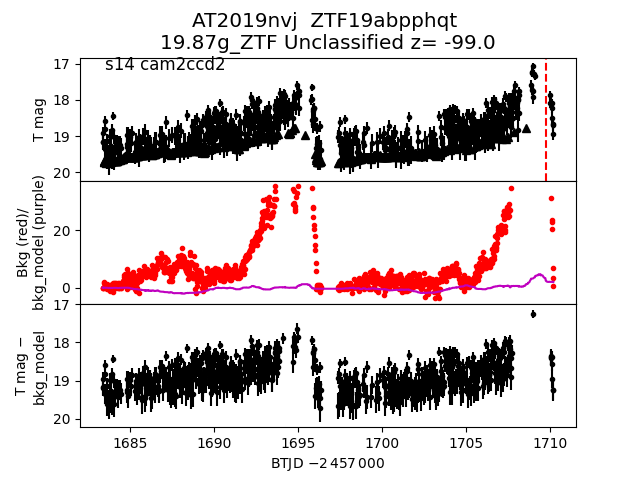
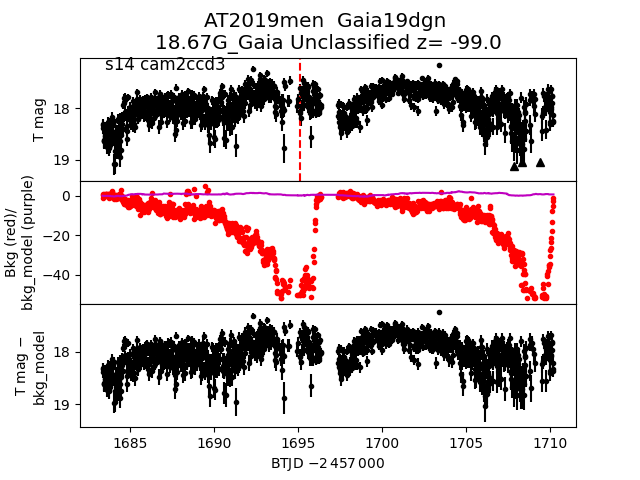
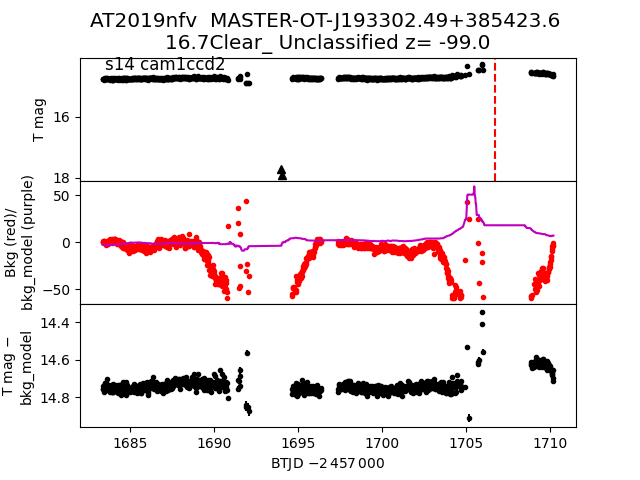
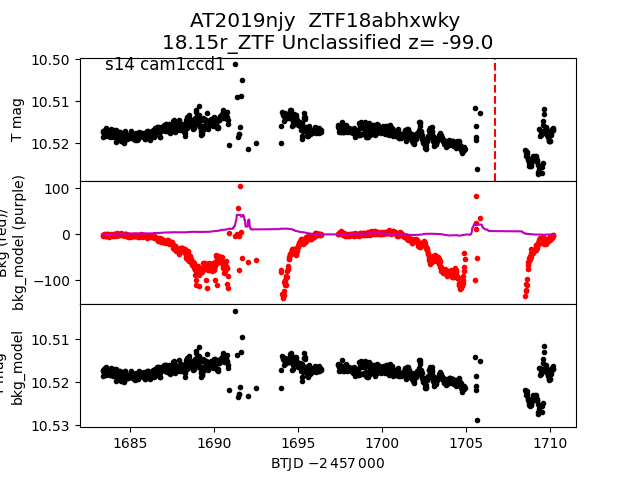
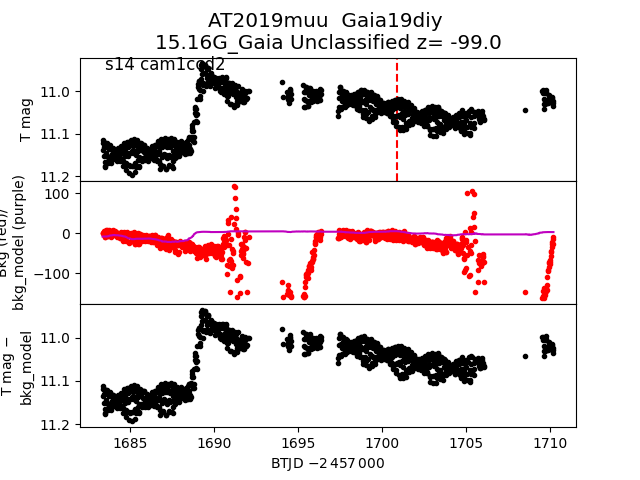
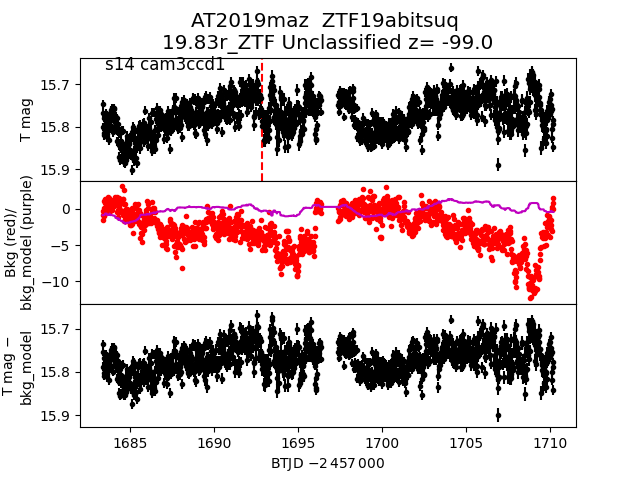
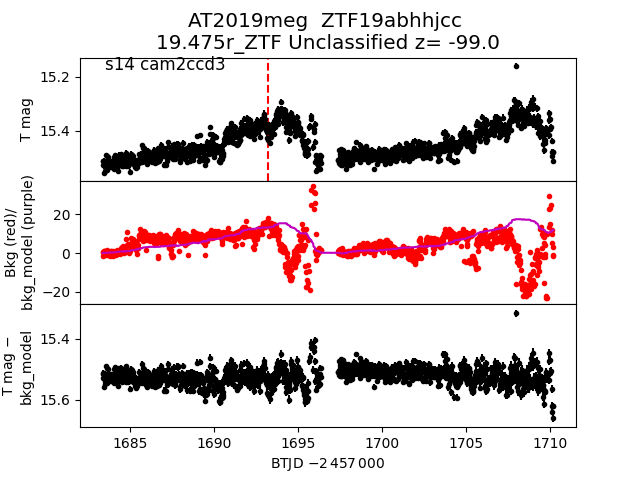
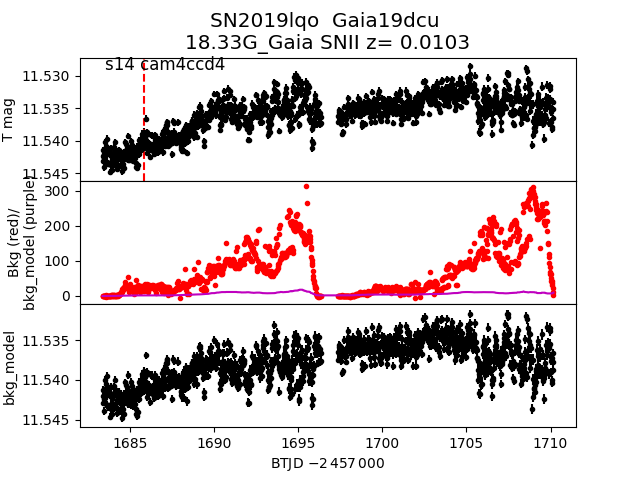
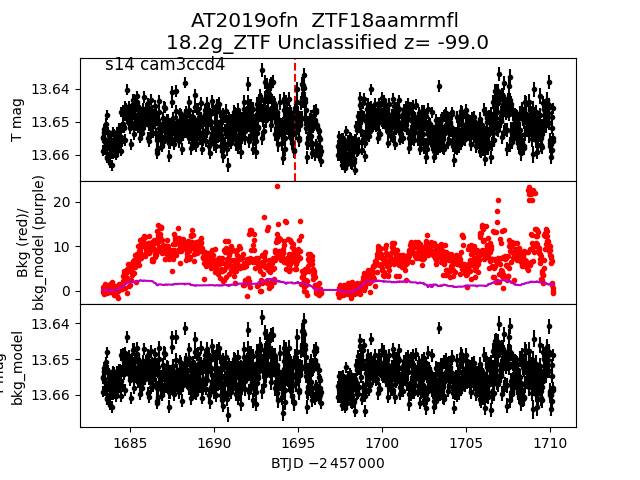
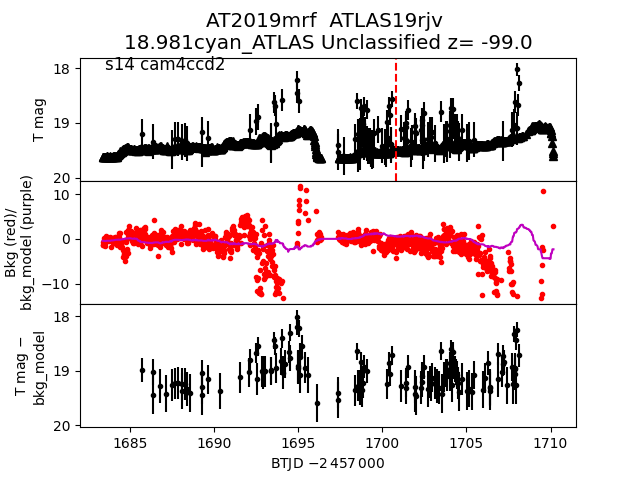
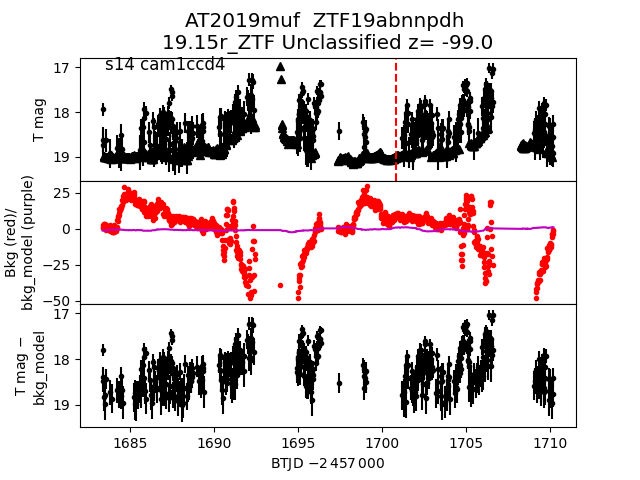
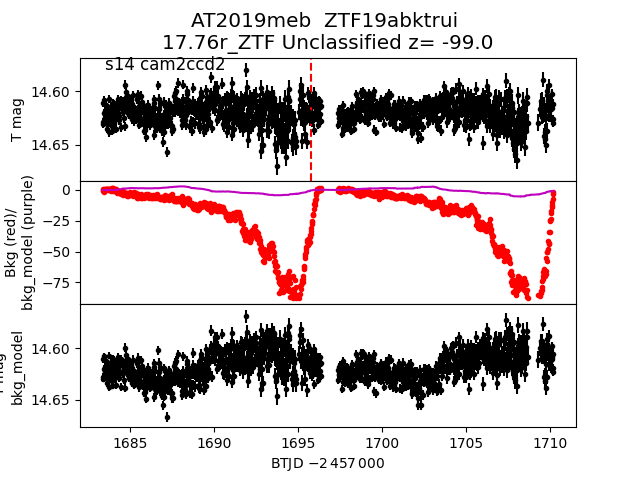
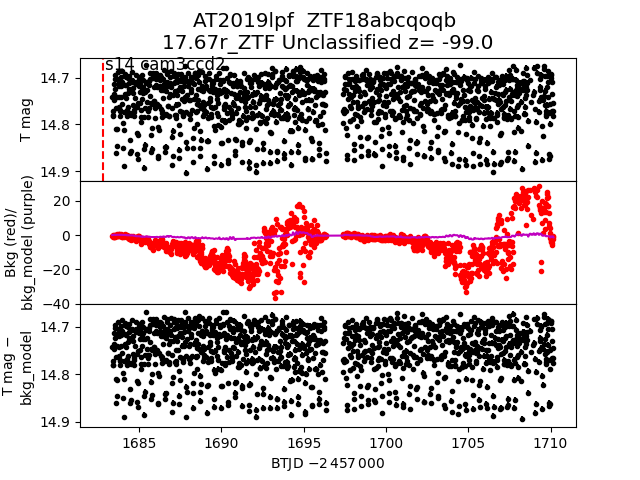
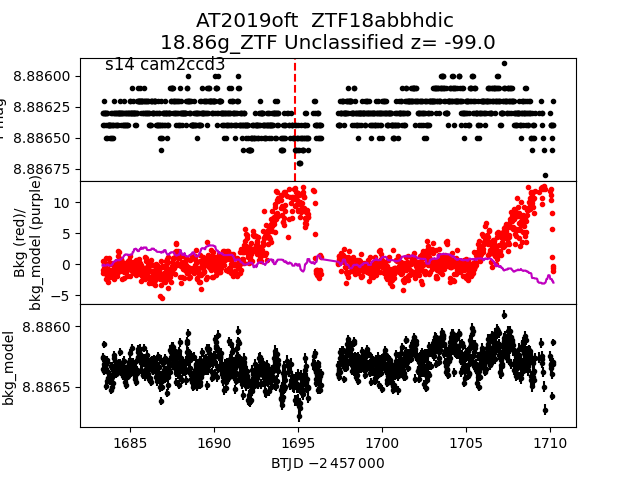
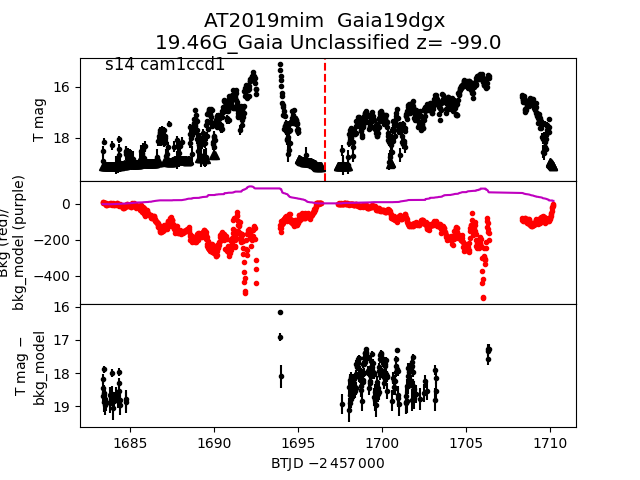
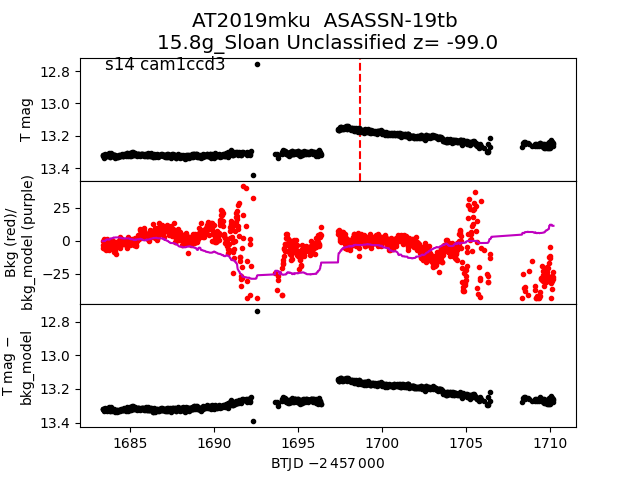
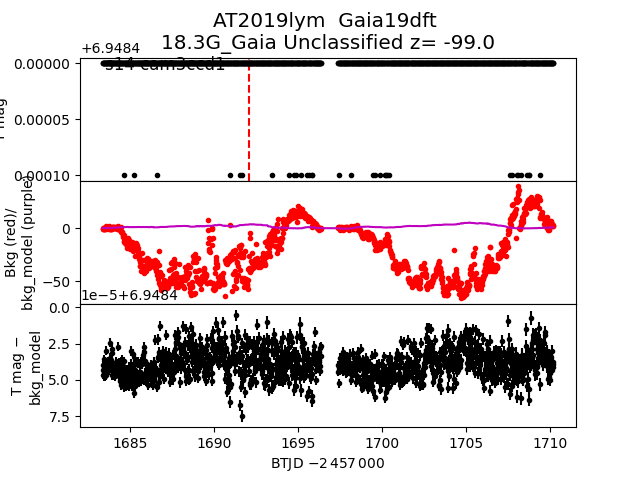
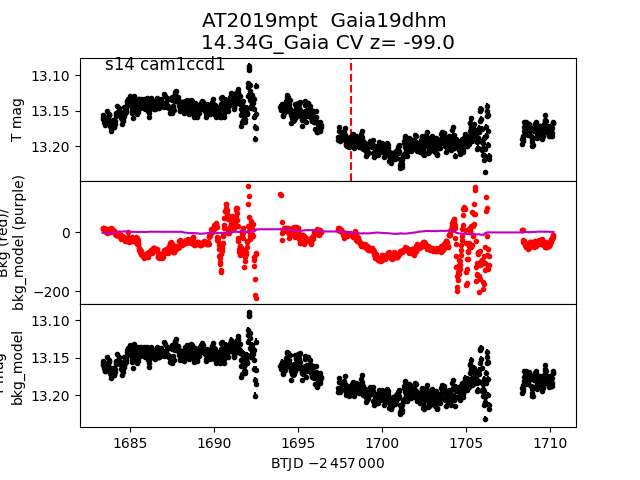
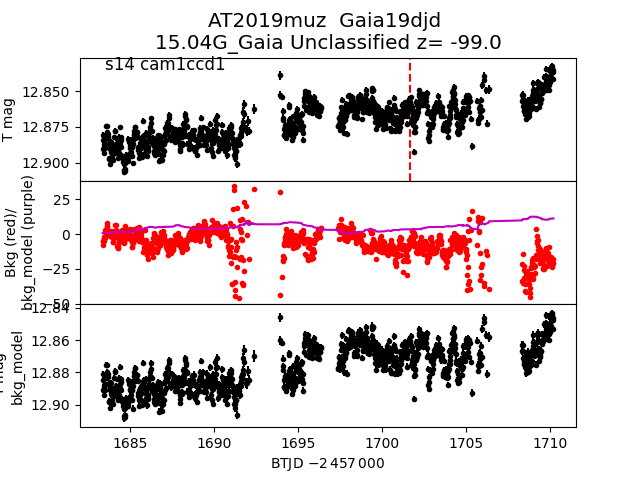
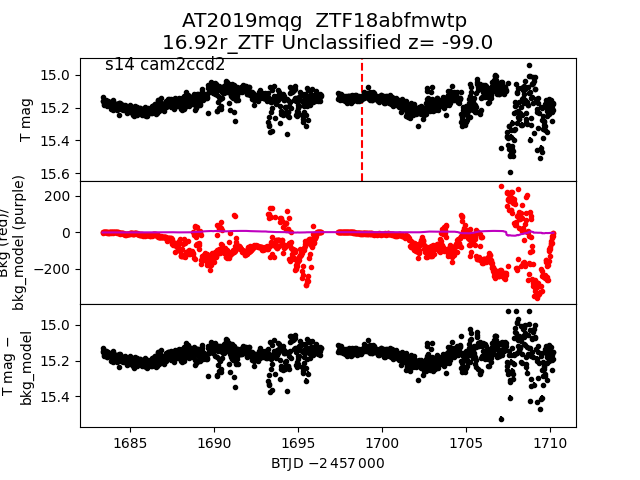
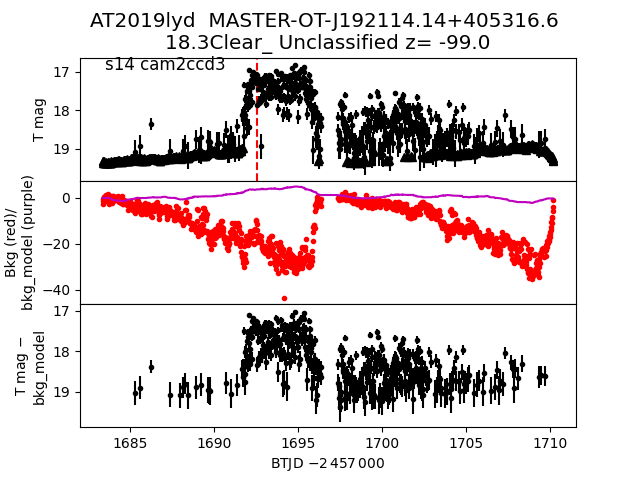
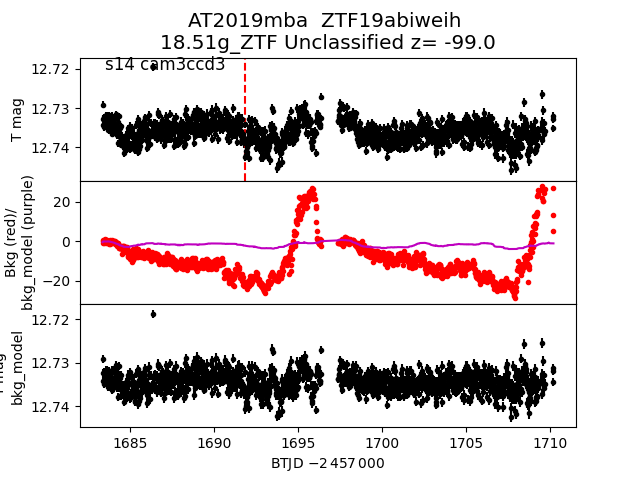
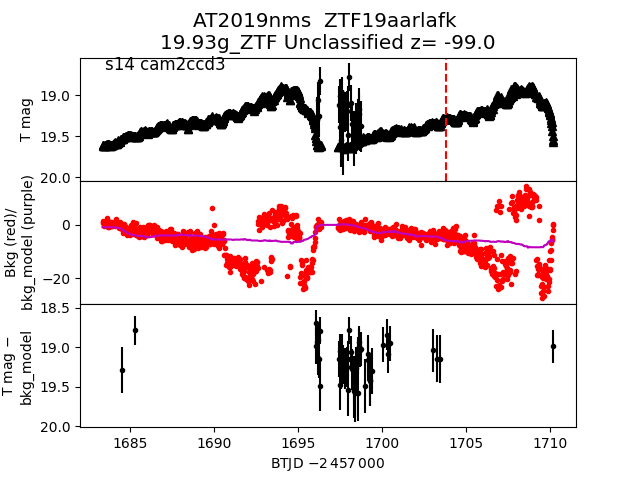
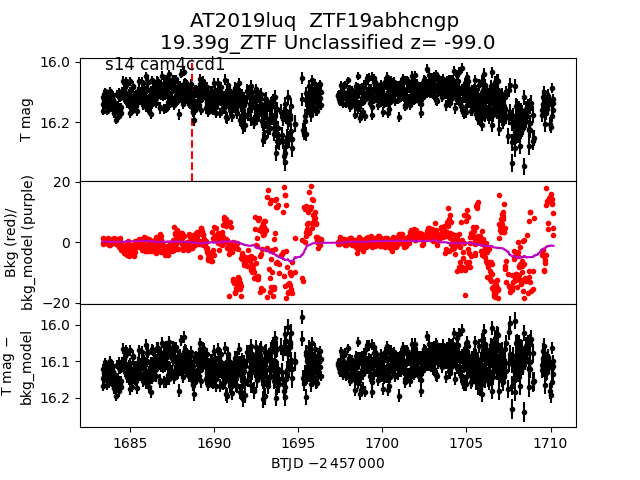
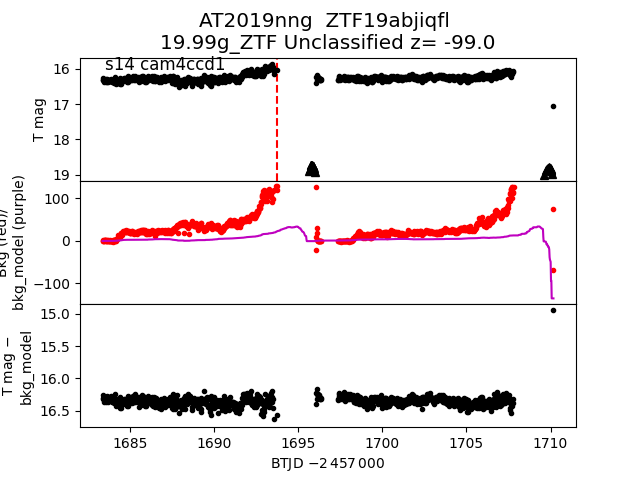
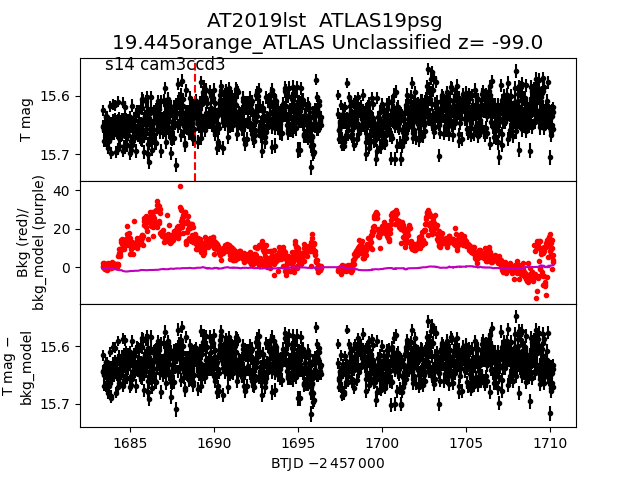
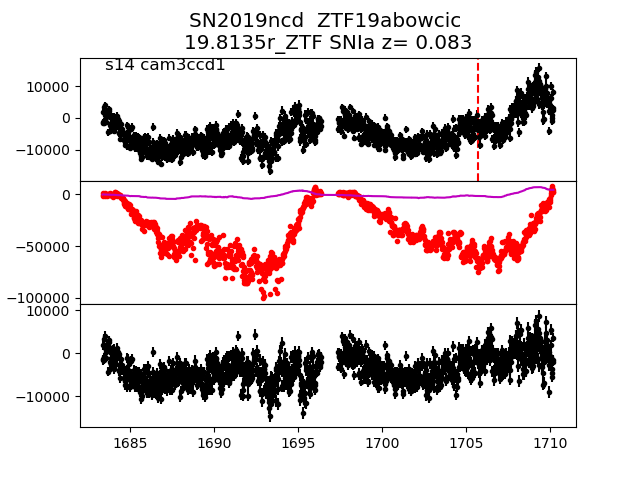
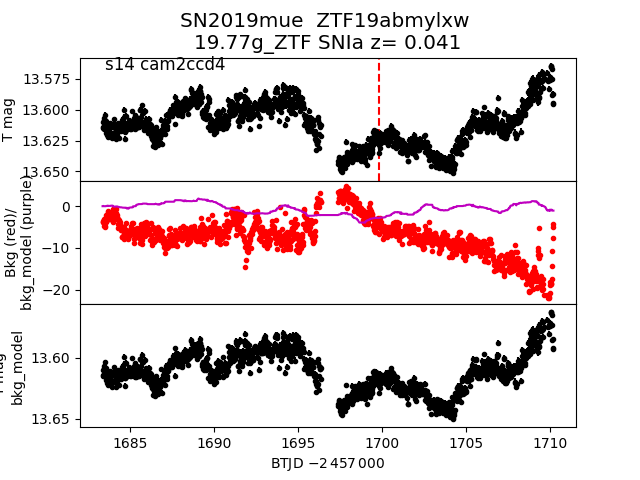
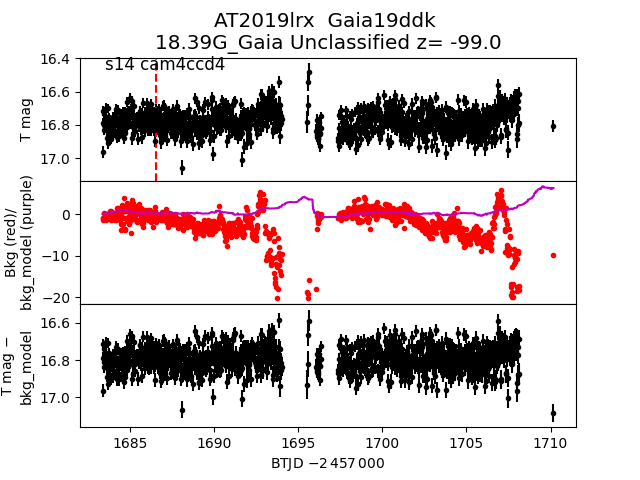
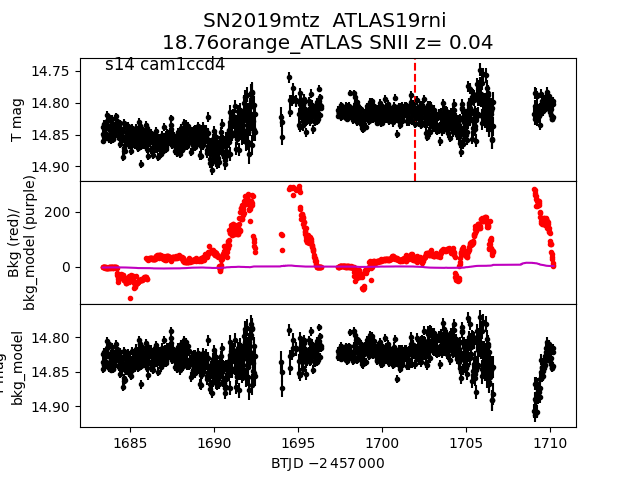
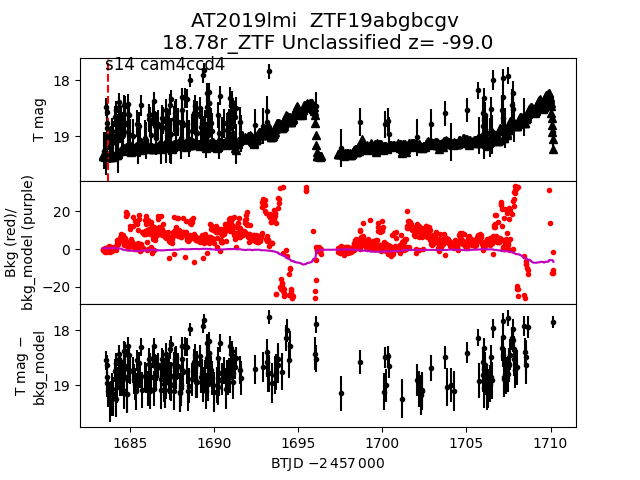
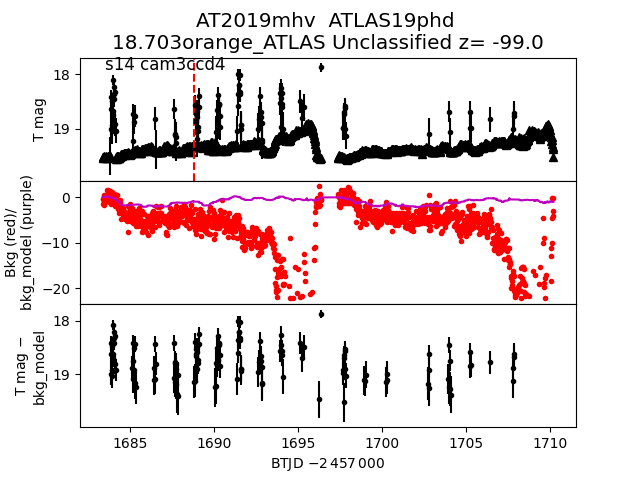
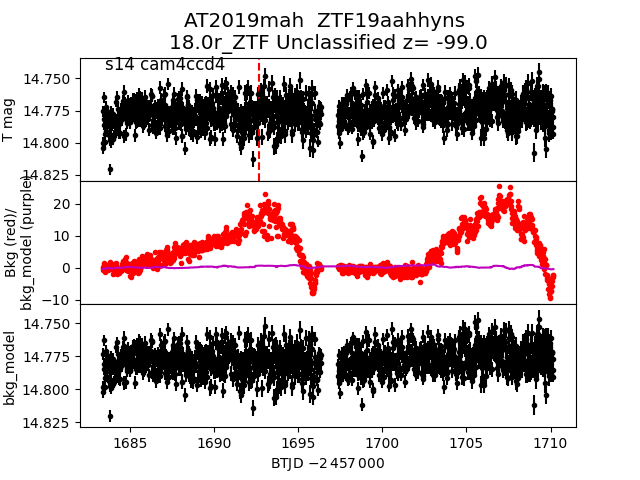
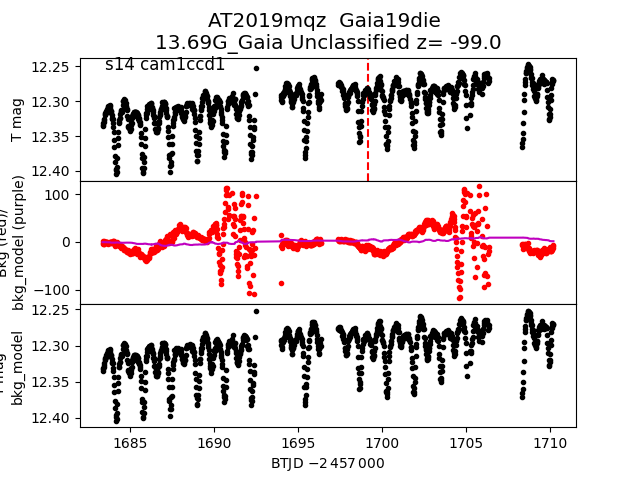
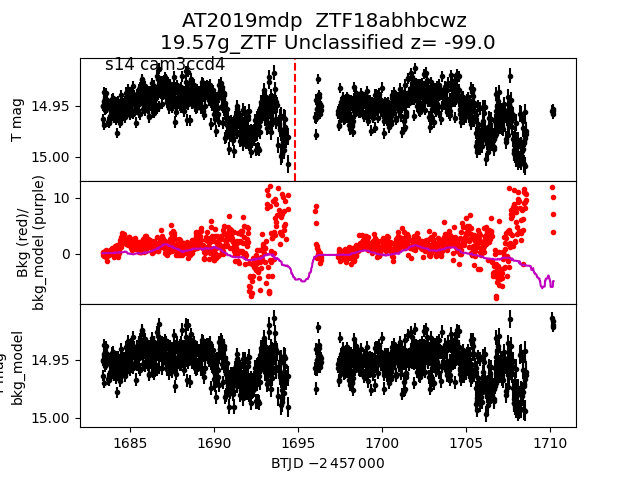
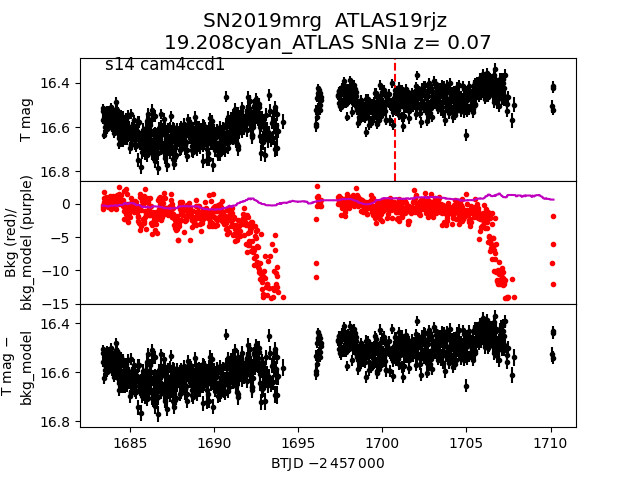
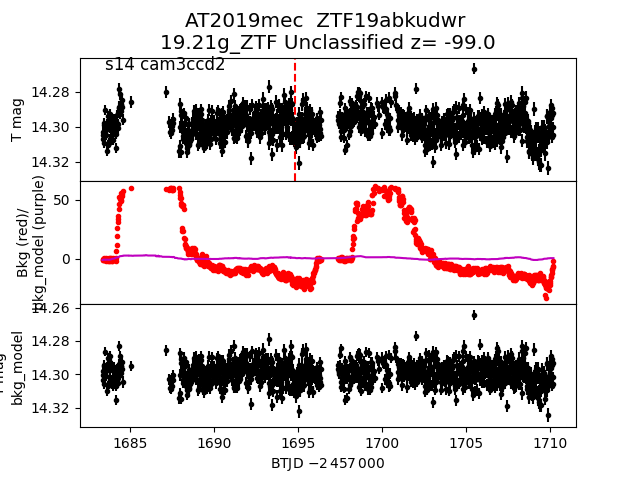
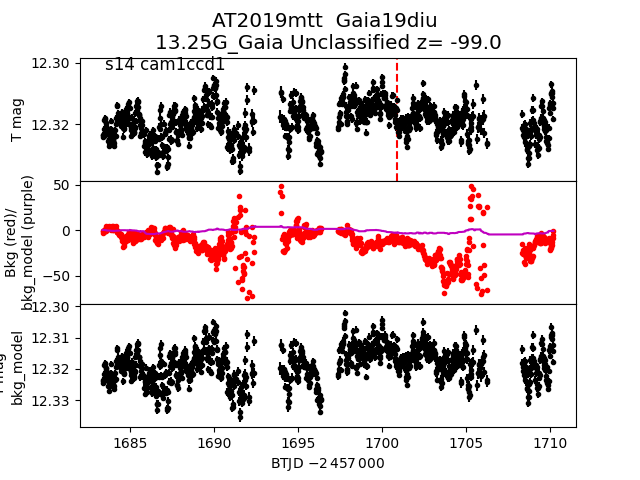
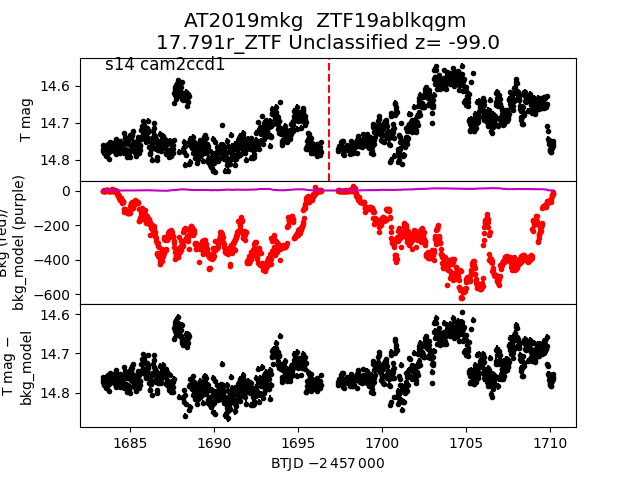
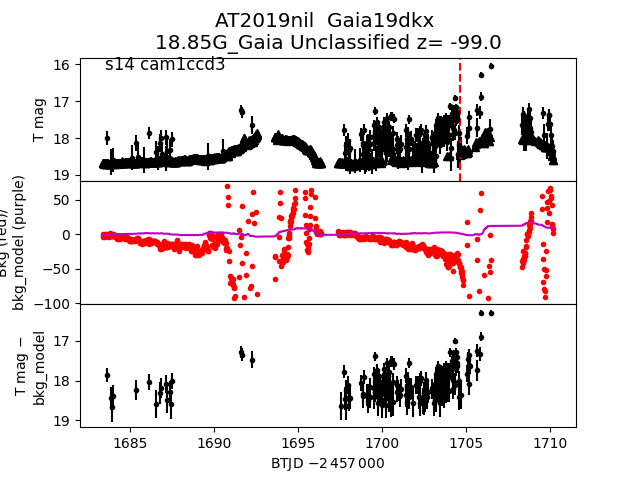
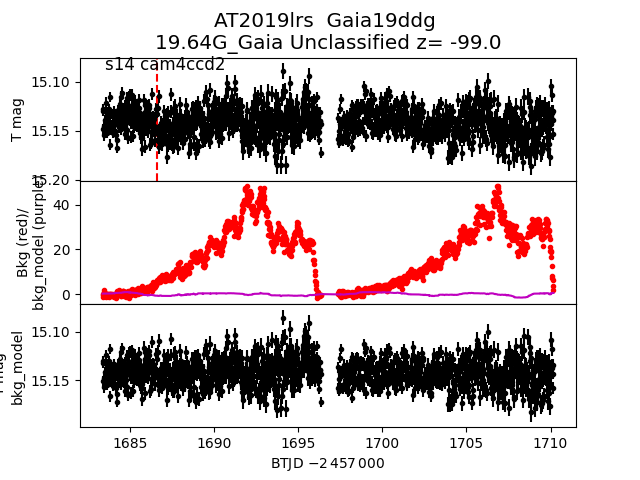
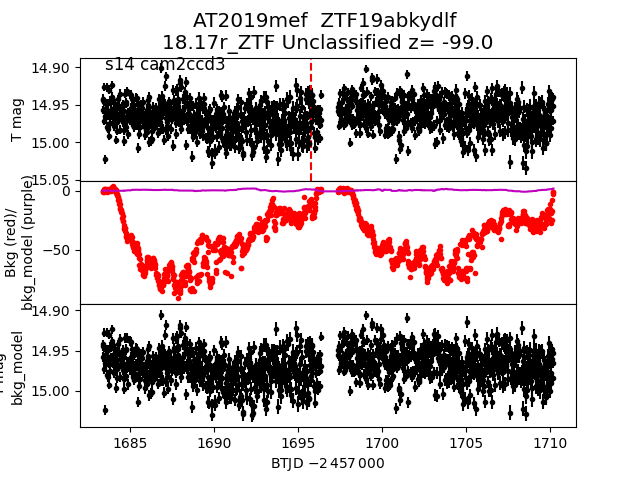
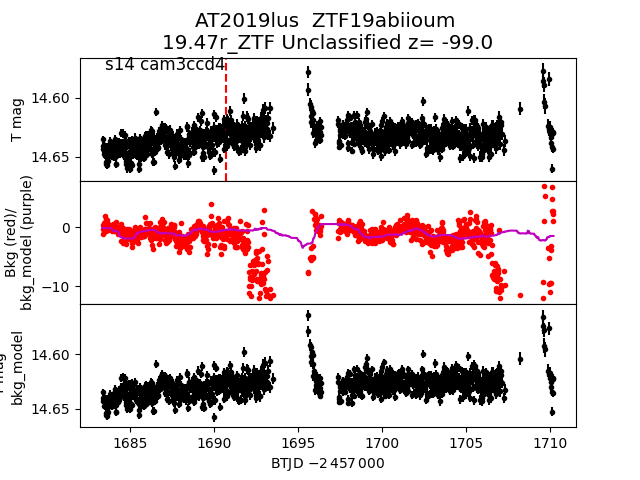
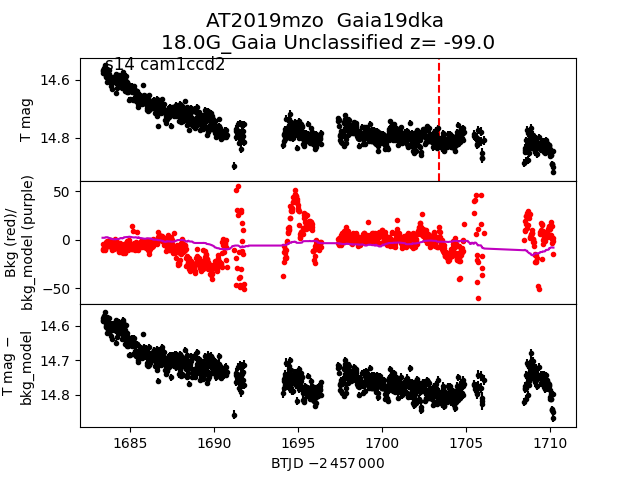
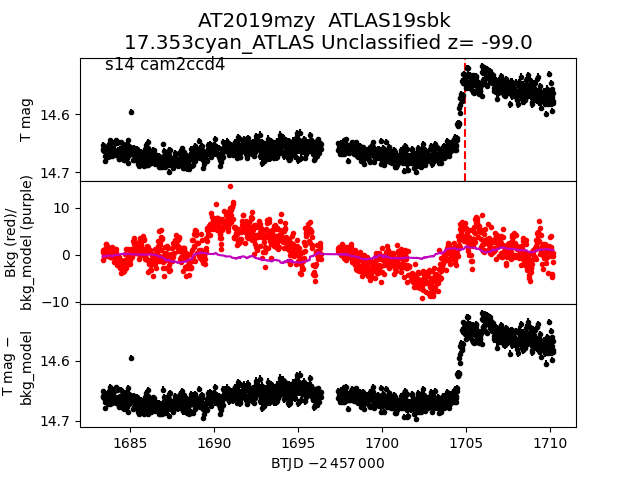
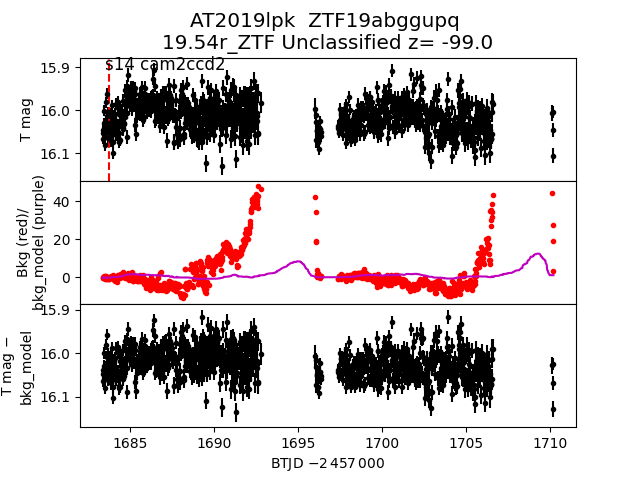
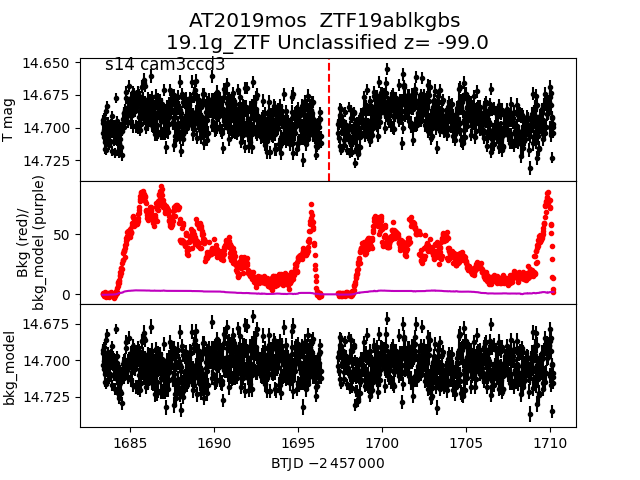
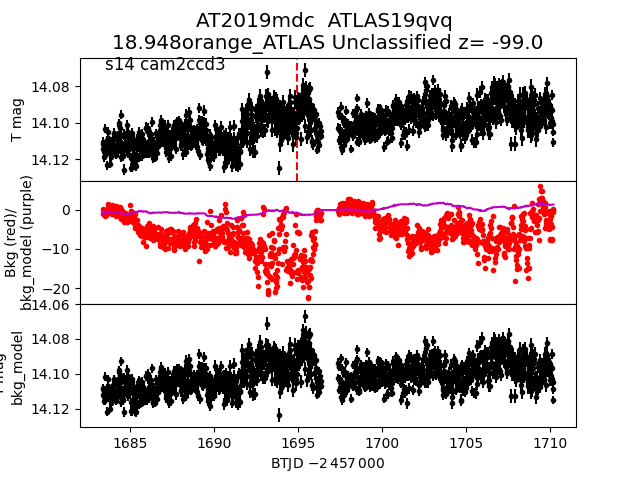
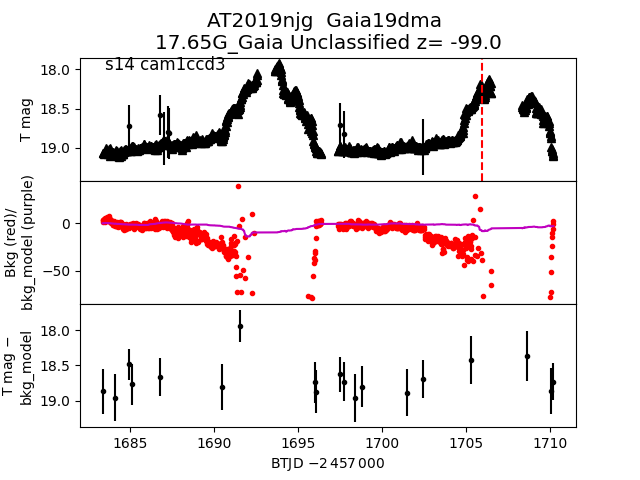
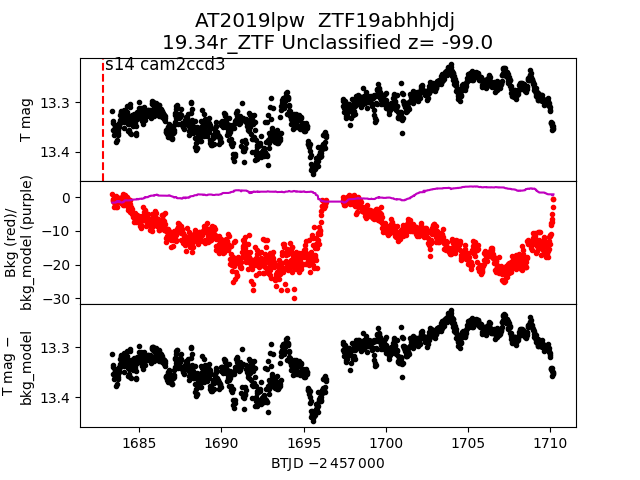
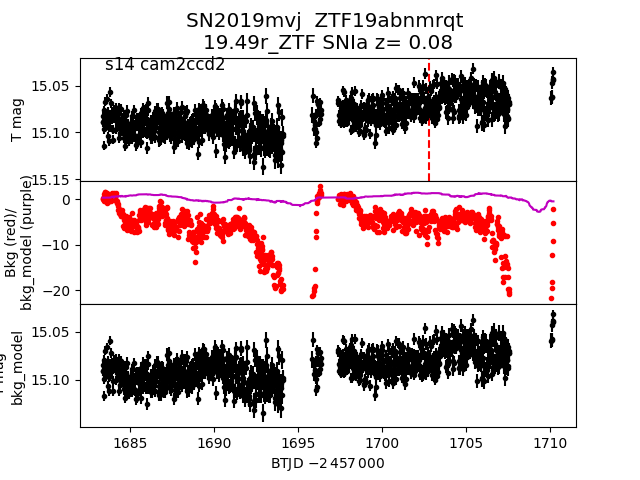
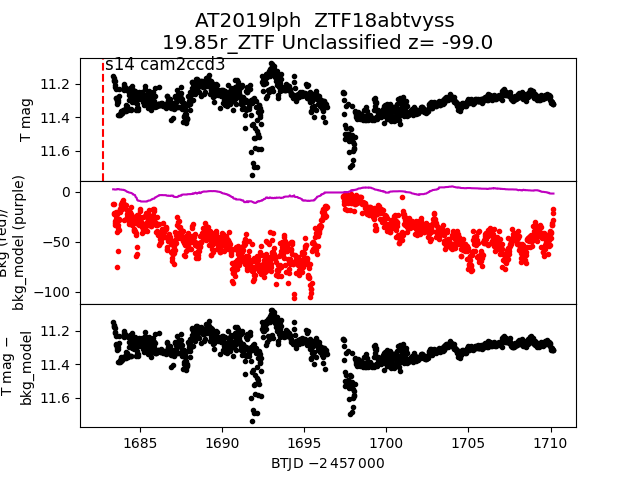
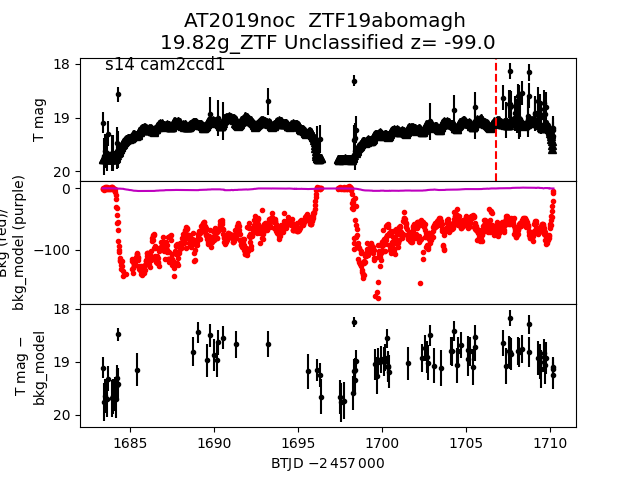
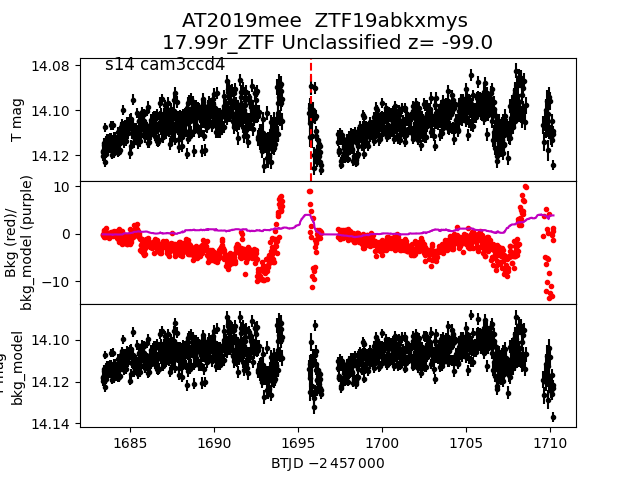
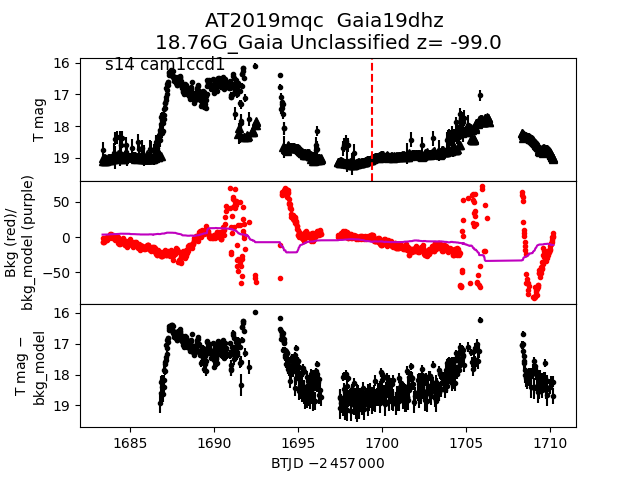
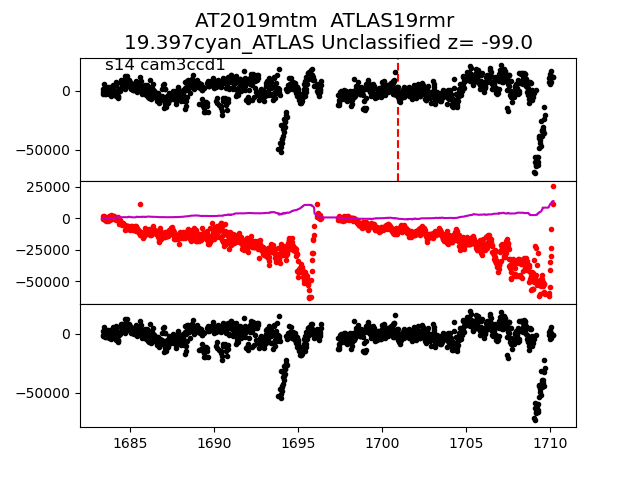
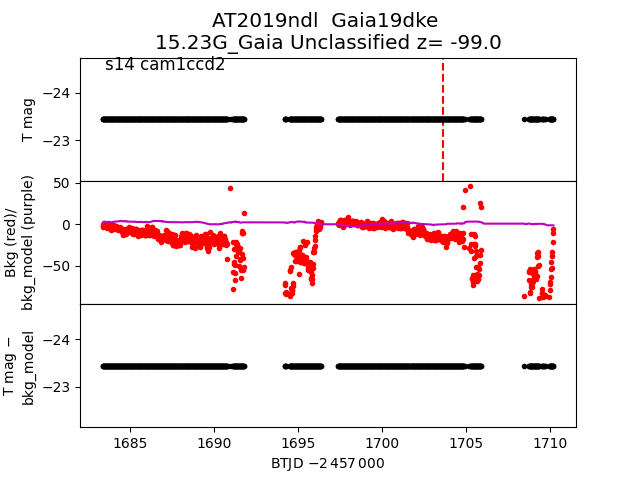
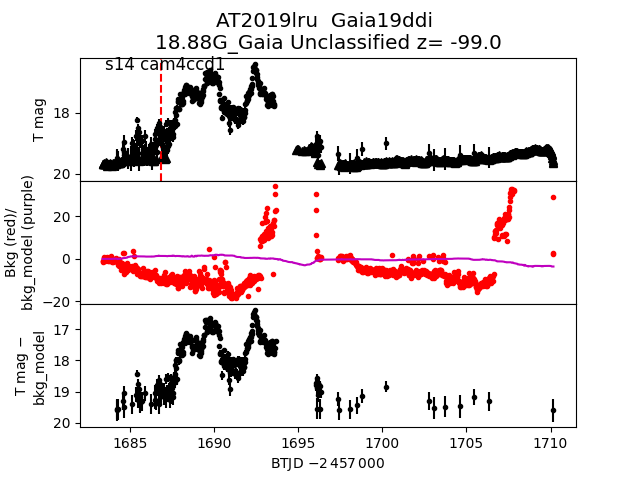
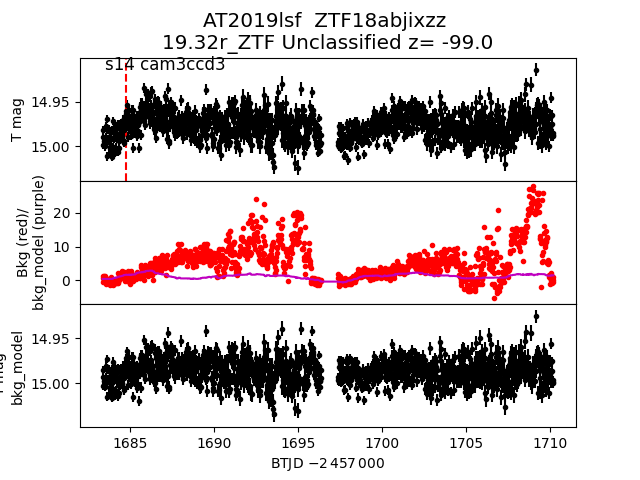
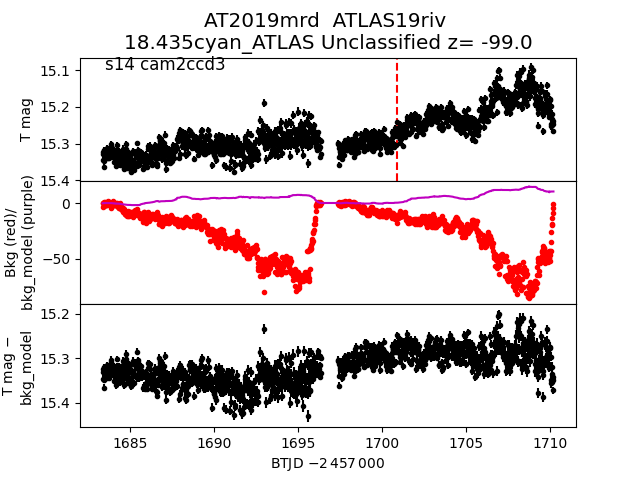
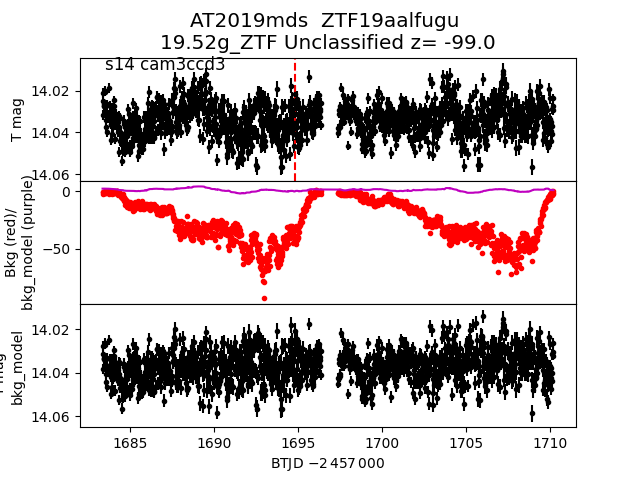
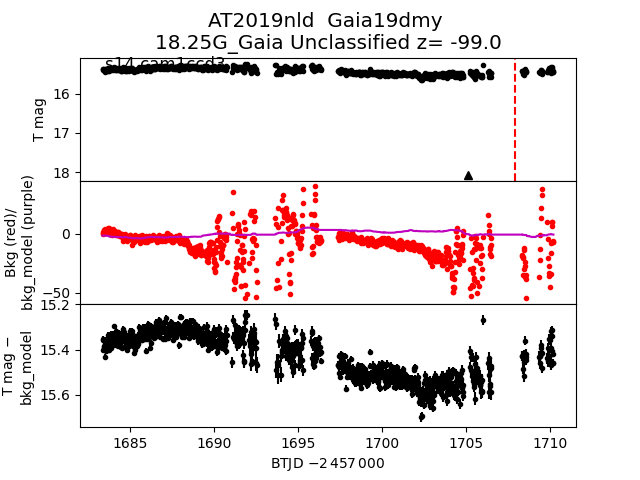
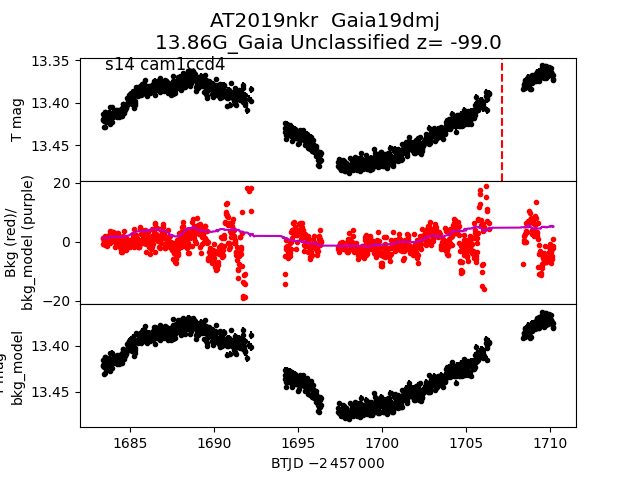
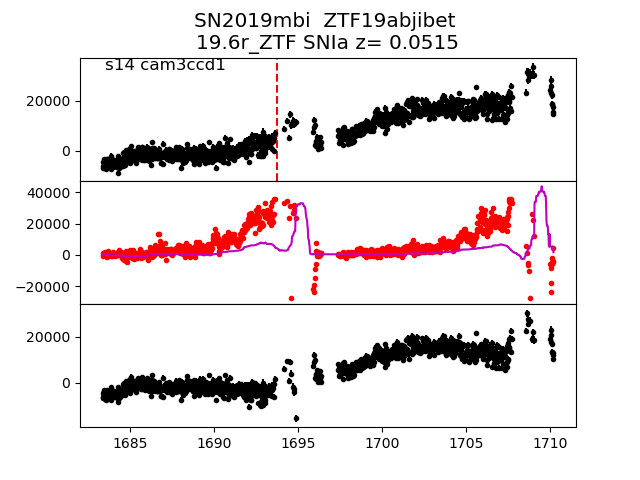
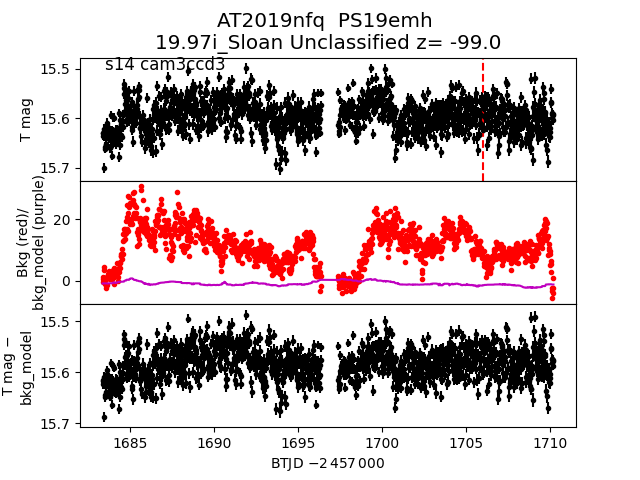
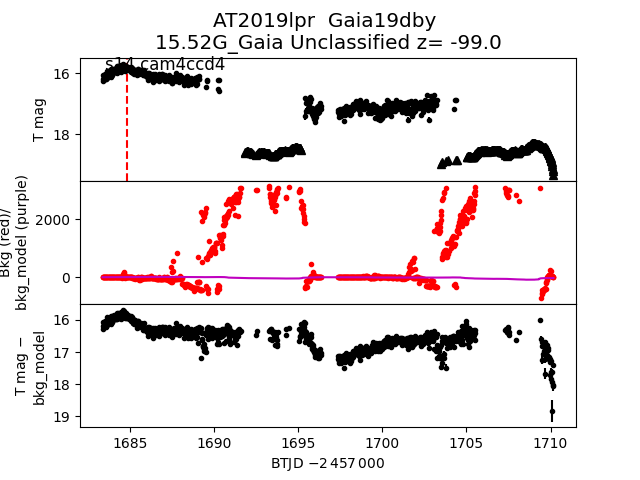
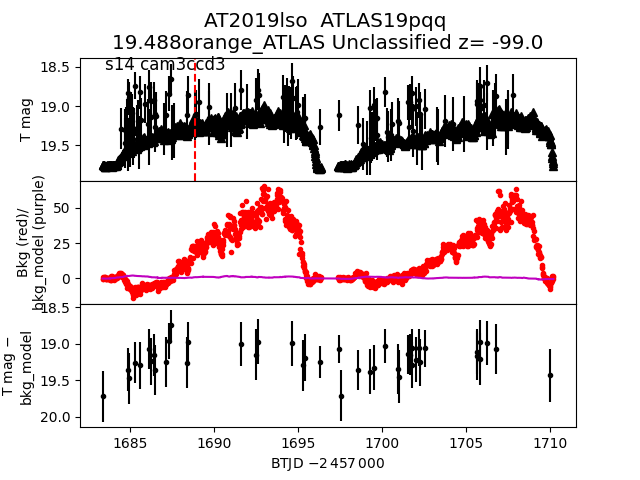
Each figure has three panels. The top panel shows the transient light curve, the middle panel shows the local background (estimated in an annulus), and the bottom panel shows a "background-model corrected" light curve. Details about the background model are in the README.
The vertical red line marks the time of discovery reported to TNS. Other useful metadata from TNS is in the figure title.
Note that the top and bottom panel are in magnitudes, while the middle panel is in differential flux units. The magnitudes are calibrated to the flux in the reference image used for image subtraction. Thus, flux from the host galaxy is included in these magnitudes.
3-sigma upper limits are plotted as triangles with no errorbars. A typical limiting magnitude is 19.6 in 30 minutes or 18.4 in 200 seconds (for low backgrounds).
The links allow you to download the light curve data as a text file.
More details in the README.
2019men
 2019nfv
 2019njy
 2019muu
 2019maz
 2019meg
 2019lqo
 2019ofn
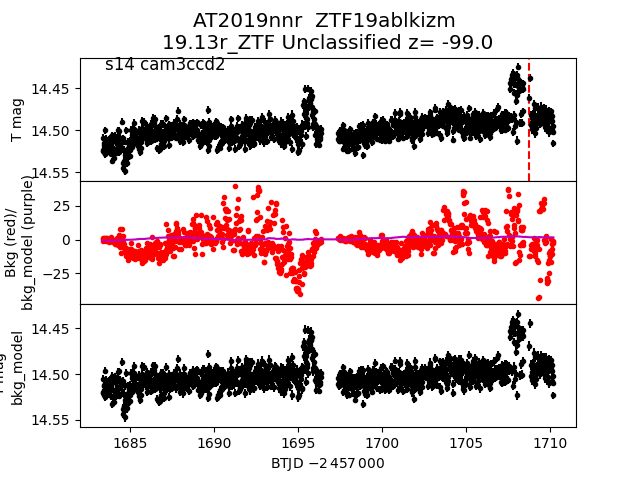
 2019nnr
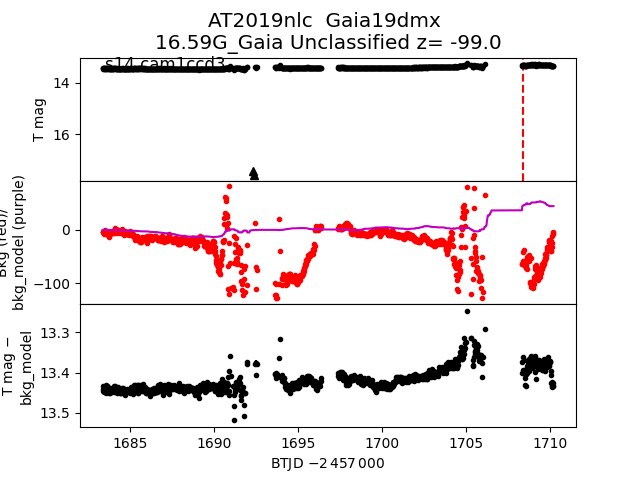
 2019nlc
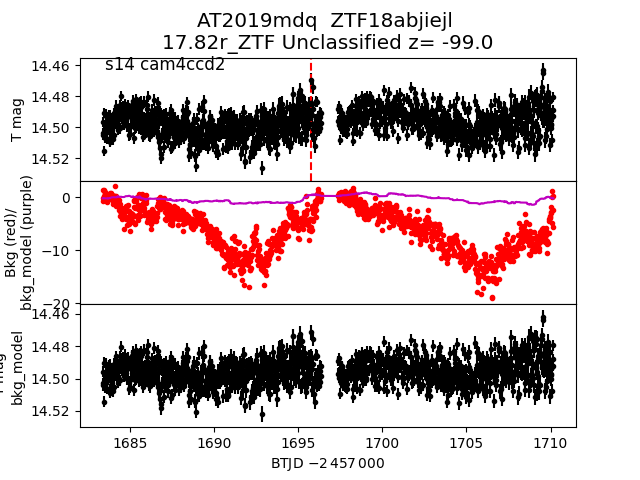
 2019mdq
 2019mrf
 2019muf
 2019meb
 2019lpf
 2019oft
 2019mim
 2019mku
 2019lym
 2019mpt
 2019muz
 2019mqg
 2019lyd
 2019mba
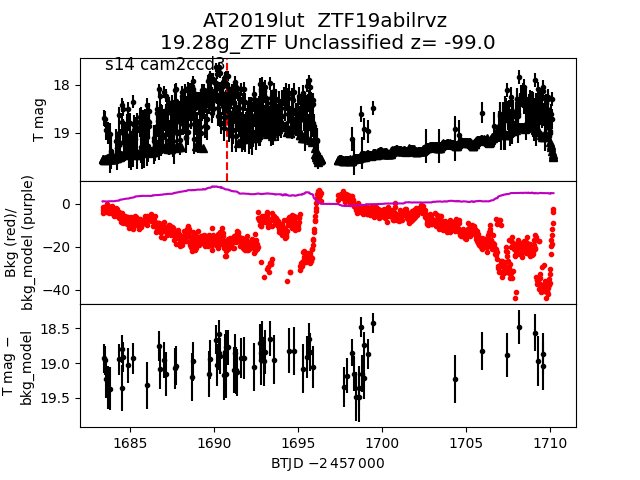
 2019lut
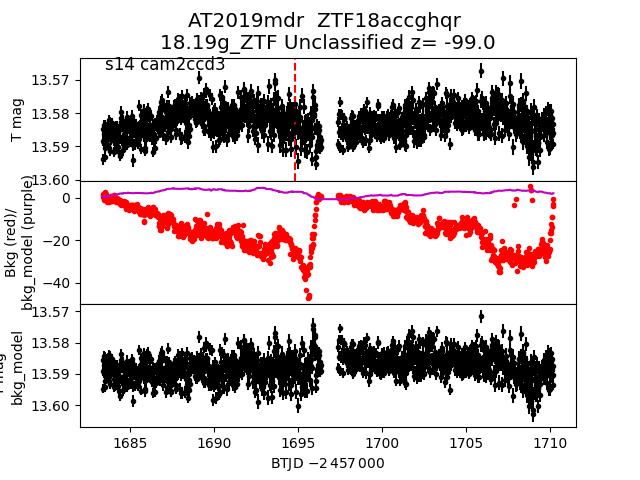
 2019mdr
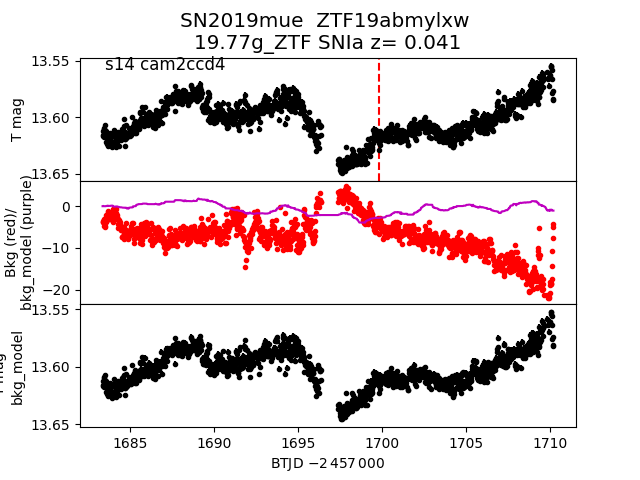
 2019mue
 2019nms
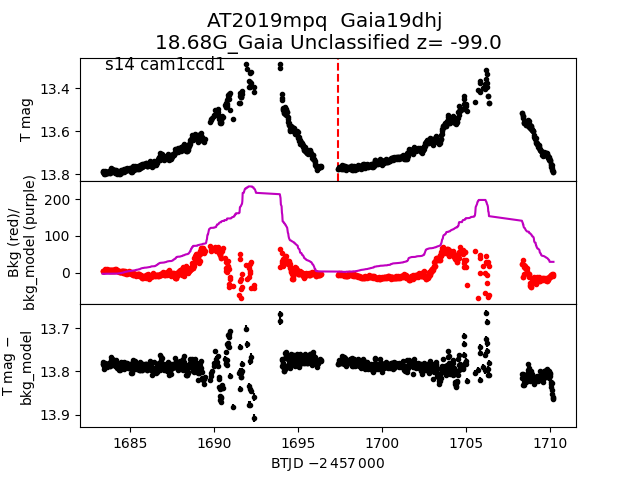
 2019mpq
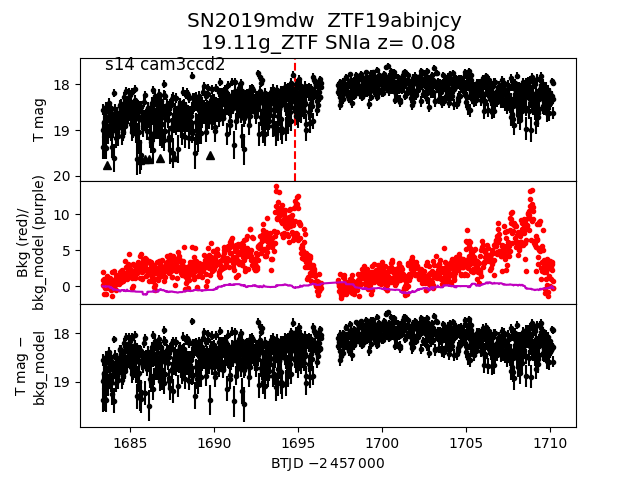
 2019mdw
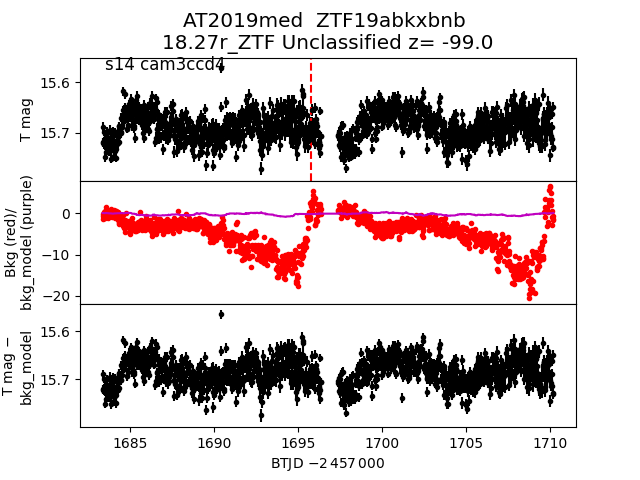
 2019med
 2019luq
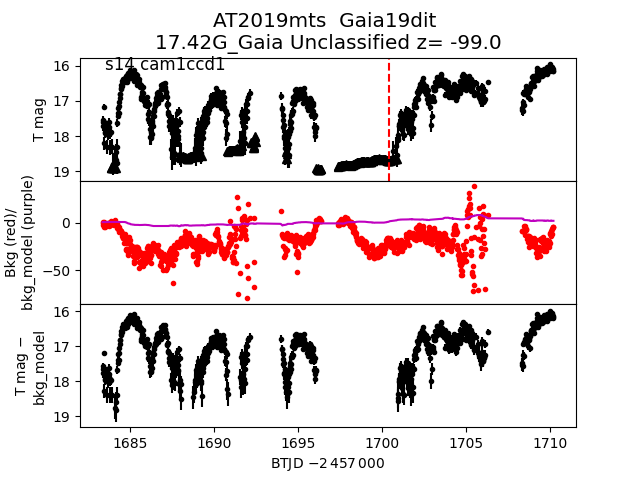
 2019mts
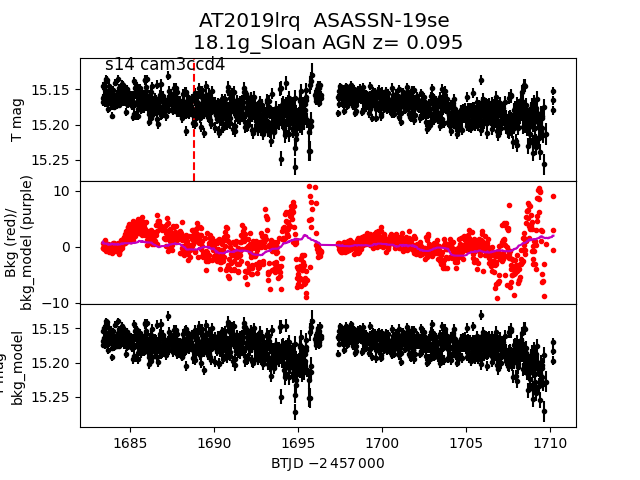
 2019lrq
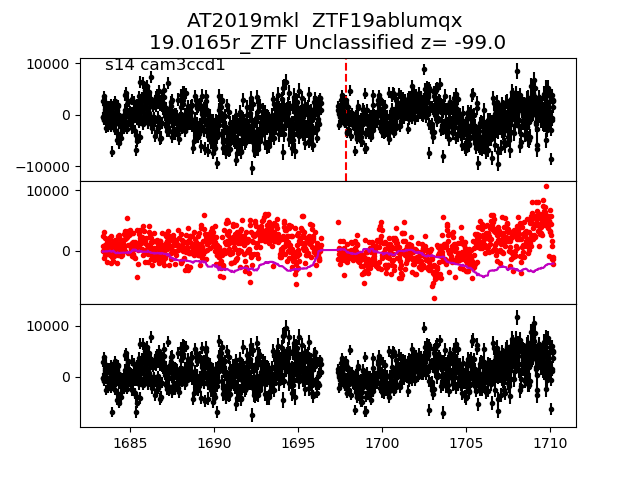
 2019mkl
 2019nng
 2019lst
 2019ncd
 2019mue_detrended
 2019lrx
 2019mtz
 2019lmi
 2019mhv
 2019mah
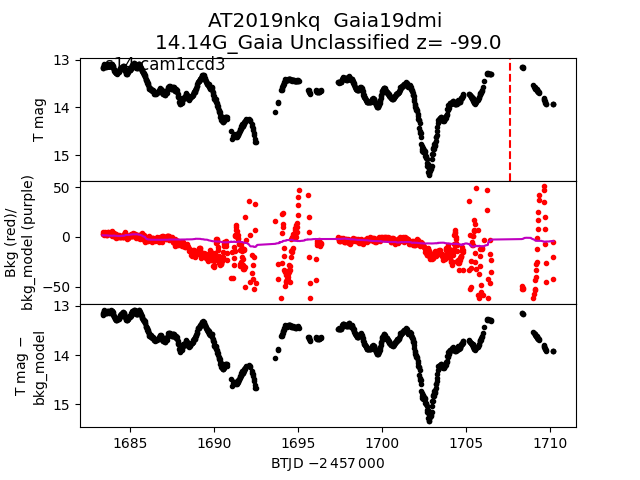
 2019nkq
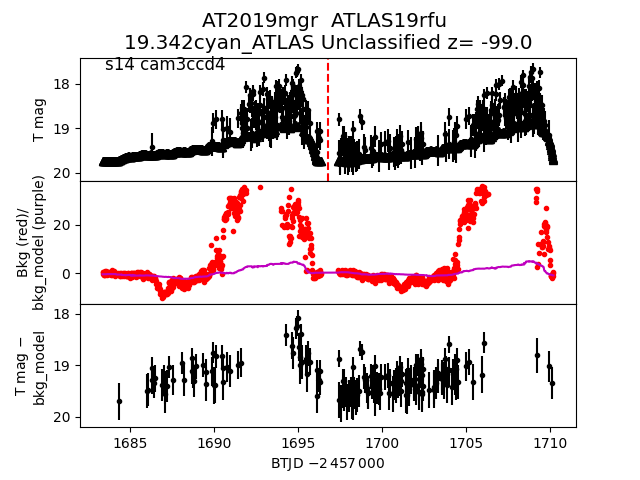
 2019mgr
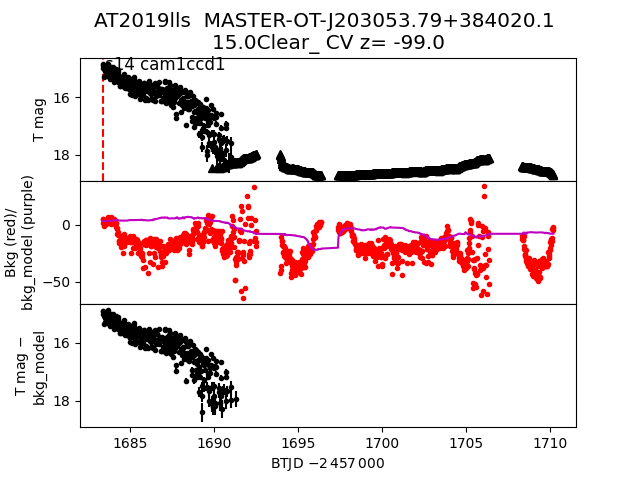
 2019lls
 2019mqz
 2019mdp
 2019mrg
 2019mec
 2019mtt
 2019mkg
 2019nil
 2019lrs
 2019mef
 2019lus
 2019mzo
 2019mzy
 2019lpk
 2019mos
 2019mdc
 2019njg
 2019lpw
 2019mvj
 2019lph
 2019noc
 2019mee
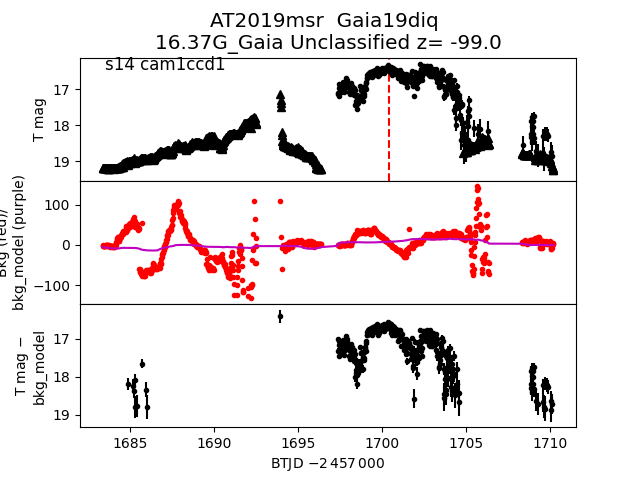
 2019msr
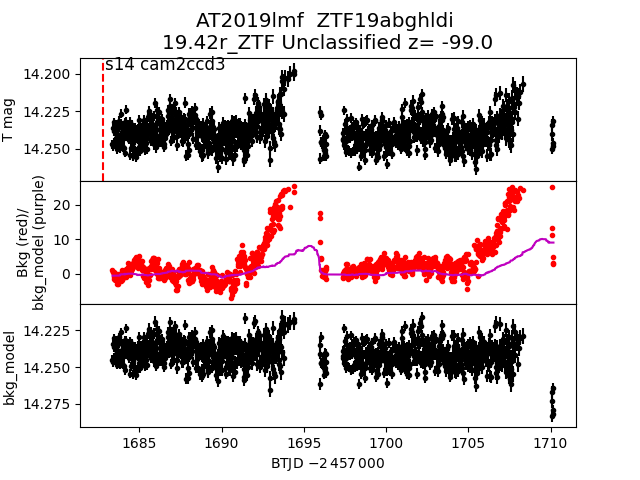
 2019lmf
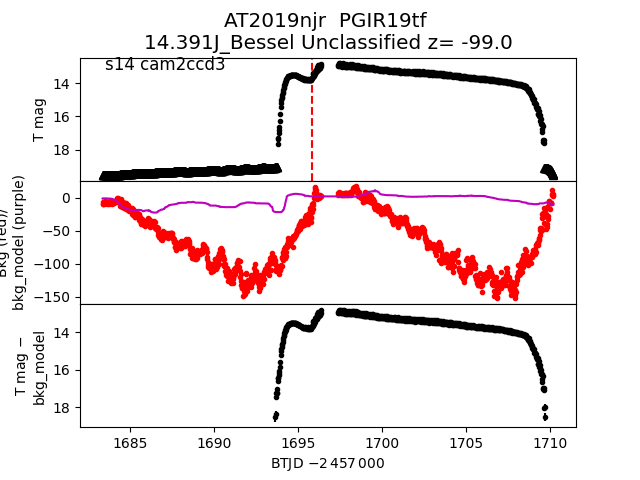
 2019njr
 2019mqc
 2019mtm
 2019ndl
 2019lru
 2019lsf
 2019mrd
 2019mds
 2019nld
 2019nkr
 2019mbi
 2019nfq
 2019lpr
 2019lso
 2019nvj