all transients in sector10 (42 total)
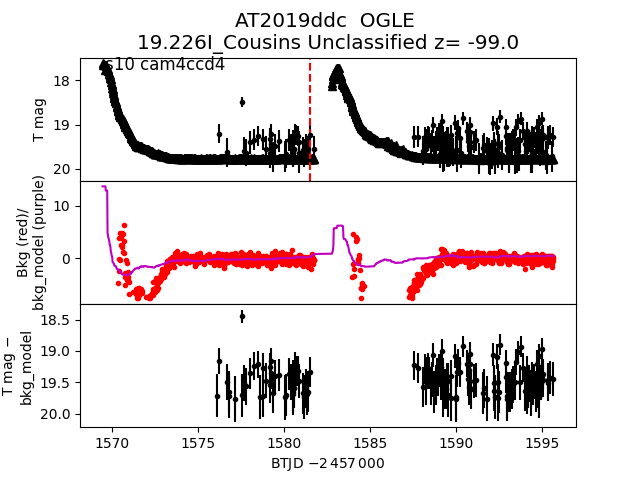
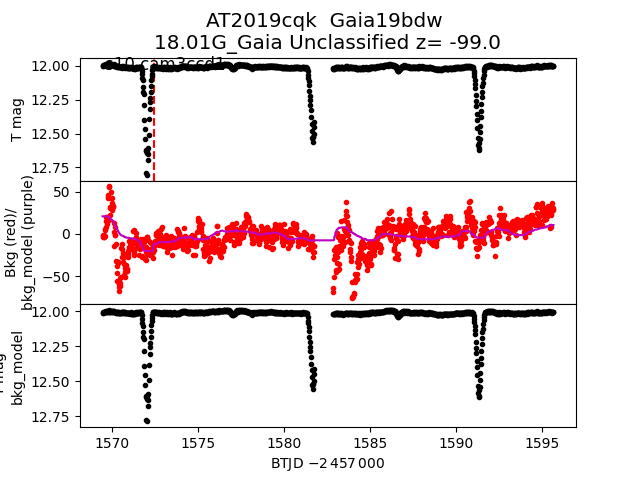
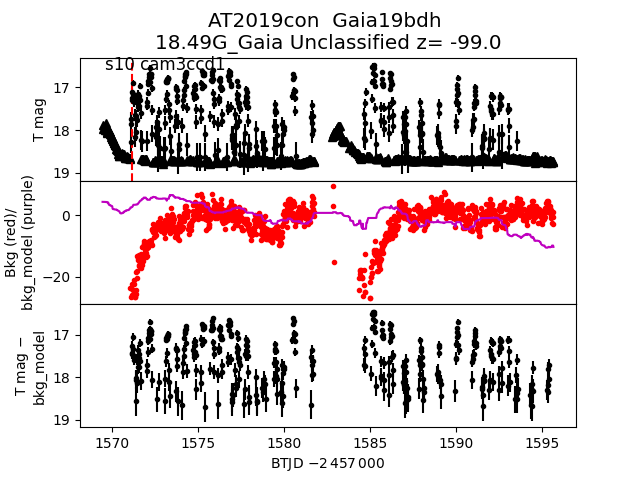
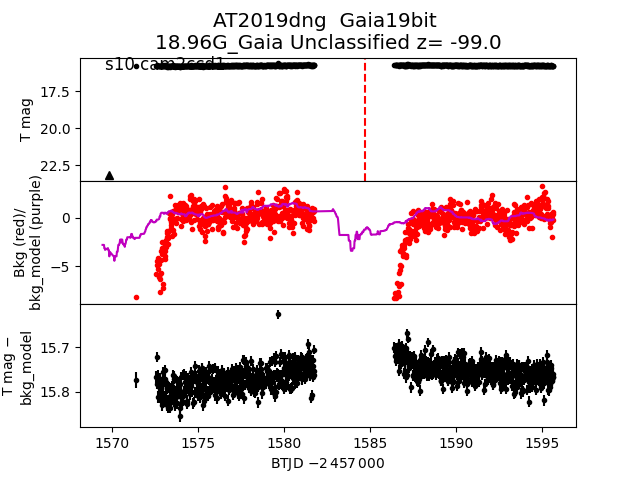
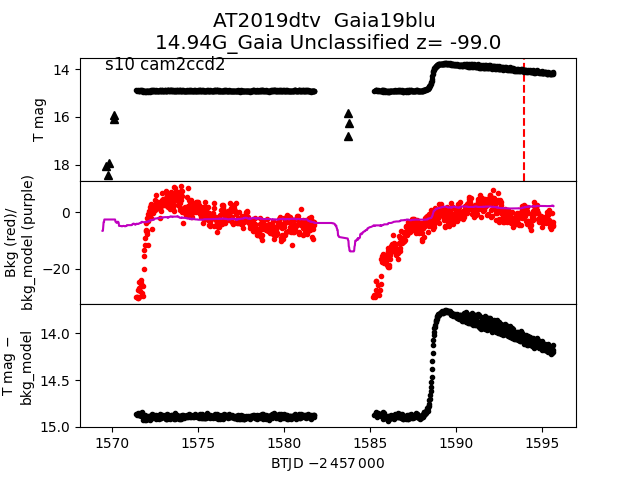
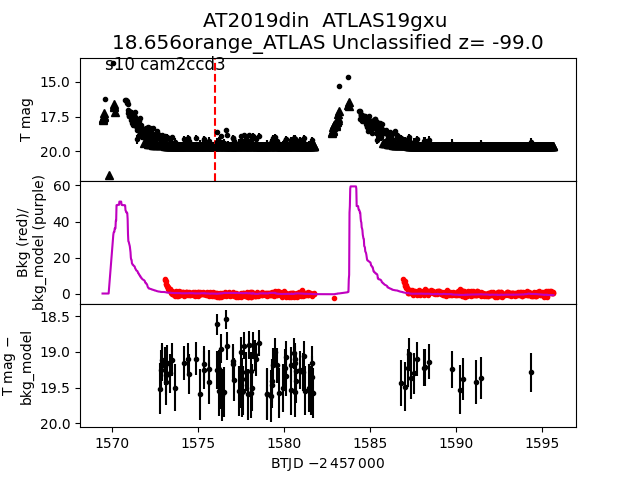
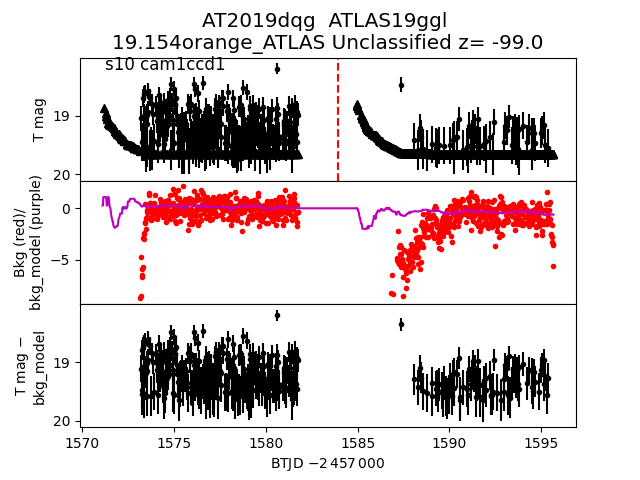
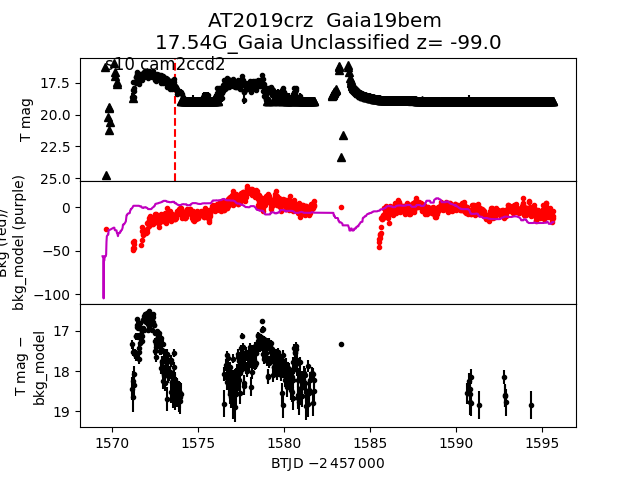
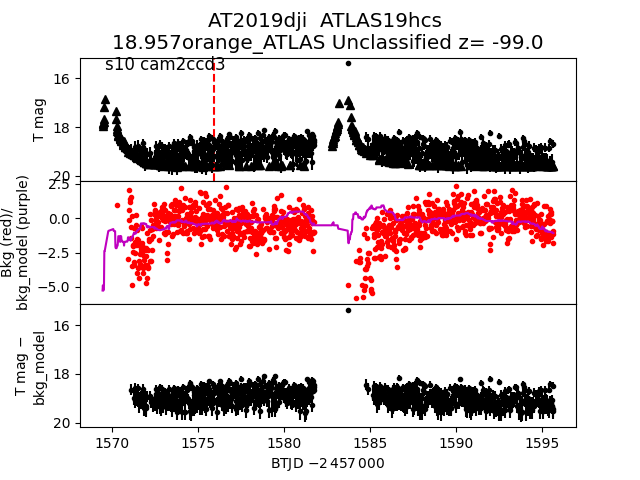
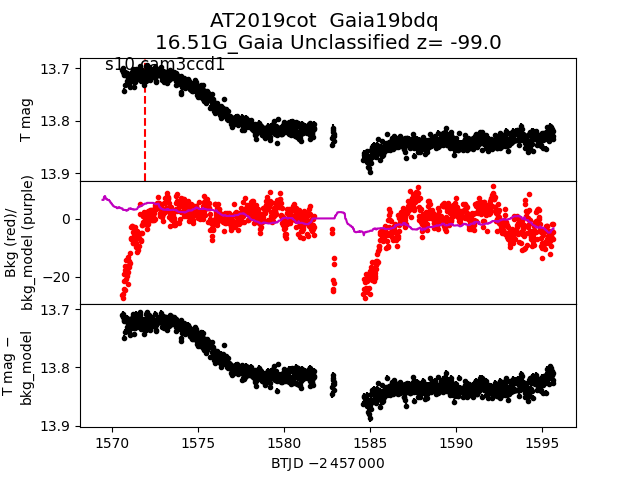
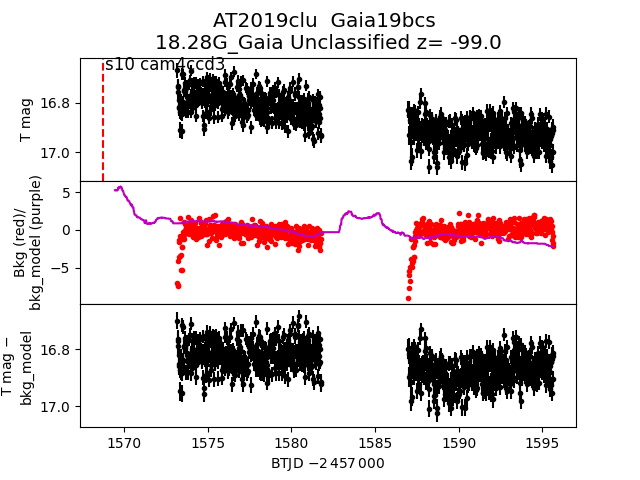
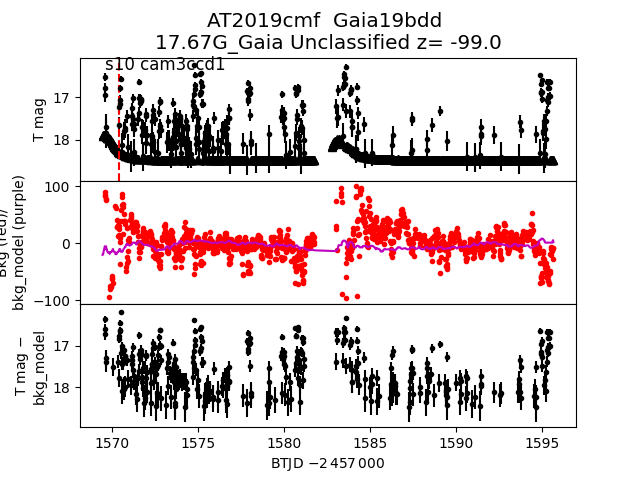
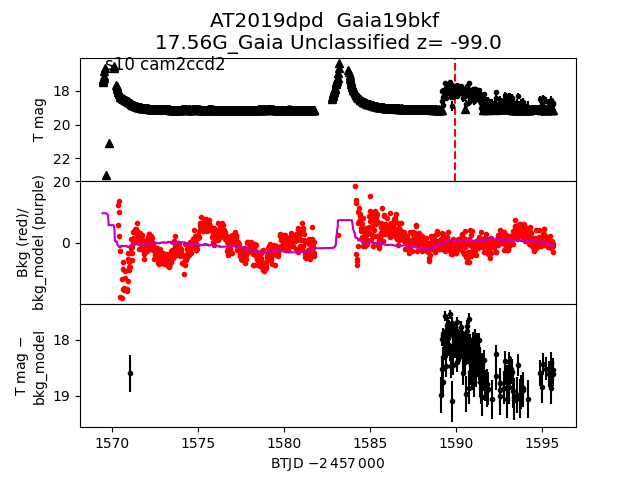
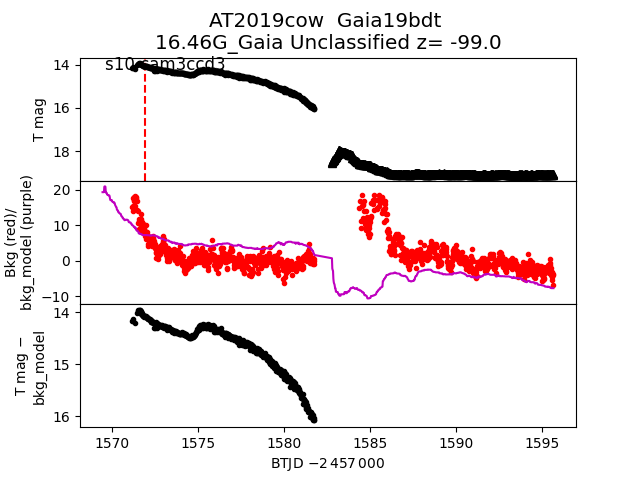
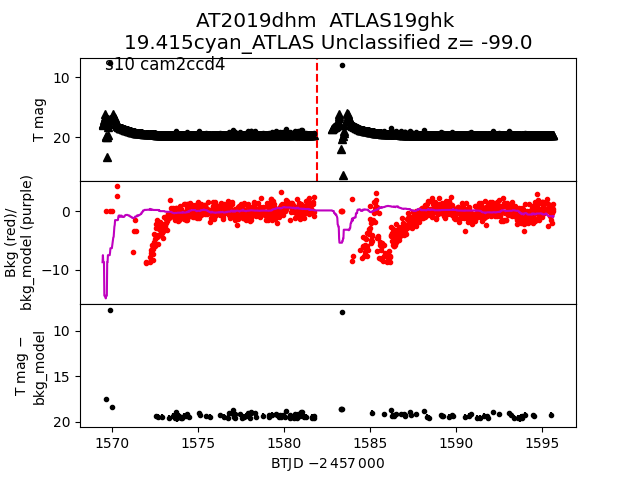
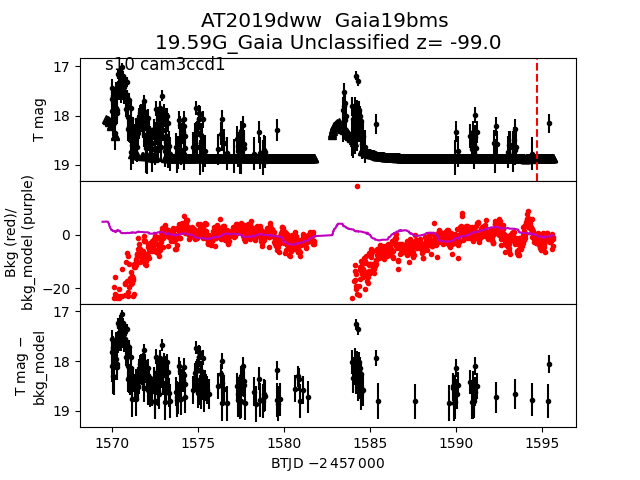
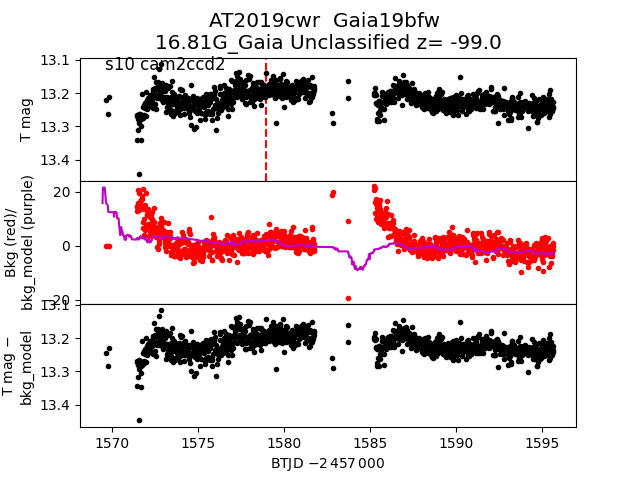
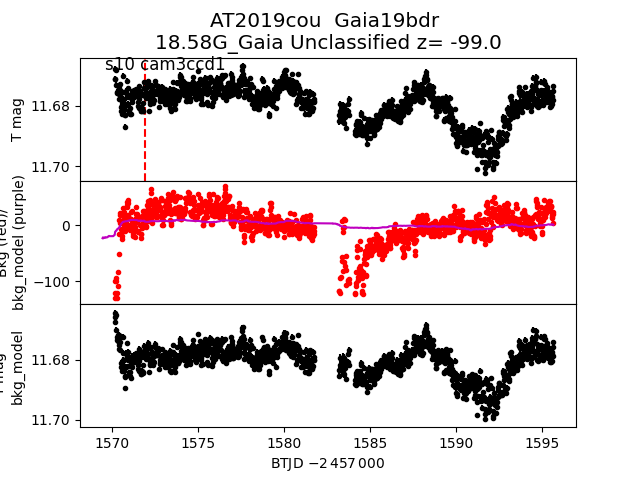
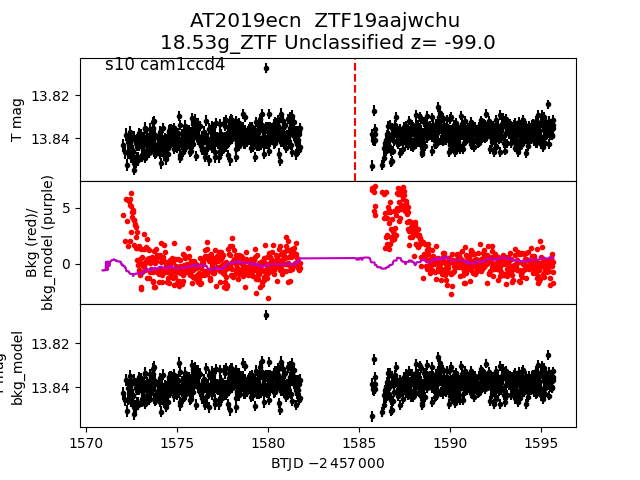
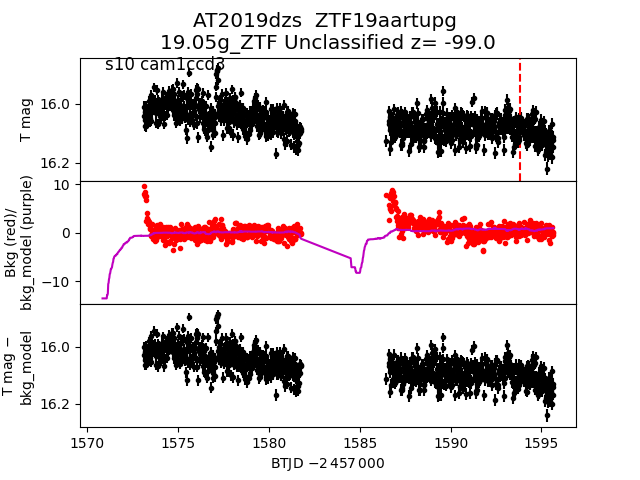
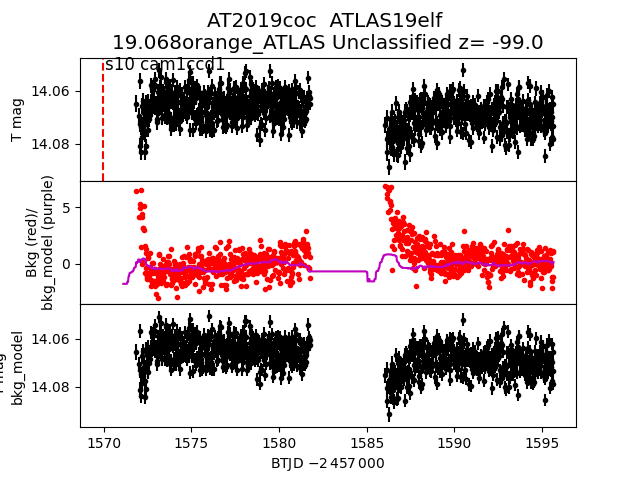
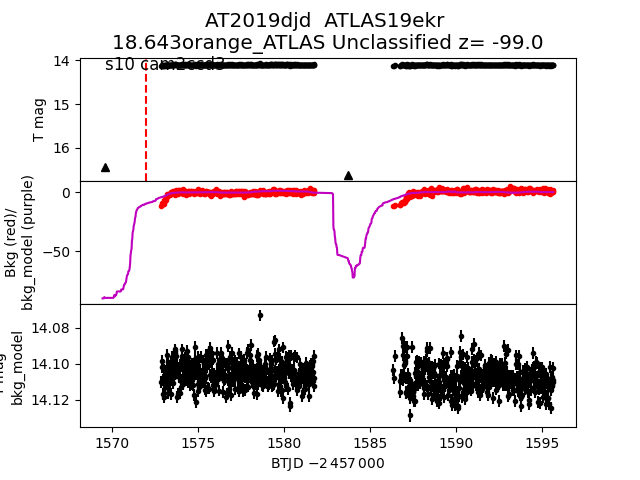
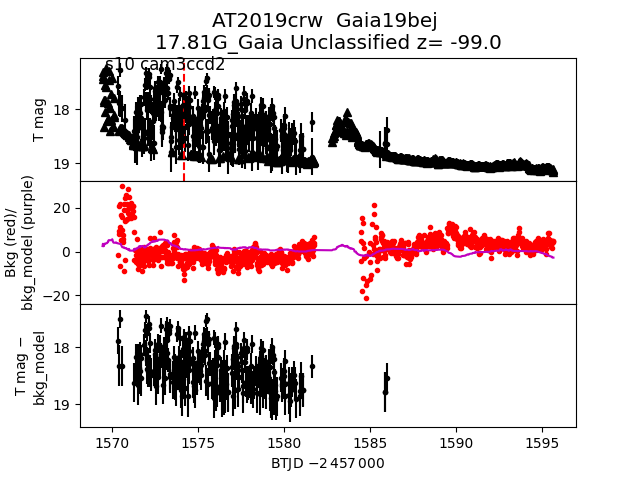
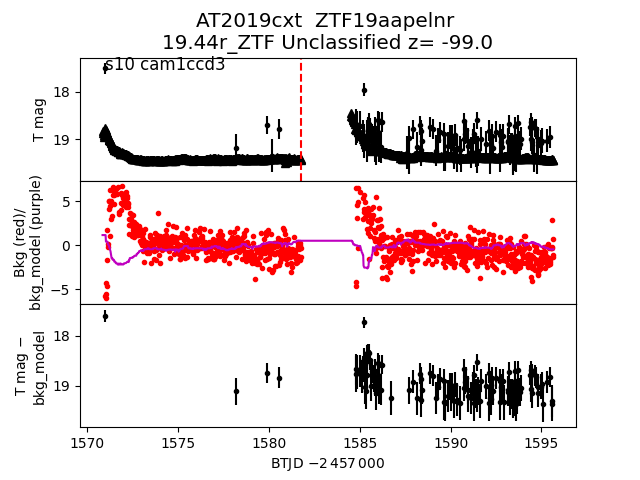
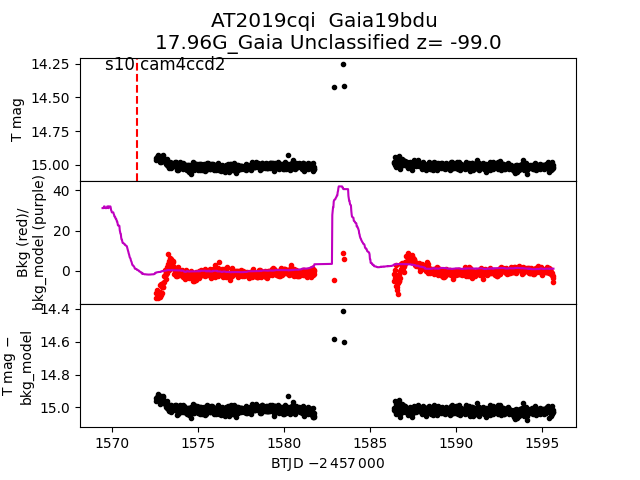
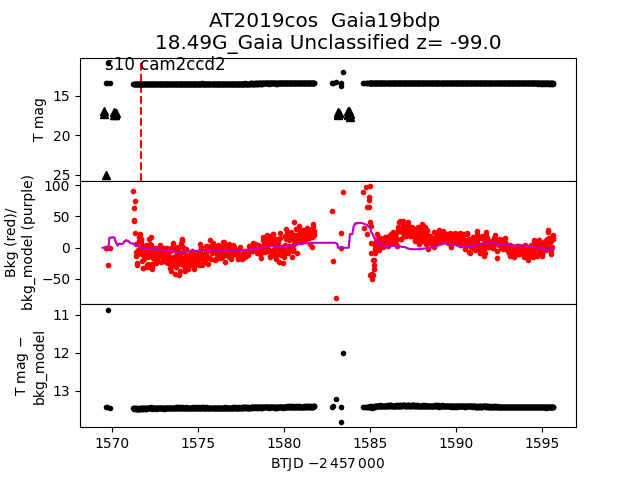
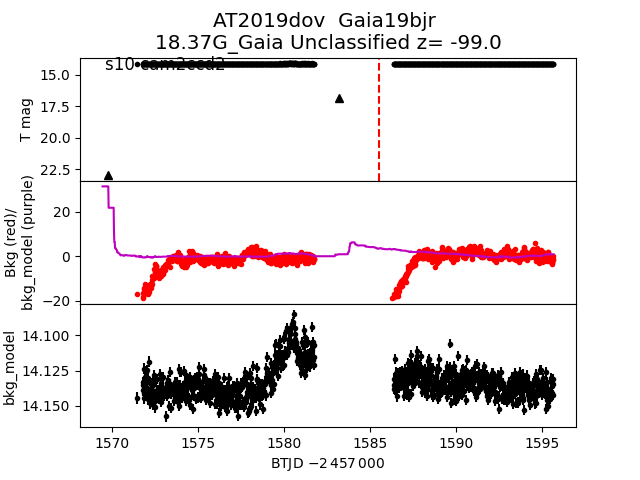
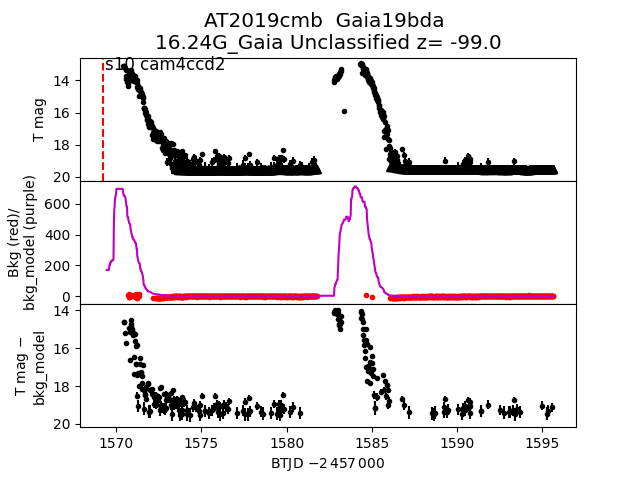
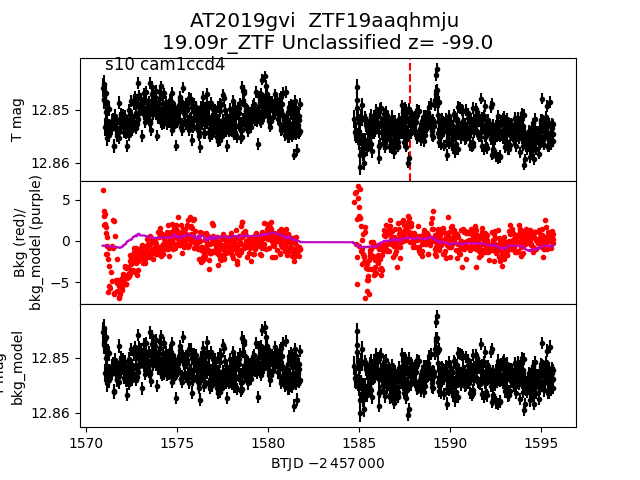
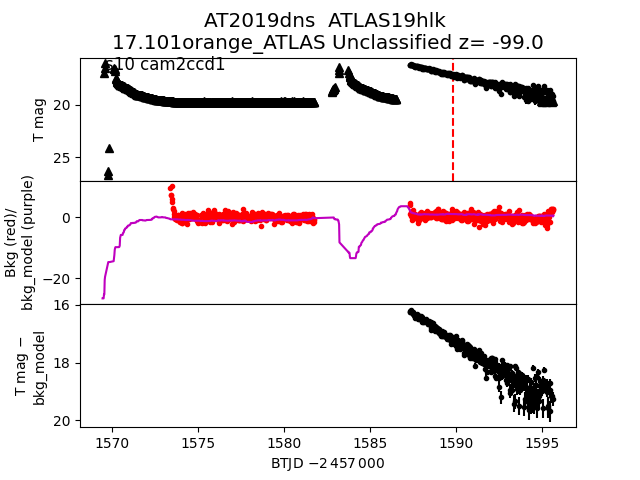
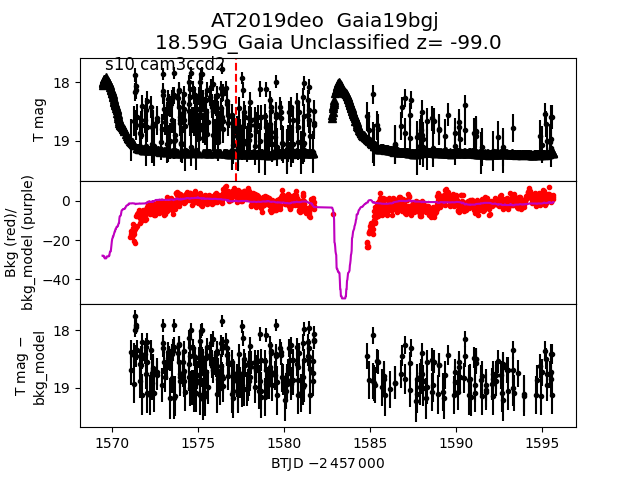
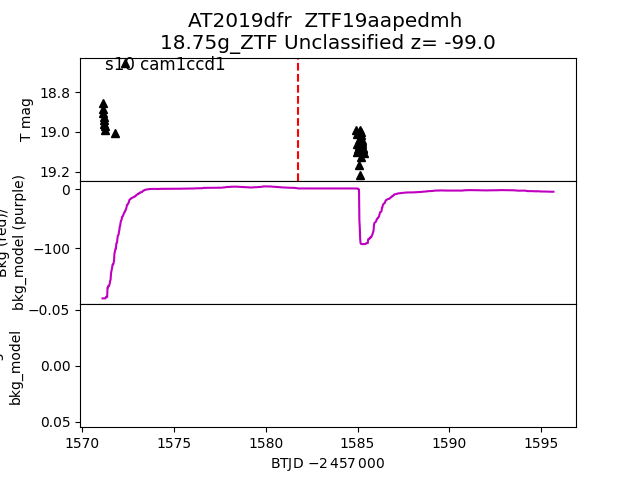
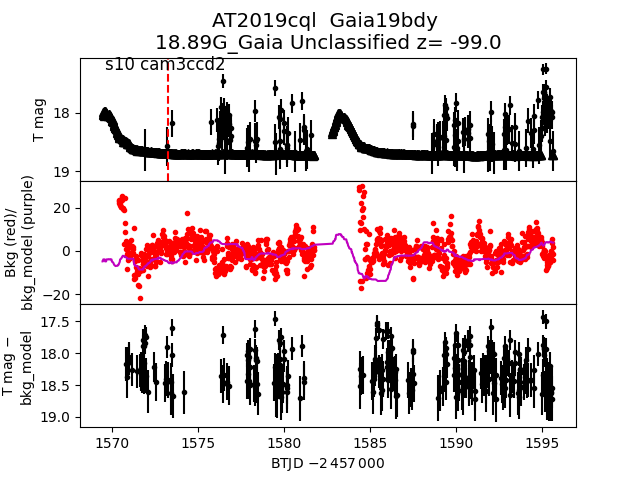
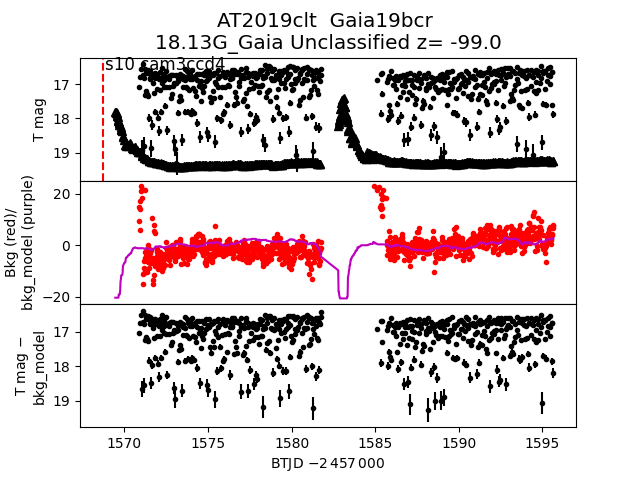
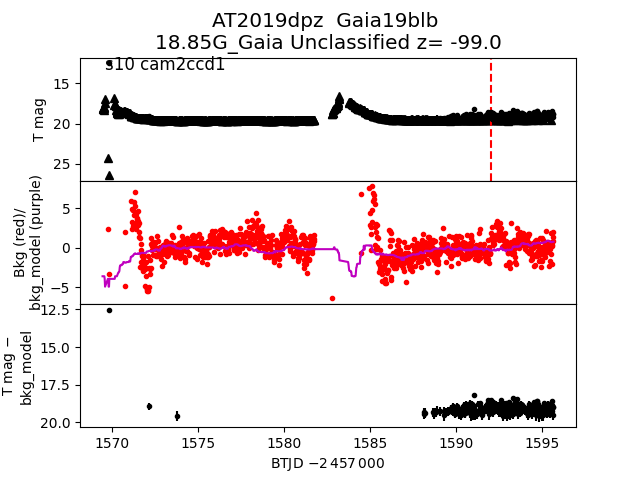
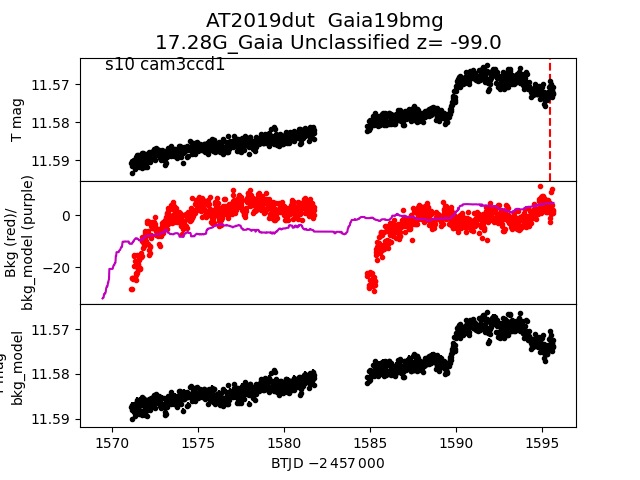
Each figure has three panels. The top panel shows the transient light curve, the middle panel shows the local background (estimated in an annulus), and the bottom panel shows a "background-model corrected" light curve. Details about the background model are in the README.
The vertical red line marks the time of discovery reported to TNS. Other useful metadata from TNS is in the figure title.
Note that the top and bottom panel are in magnitudes, while the middle panel is in differential flux units. The magnitudes are calibrated to the flux in the reference image used for image subtraction. Thus, flux from the host galaxy is included in these magnitudes.
3-sigma upper limits are plotted as triangles with no errorbars. A typical limiting magnitude is 19.6 in 30 minutes or 18.4 in 200 seconds (for low backgrounds).
The links allow you to download the light curve data as a text file.
More details in the README.
2019cqk
 2019con
 2019dng
 2019dtv
 2019din
 2019dqg
 2019crz
 2019dji
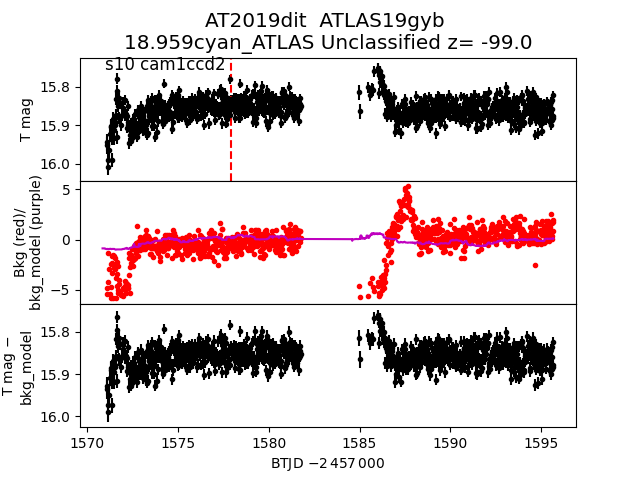
 2019dit
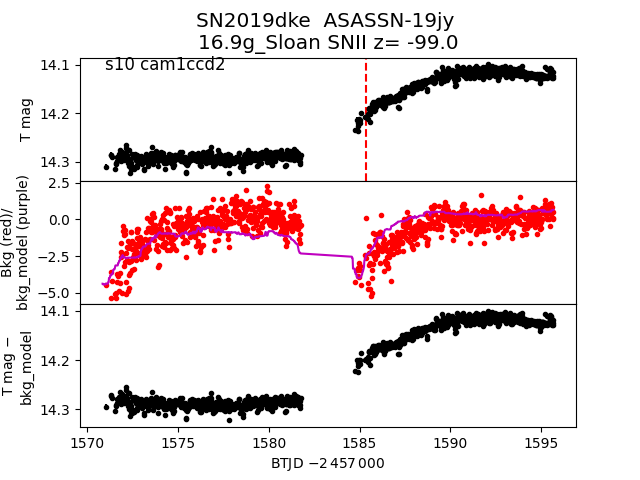
 2019dke
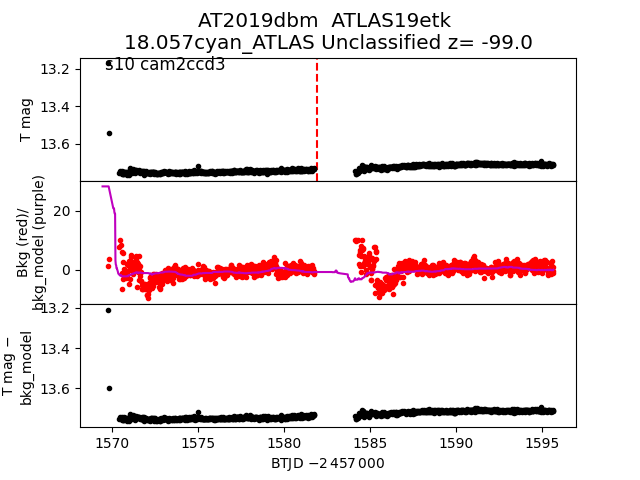
 2019dbm
 2019cot
 2019clu
 2019cmf
 2019dpd
 2019cow
 2019dhm
 2019dww
 2019cwr
 2019cou
 2019ecn
 2019dzs
 2019coc
 2019djd
 2019crw
 2019cxt
 2019cqi
 2019cos
 2019dov
 2019cmb
 2019gvi
 2019dns
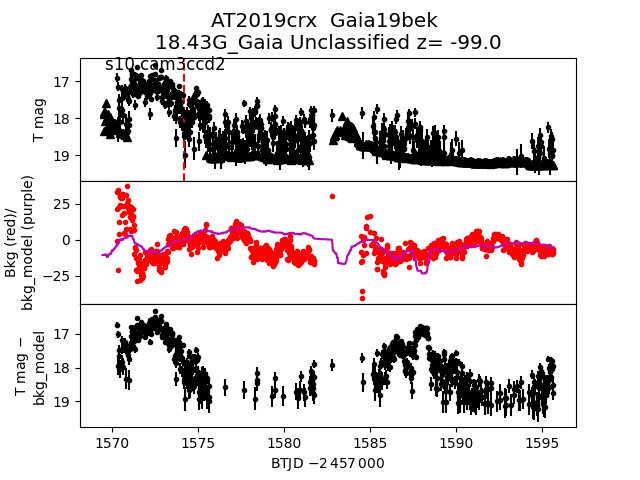
 2019crx
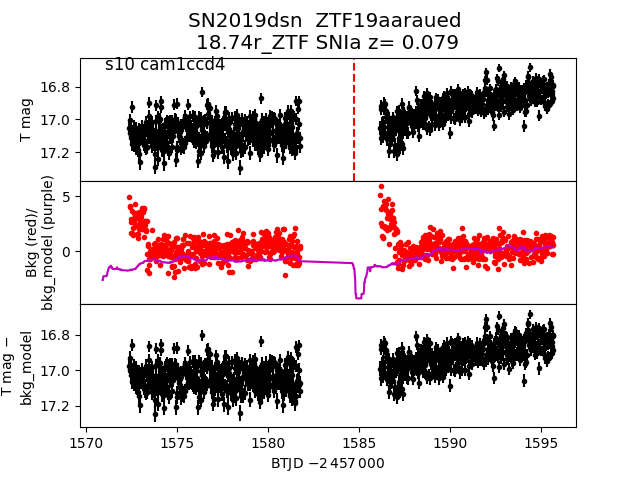
 2019dsn
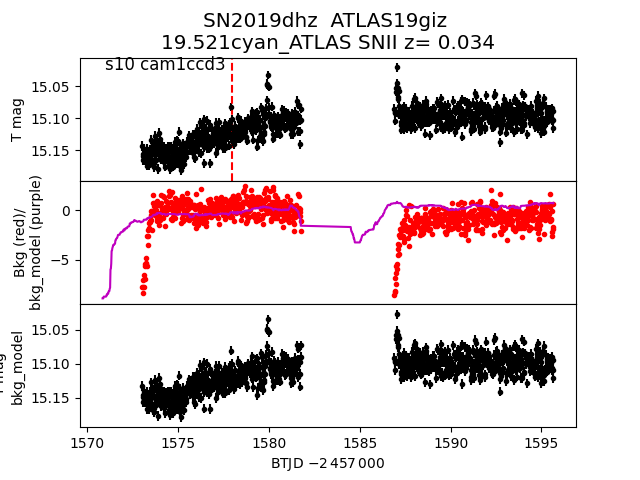
 2019dhz
 2019deo
 2019dfr
 2019cql
 2019clt
 2019dpz
 2019dut
 2019ddc