all transients in sector09 (26 total)
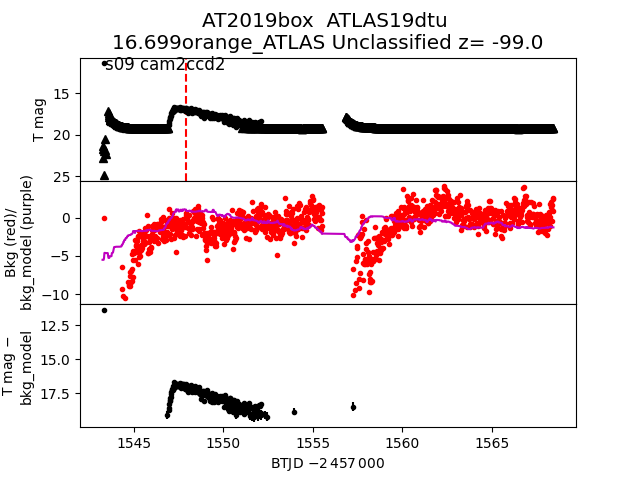
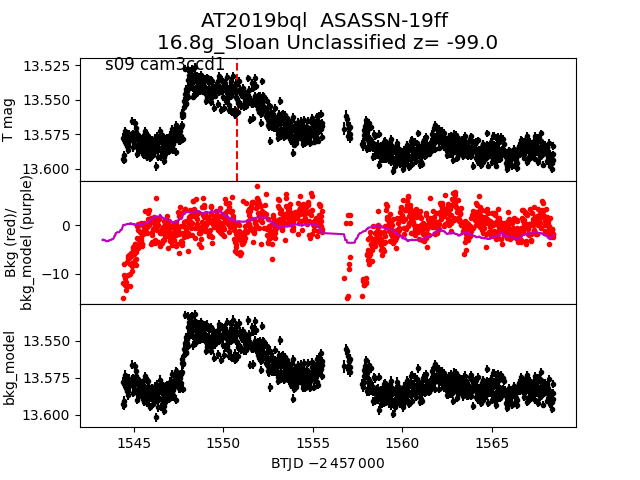
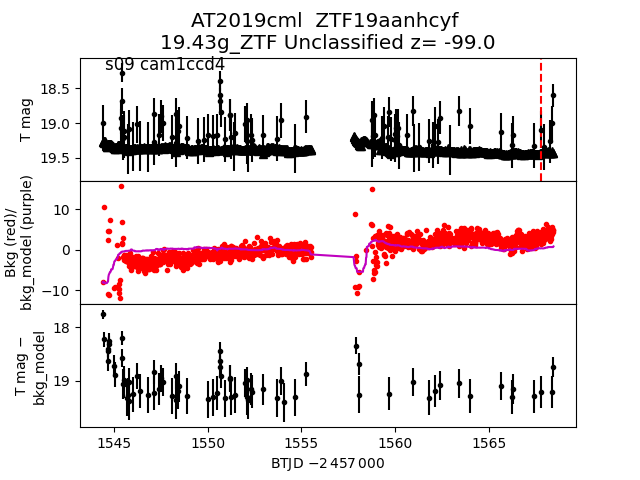
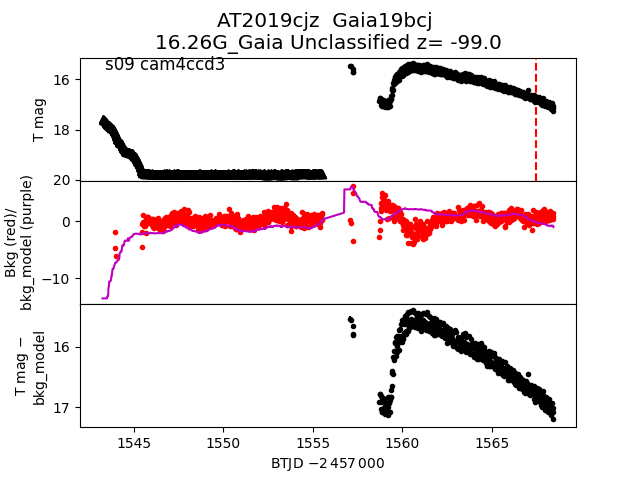
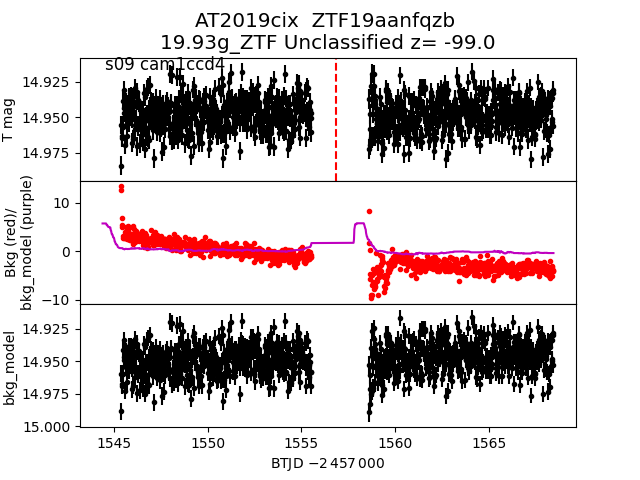
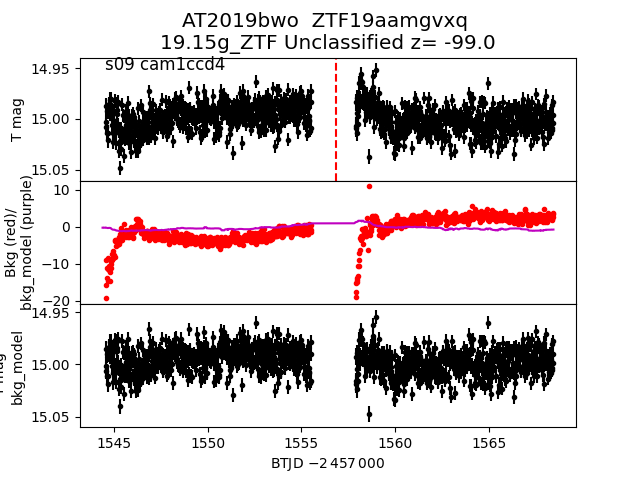
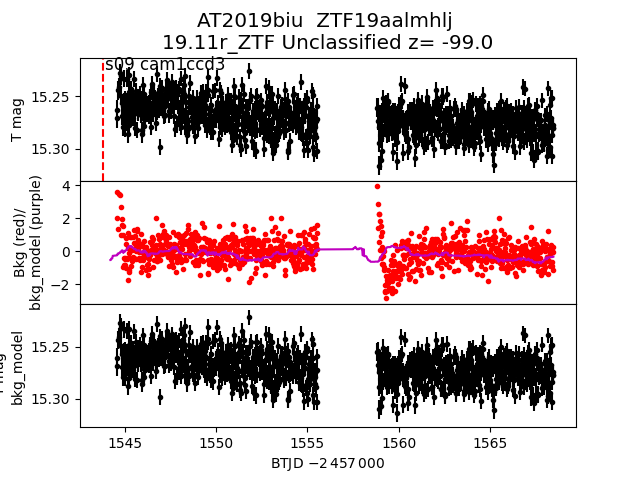
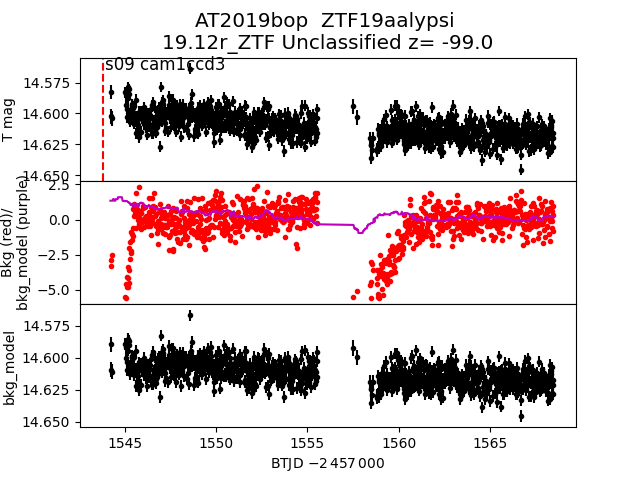
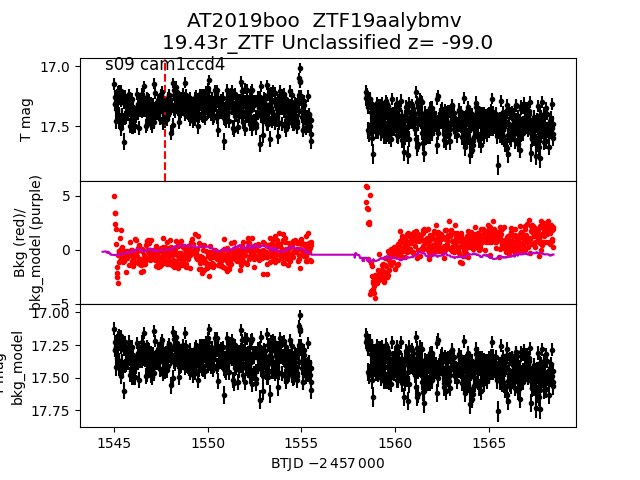
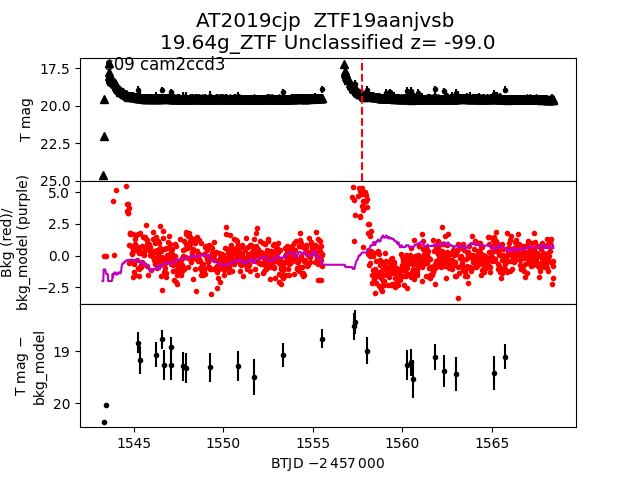
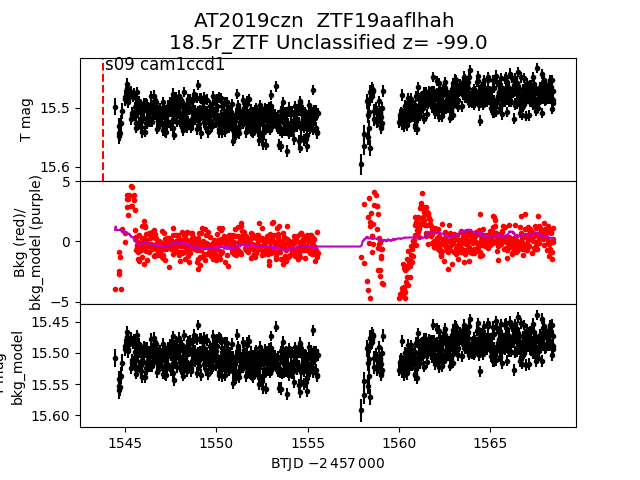
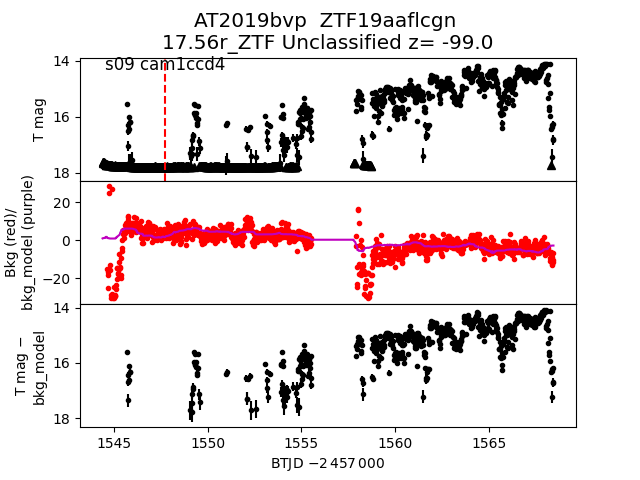
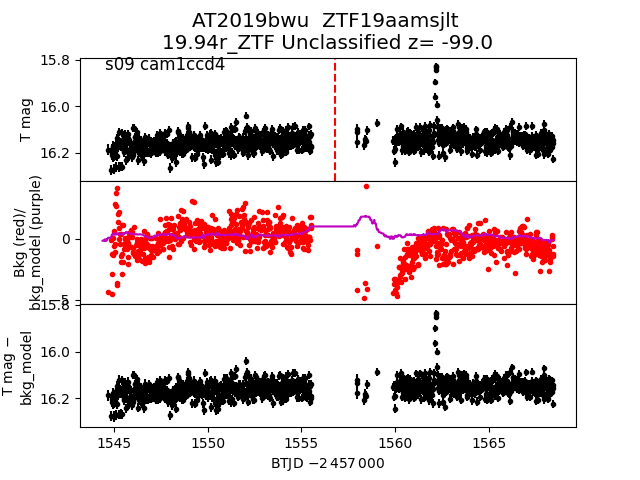
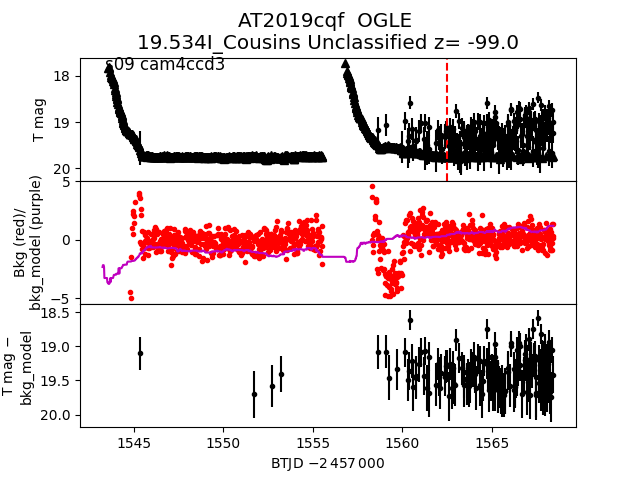
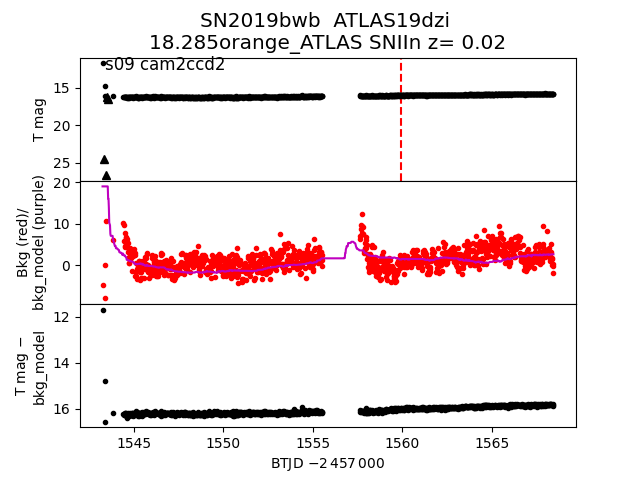
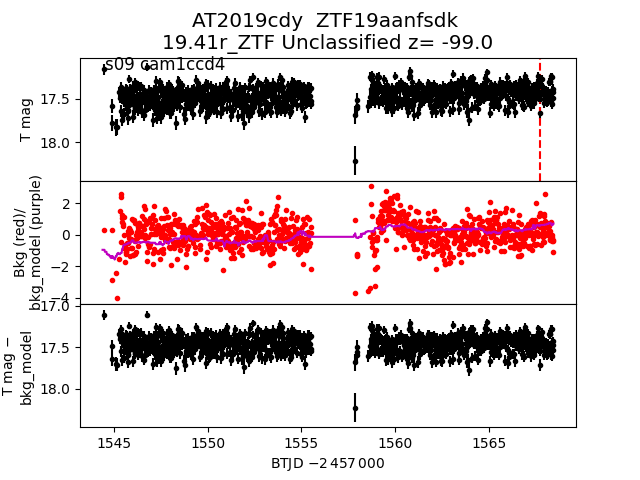
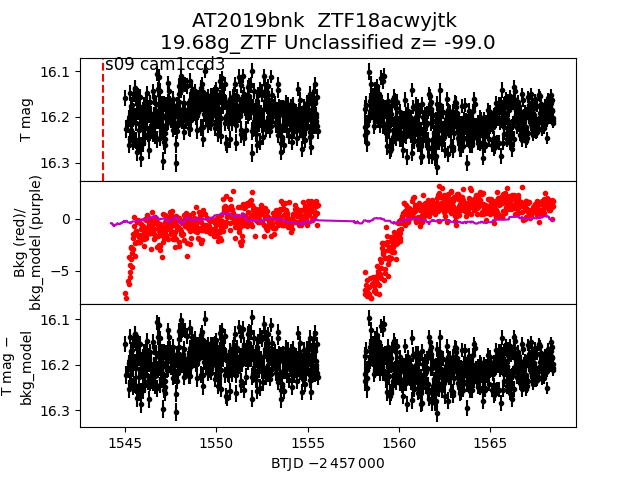
Each figure has three panels. The top panel shows the transient light curve, the middle panel shows the local background (estimated in an annulus), and the bottom panel shows a "background-model corrected" light curve. Details about the background model are in the README.
The vertical red line marks the time of discovery reported to TNS. Other useful metadata from TNS is in the figure title.
Note that the top and bottom panel are in magnitudes, while the middle panel is in differential flux units. The magnitudes are calibrated to the flux in the reference image used for image subtraction. Thus, flux from the host galaxy is included in these magnitudes.
3-sigma upper limits are plotted as triangles with no errorbars. A typical limiting magnitude is 19.6 in 30 minutes or 18.4 in 200 seconds (for low backgrounds).
The links allow you to download the light curve data as a text file.
More details in the README.
2019bql
 2019cml
 2019cjz
 2019cix
 2019bwo
 2019biu
 2019bop
 2019boo
 2019cjp
 2019czn
 2019bvp
 2019bwu
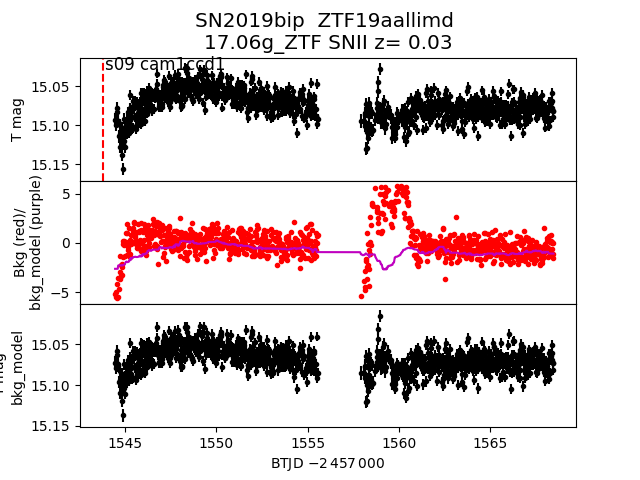
 2019bip
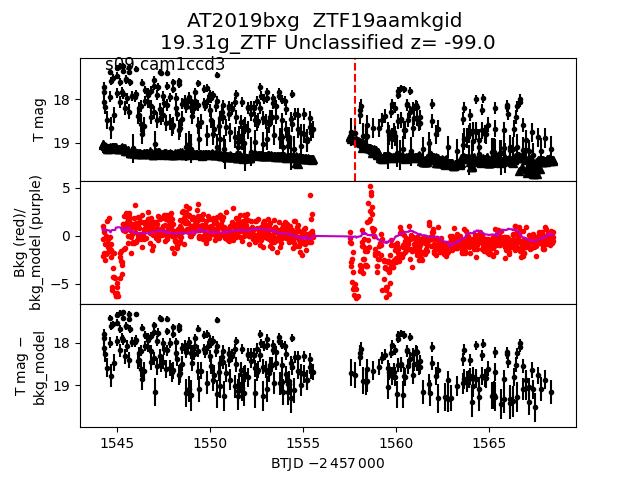
 2019bxg
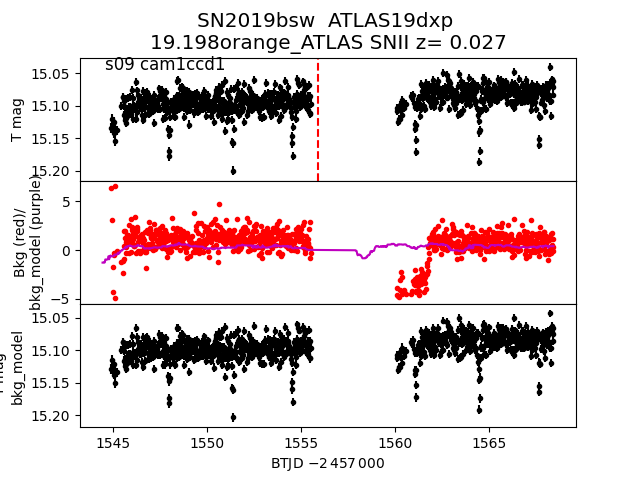
 2019bsw
 2019cqf
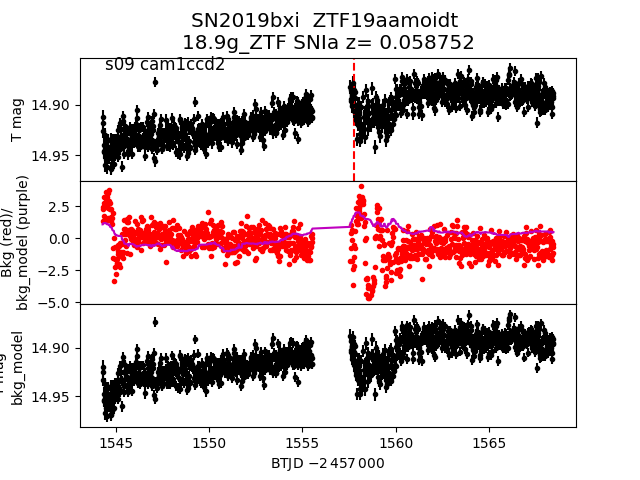
 2019bxi
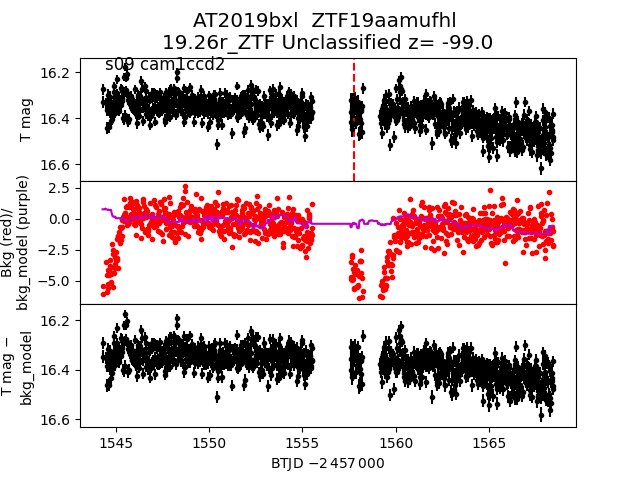
 2019bxl
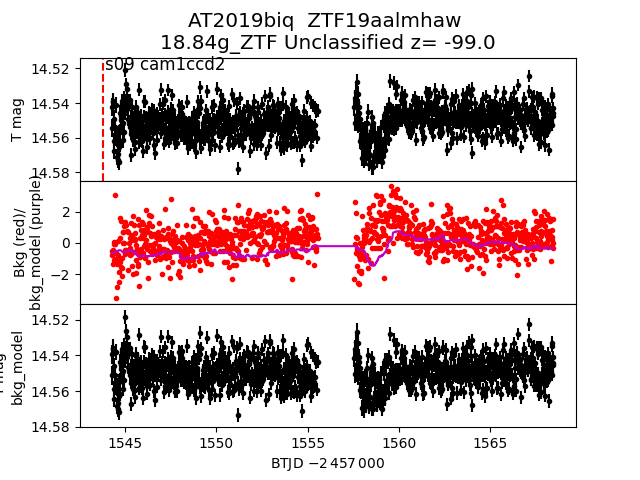
 2019biq
 2019bwb
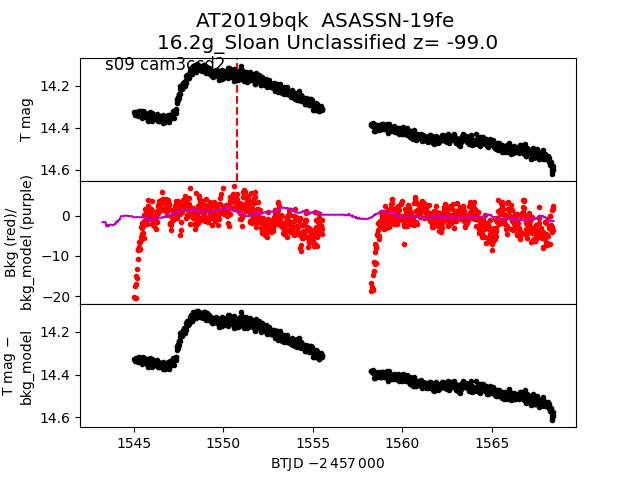
 2019bqk
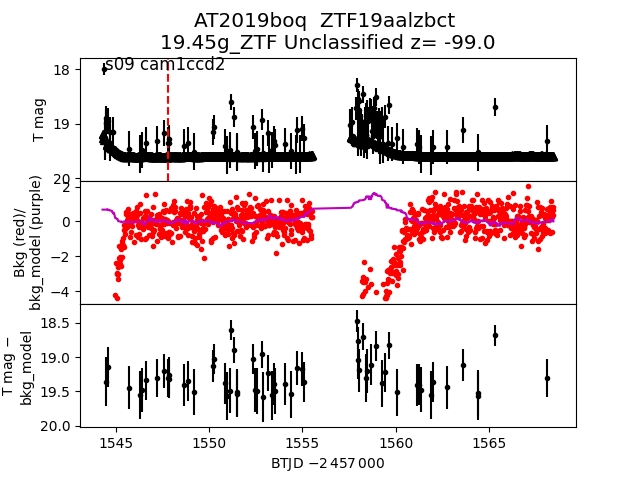
 2019boq
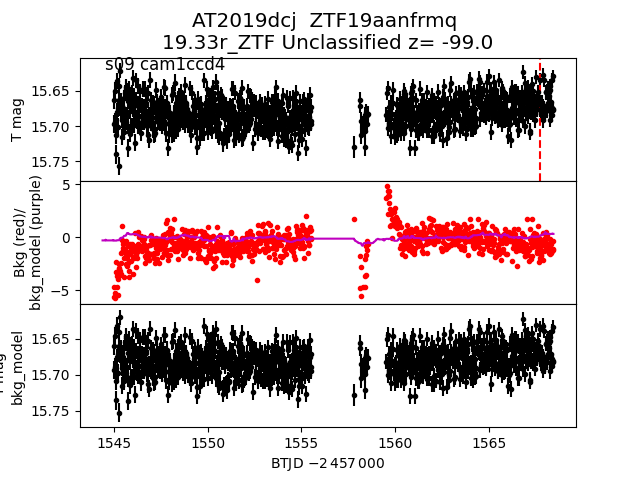
 2019dcj
 2019cdy
 2019bnk
 2019box