all transients in sector07 (30 total)
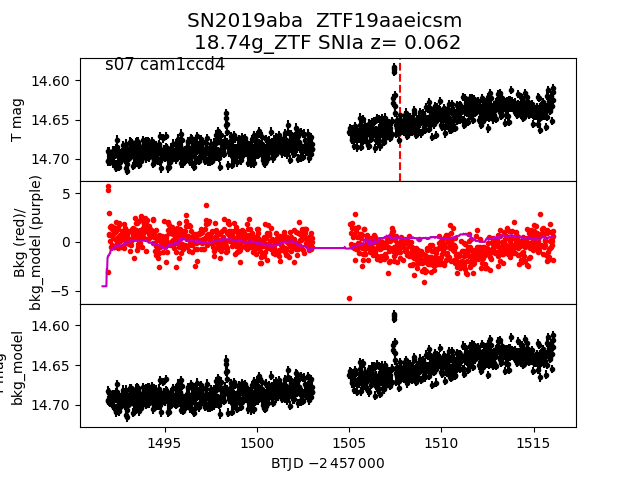
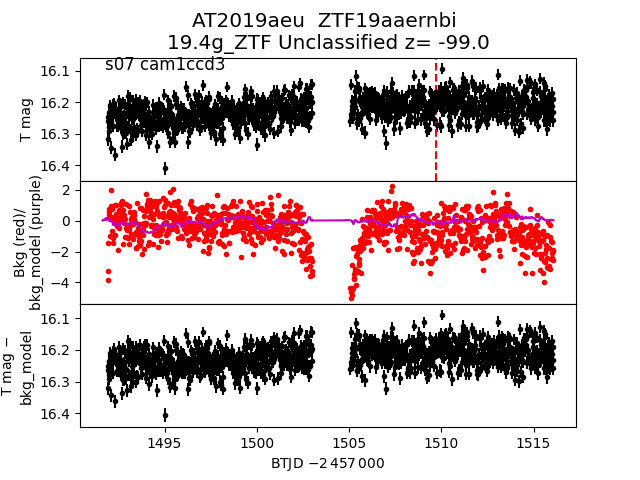
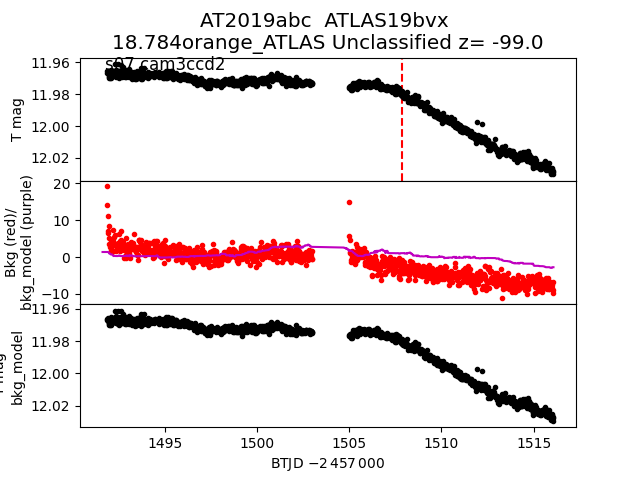
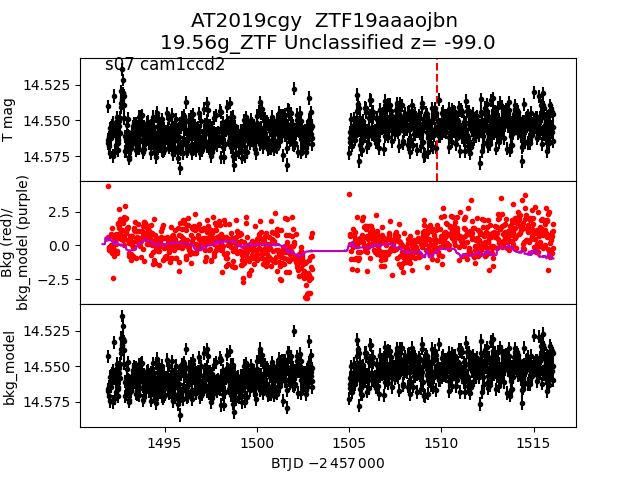
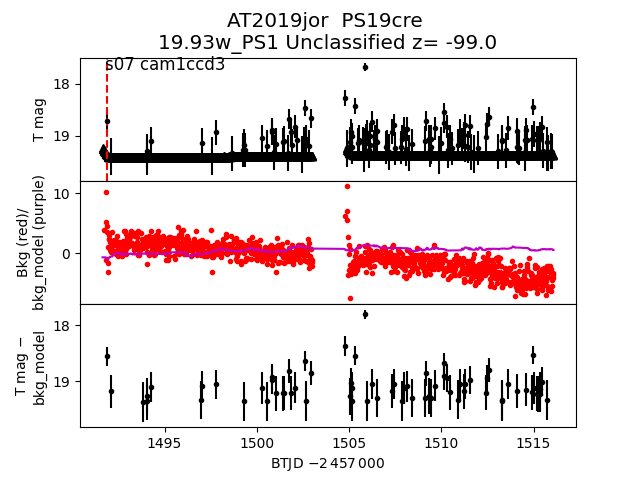
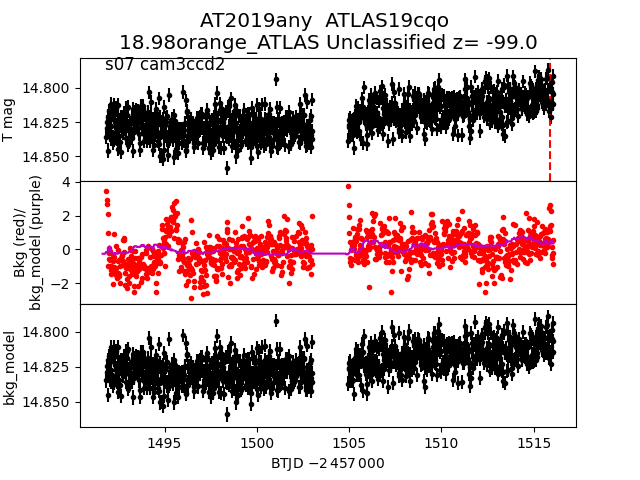
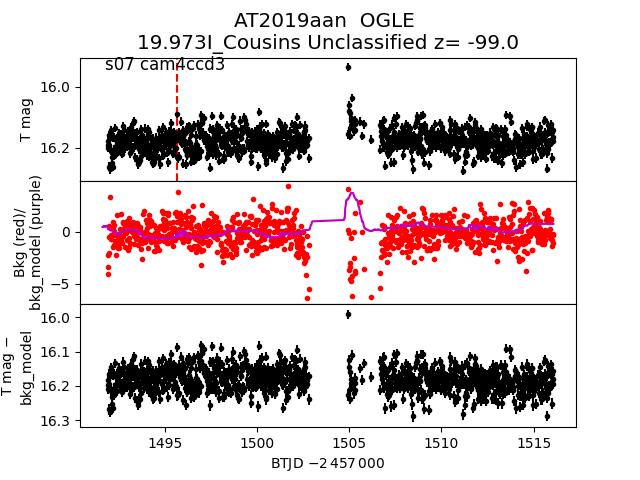
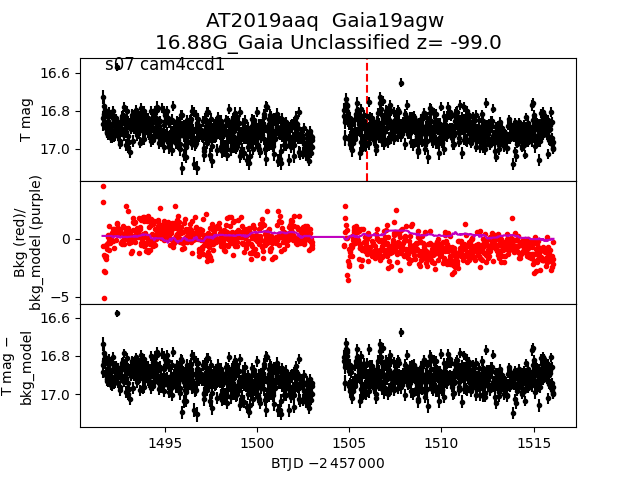
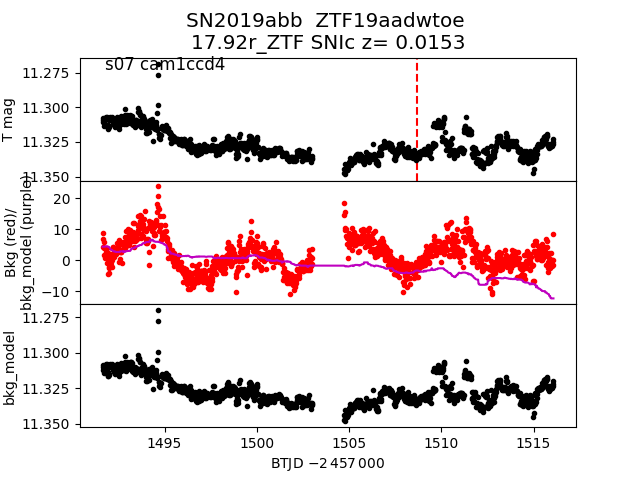
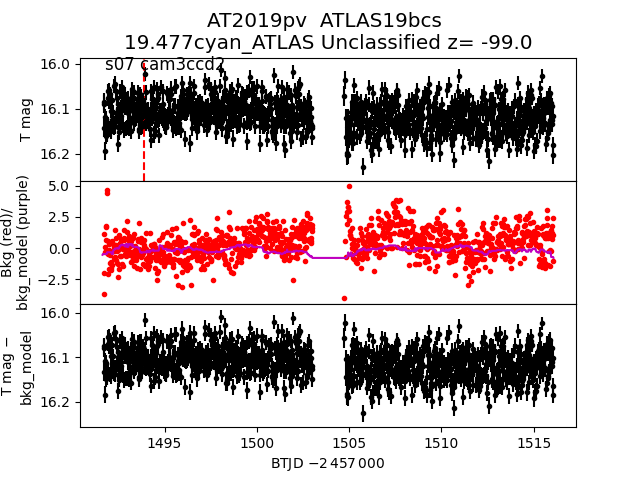
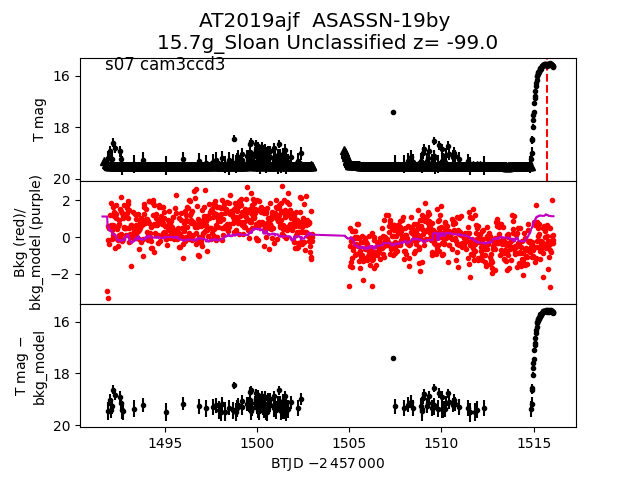
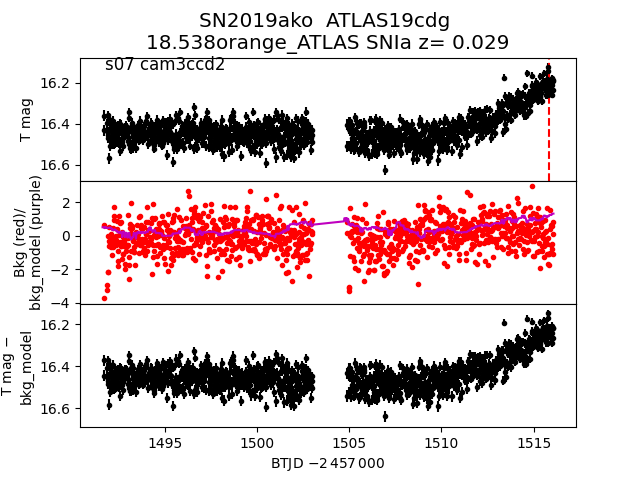
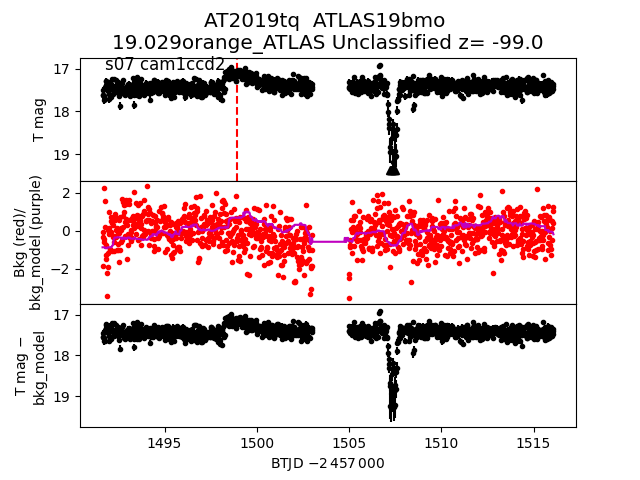
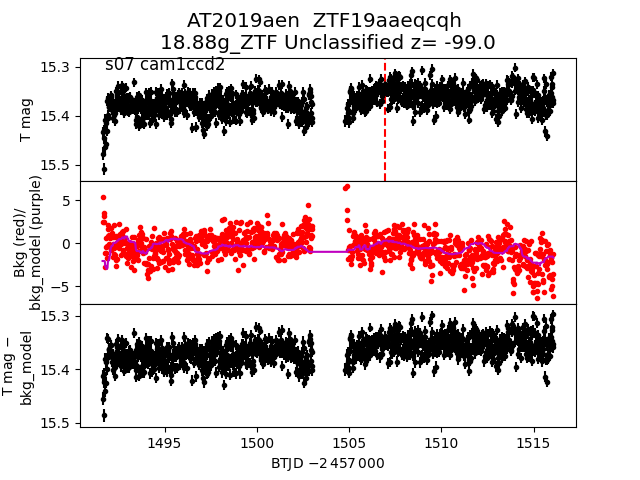
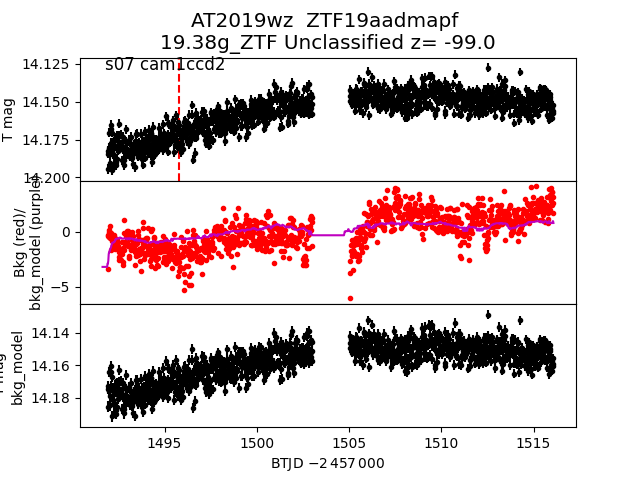
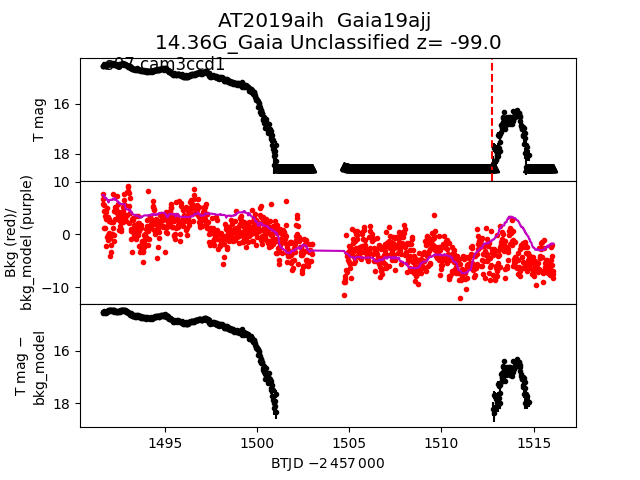
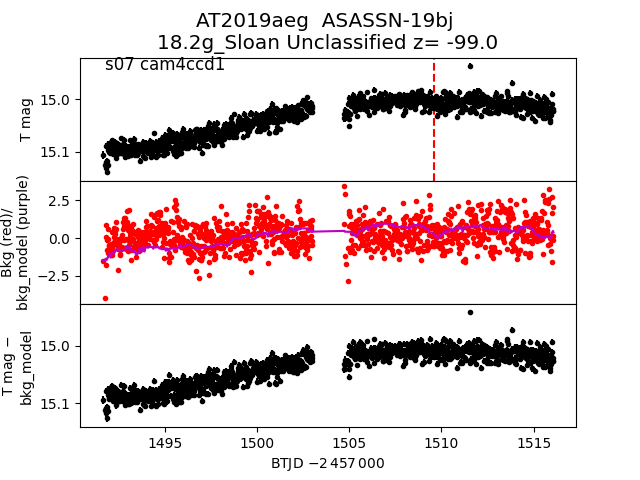
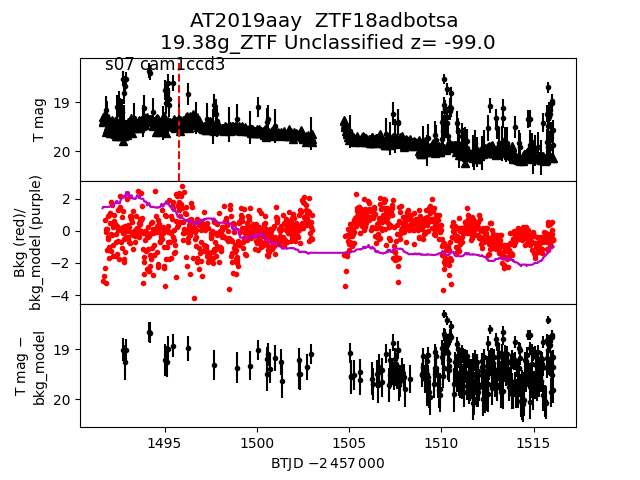
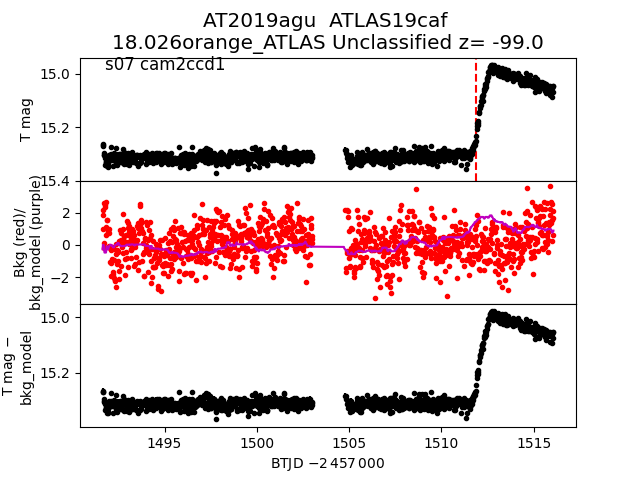
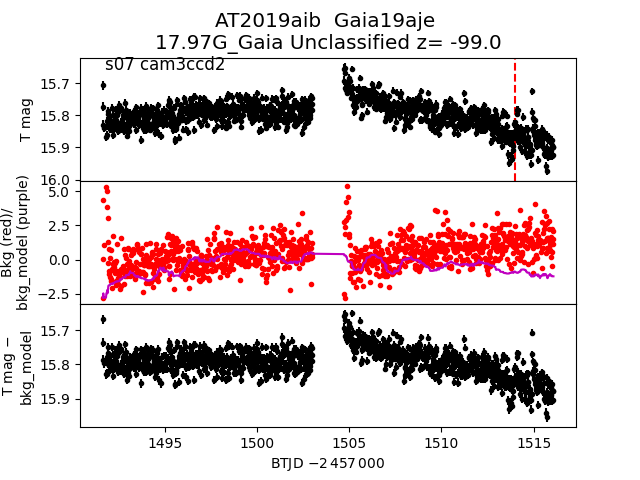
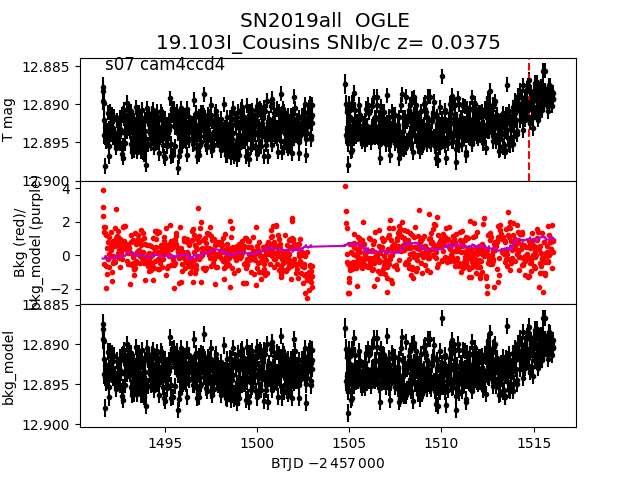
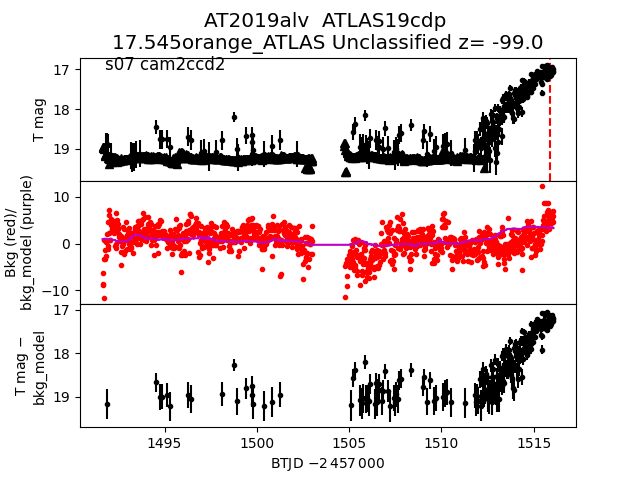
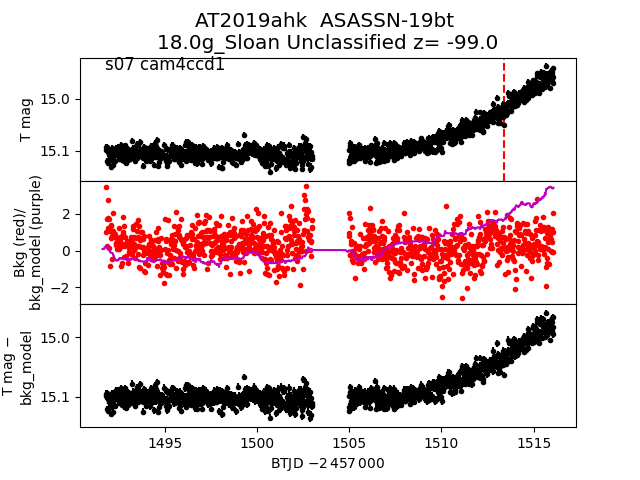
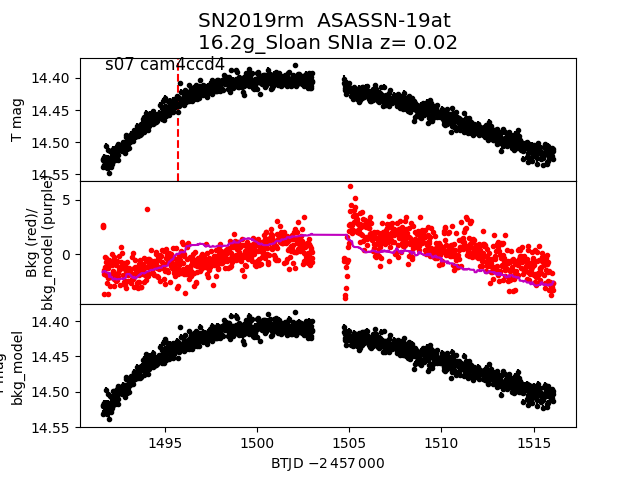
Each figure has three panels. The top panel shows the transient light curve, the middle panel shows the local background (estimated in an annulus), and the bottom panel shows a "background-model corrected" light curve. Details about the background model are in the README.
The vertical red line marks the time of discovery reported to TNS. Other useful metadata from TNS is in the figure title.
Note that the top and bottom panel are in magnitudes, while the middle panel is in differential flux units. The magnitudes are calibrated to the flux in the reference image used for image subtraction. Thus, flux from the host galaxy is included in these magnitudes.
3-sigma upper limits are plotted as triangles with no errorbars. A typical limiting magnitude is 19.6 in 30 minutes or 18.4 in 200 seconds (for low backgrounds).
The links allow you to download the light curve data as a text file.
More details in the README.
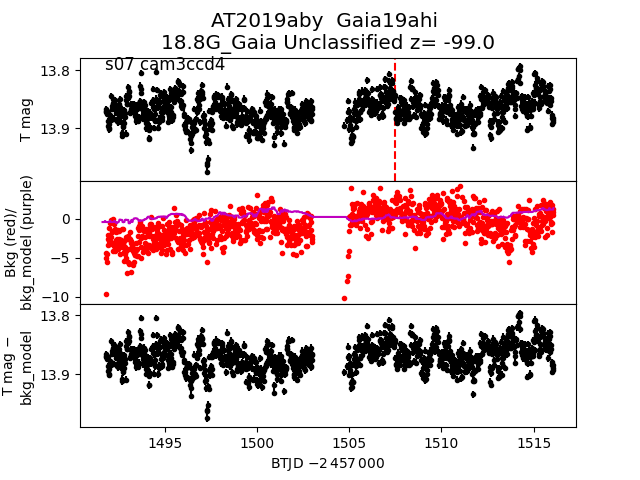
2019aby
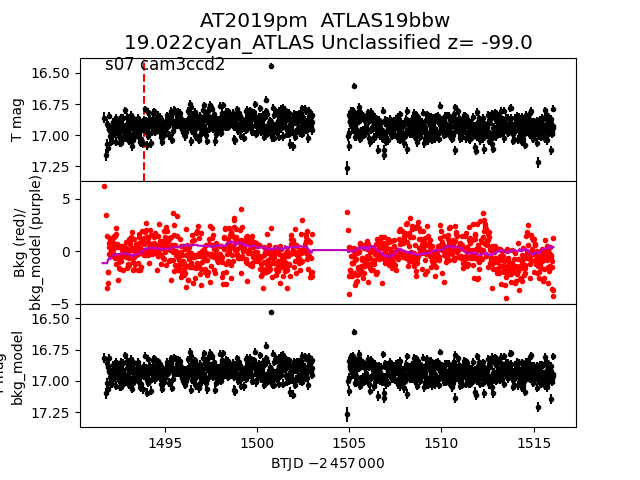
 2019pm
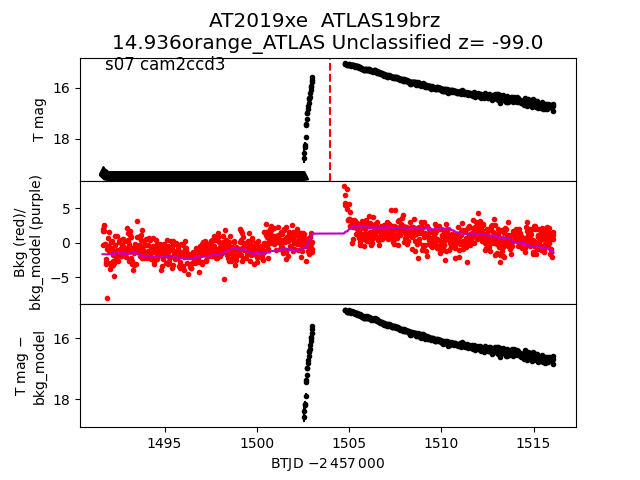
 2019xe
 2019aeu
 2019abc
 2019cgy
 2019jor
 2019any
 2019aan
 2019aaq
 2019abb
 2019pv
 2019ajf
 2019ako
 2019tq
 2019aen
 2019wz
 2019aih
 2019aeg
 2019aay
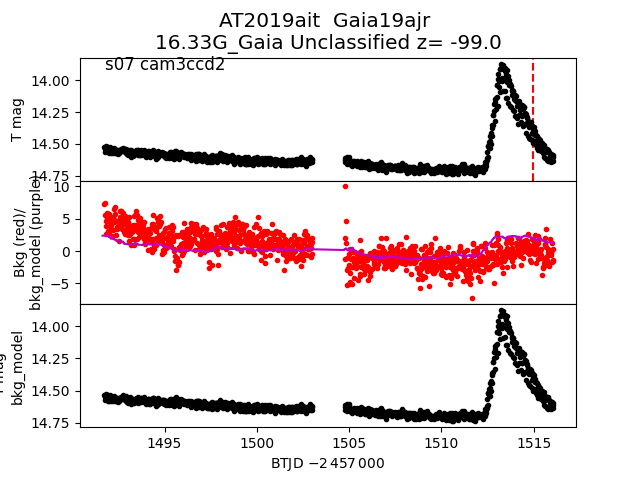
 2019ait
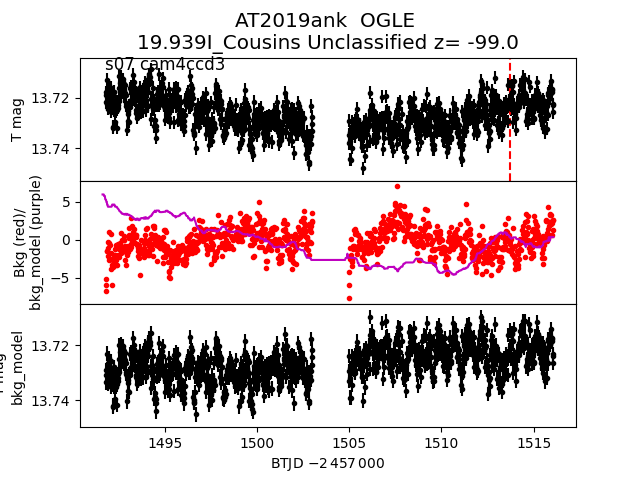
 2019ank
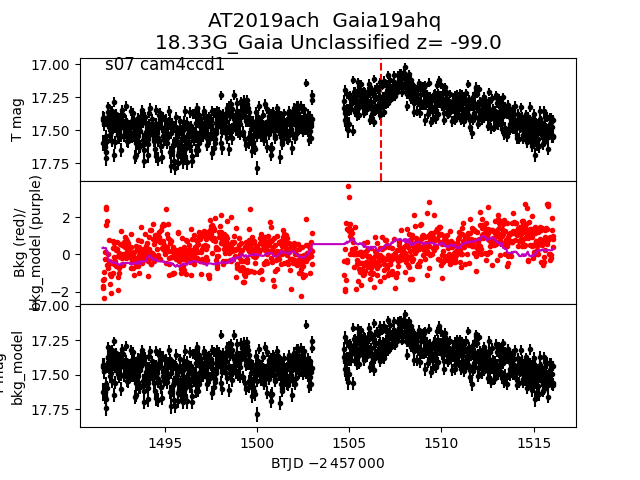
 2019ach
 2019agu
 2019aib
 2019all
 2019alv
 2019ahk
 2019rm
 2019aba