all transients in sector06 (51 total)
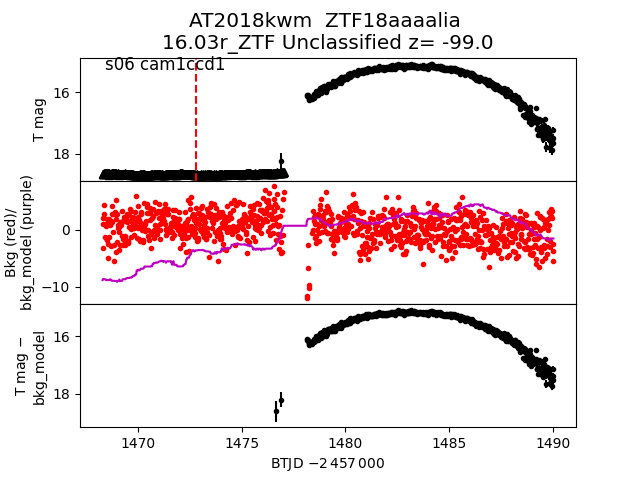
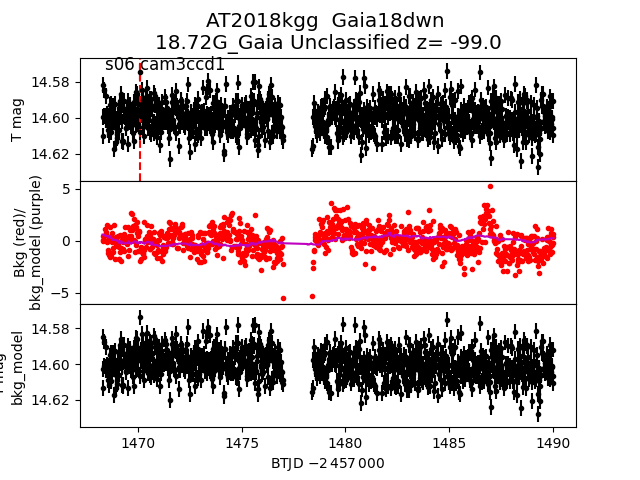
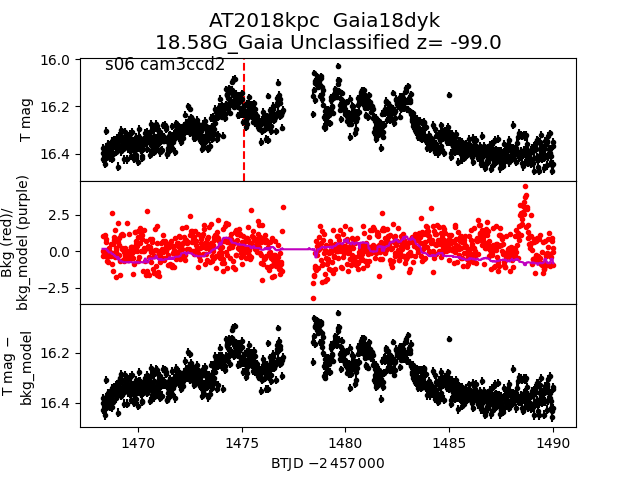
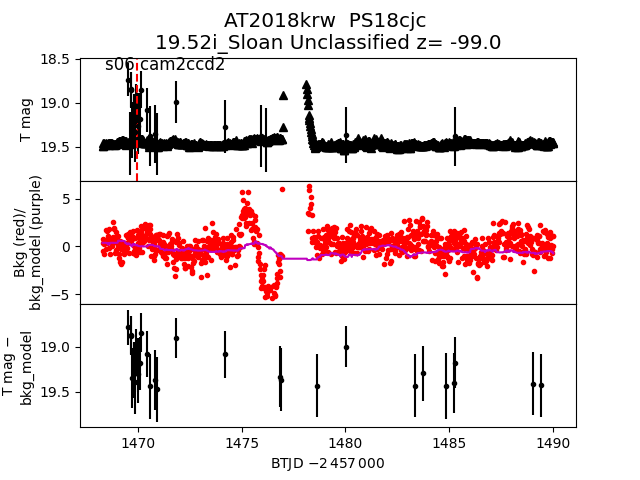
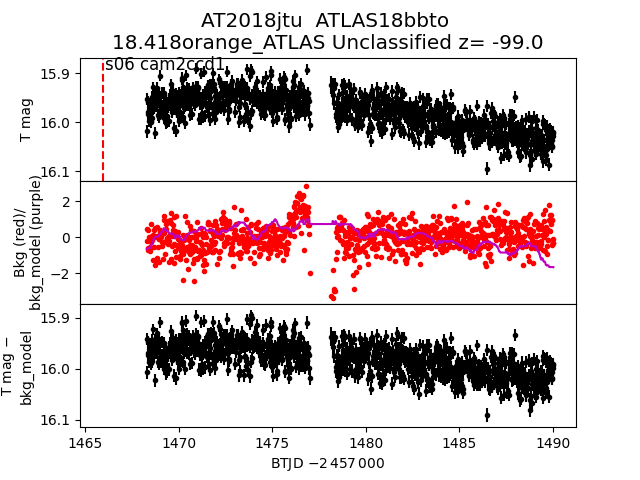
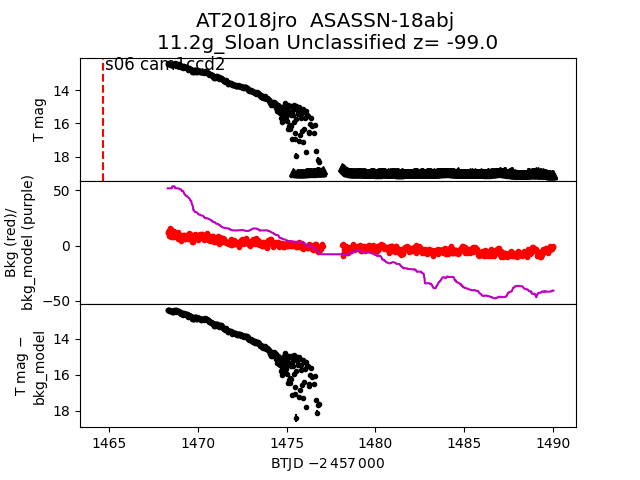
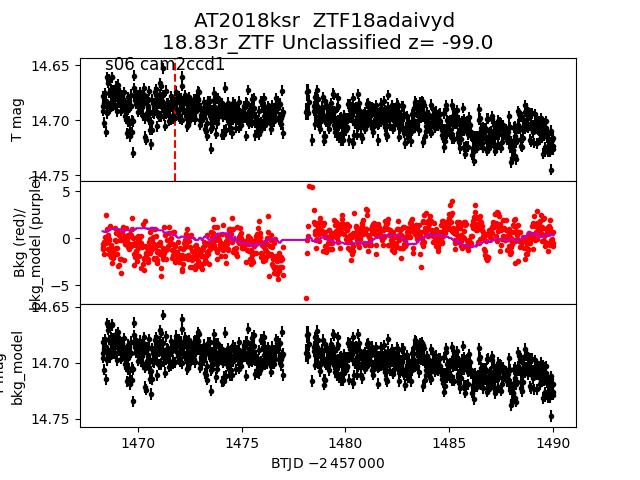
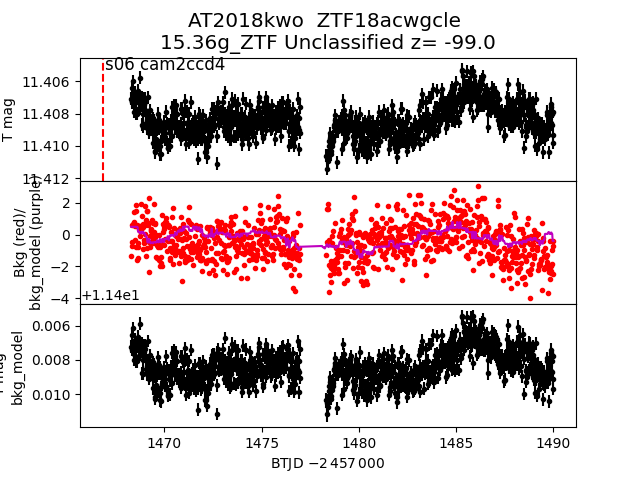
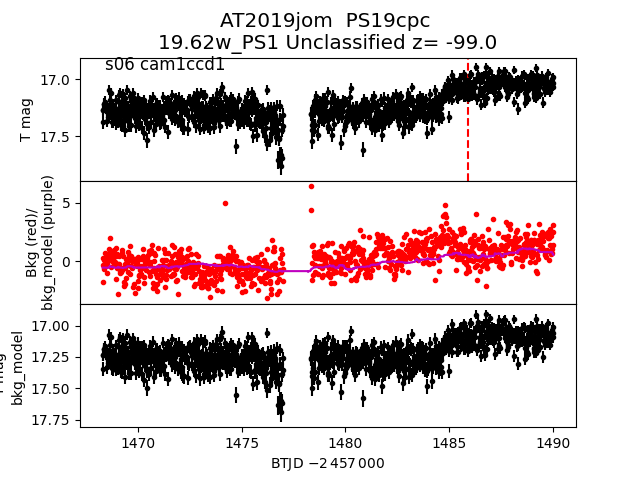
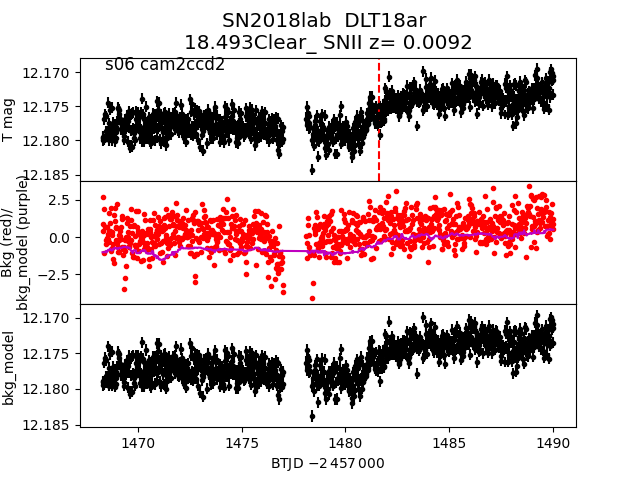
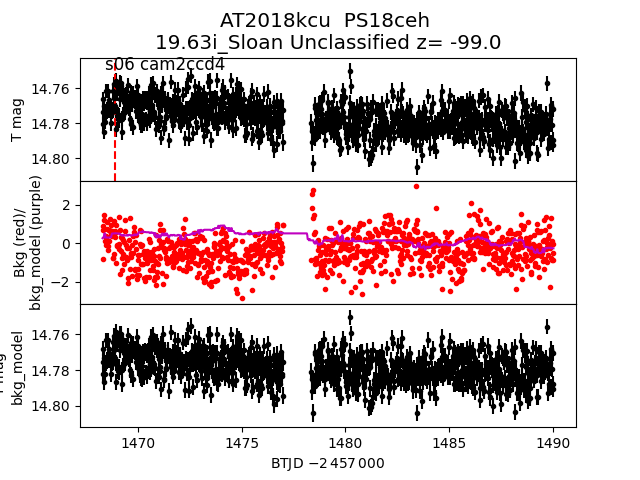
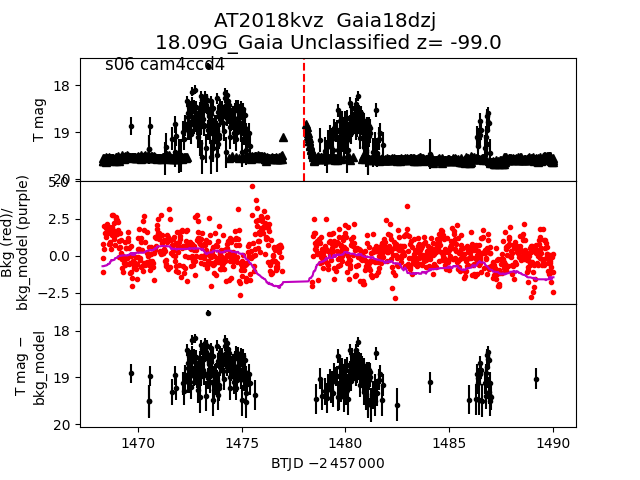
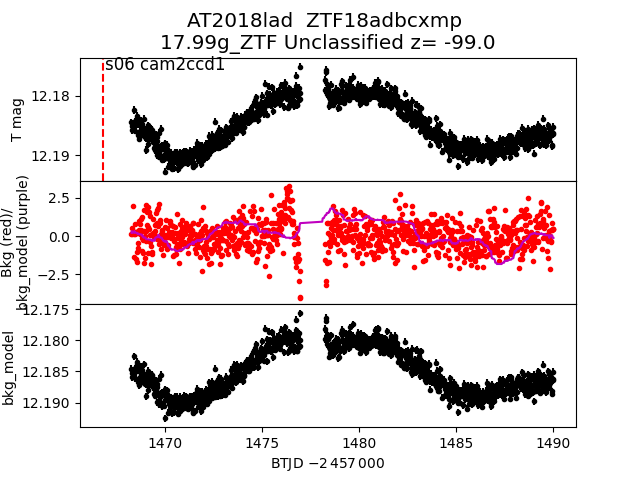
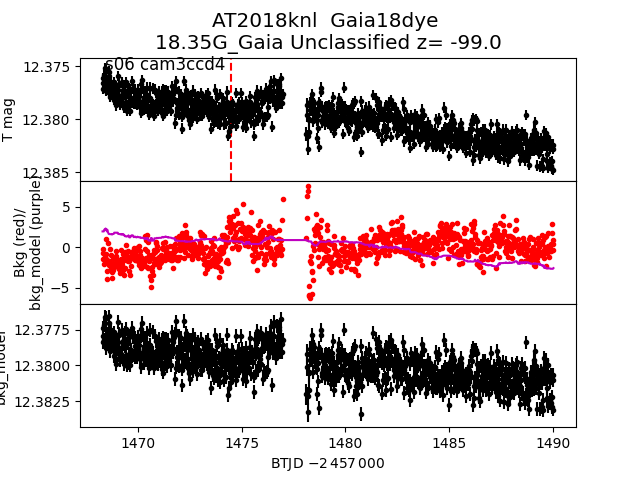
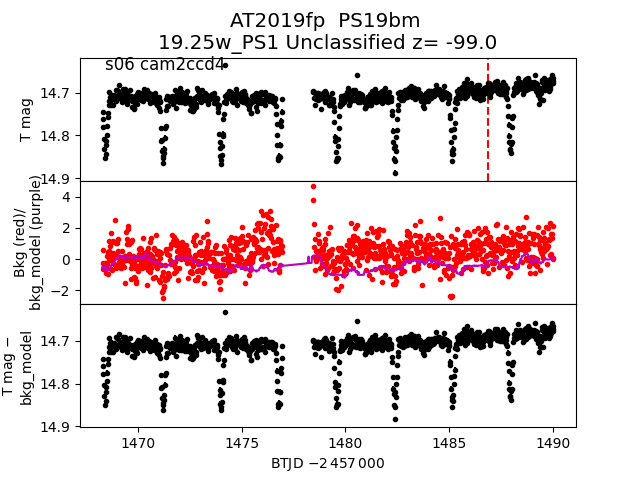
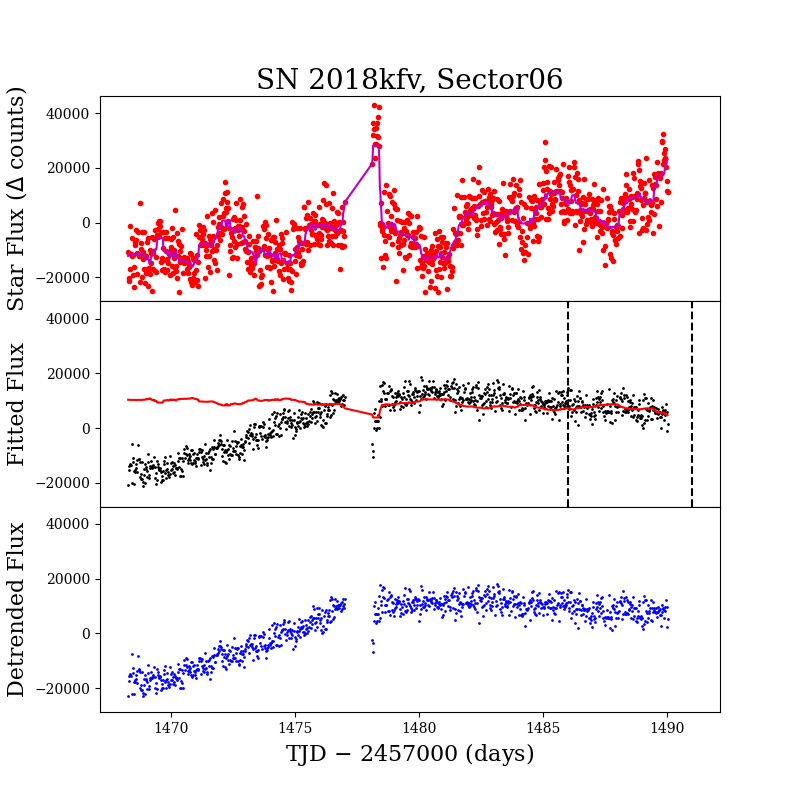
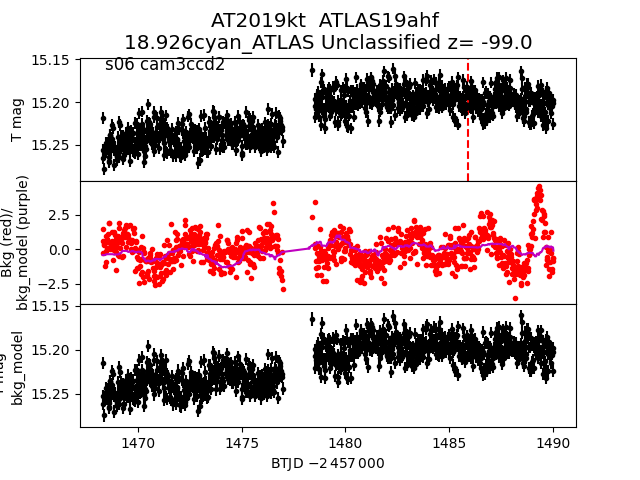
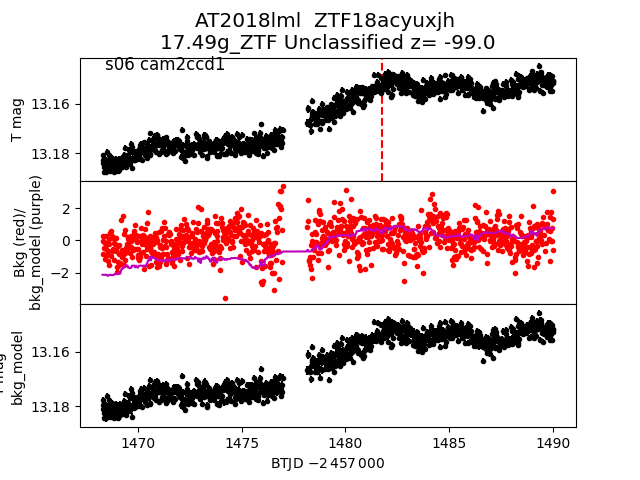
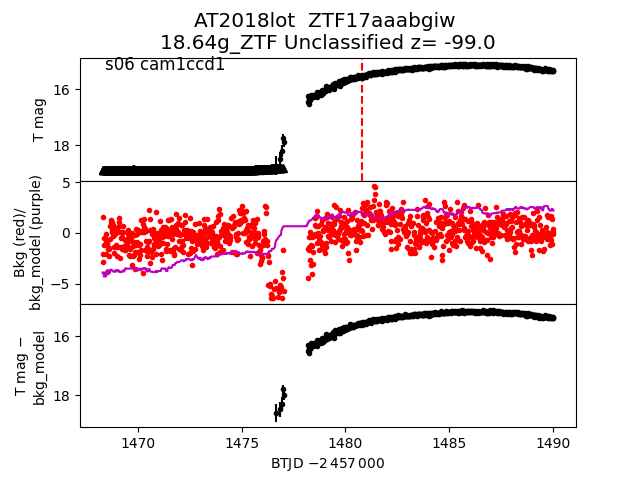
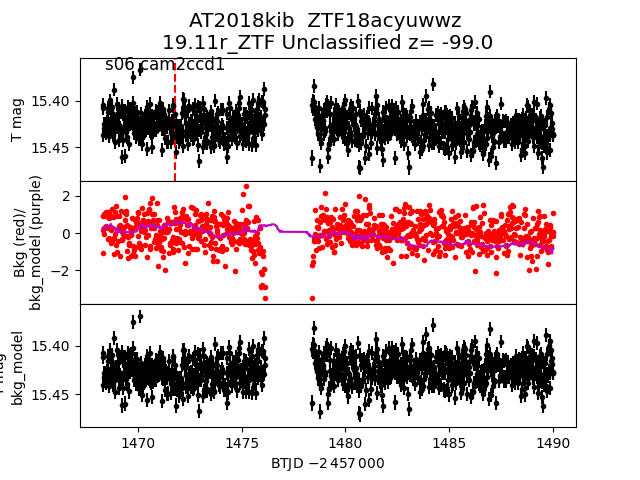
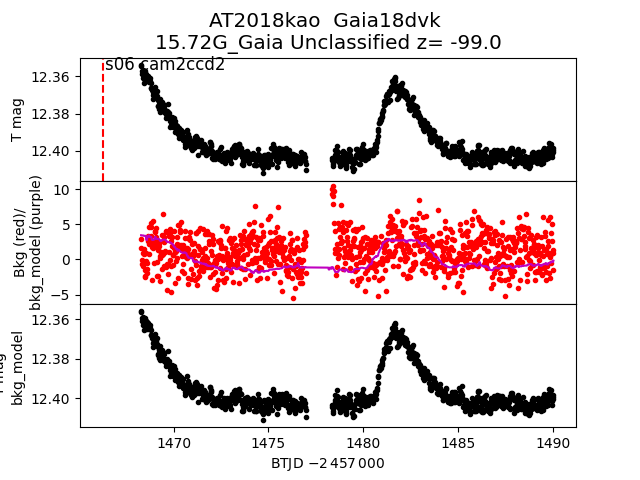
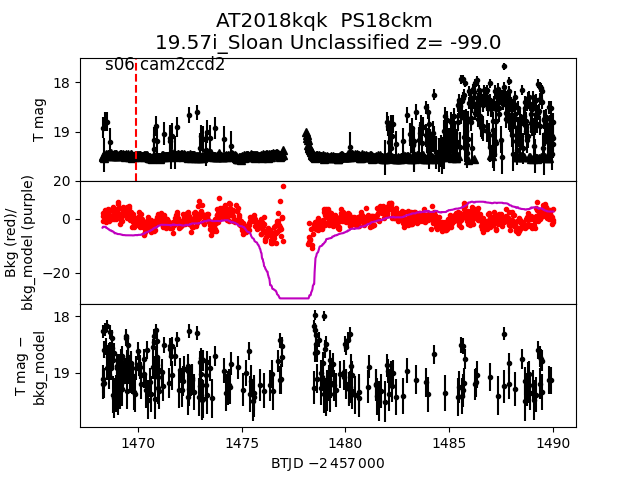
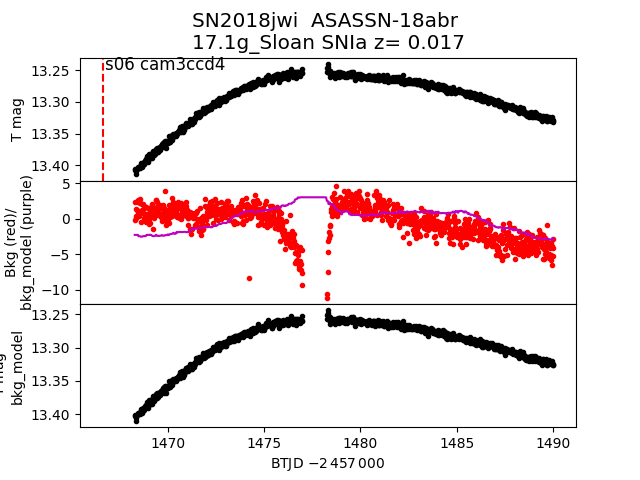
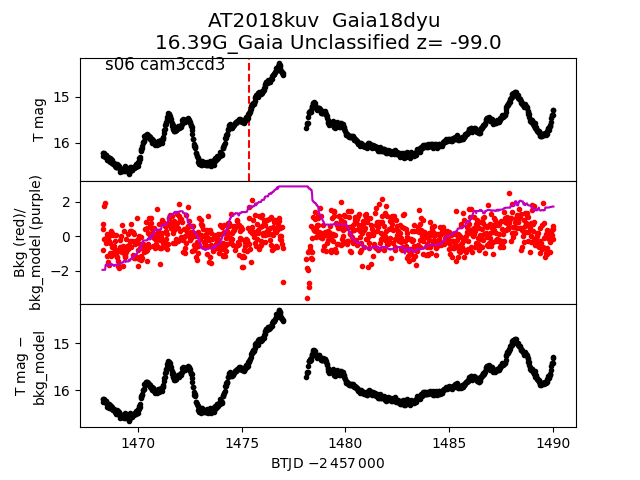
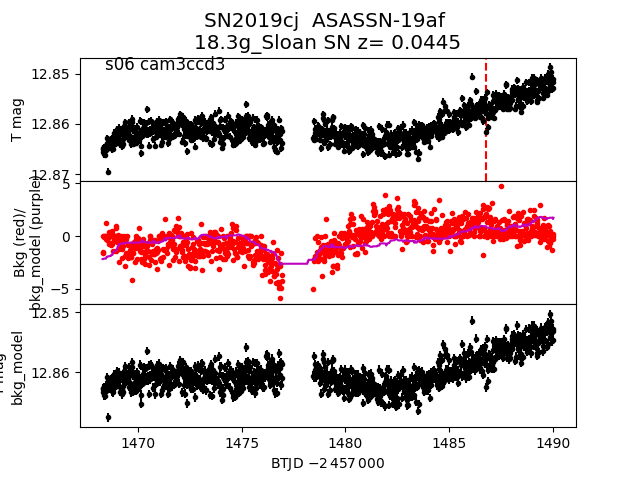
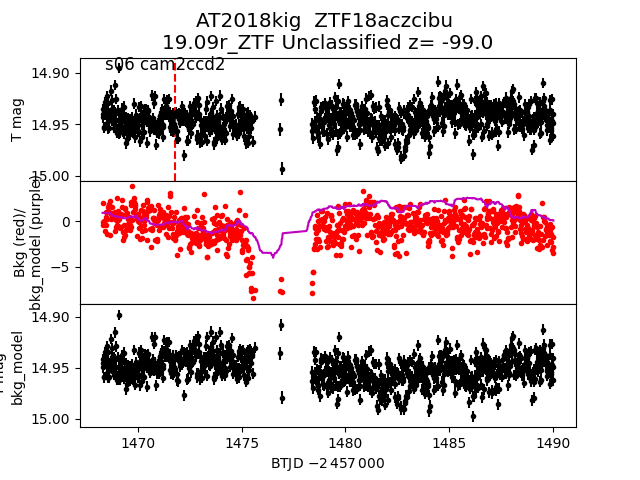
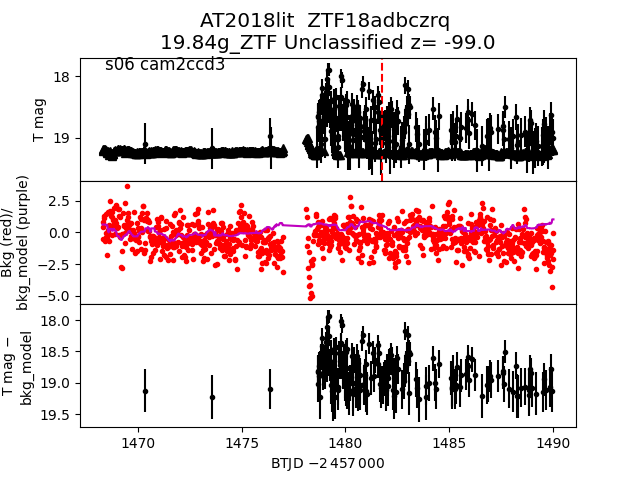
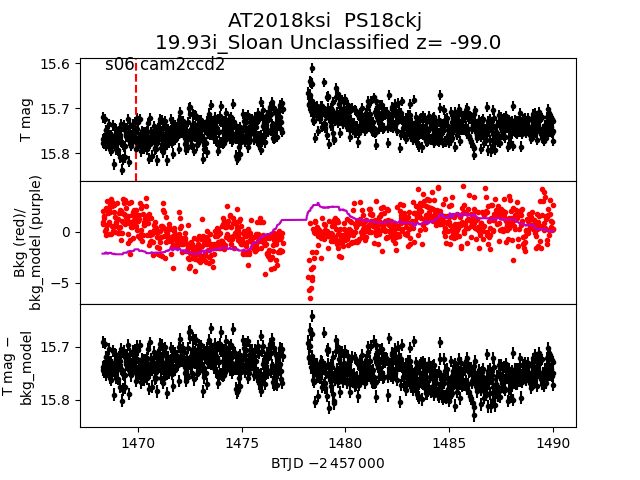
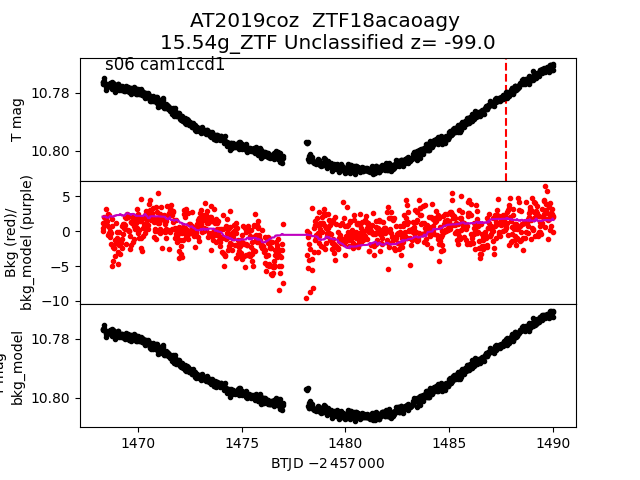
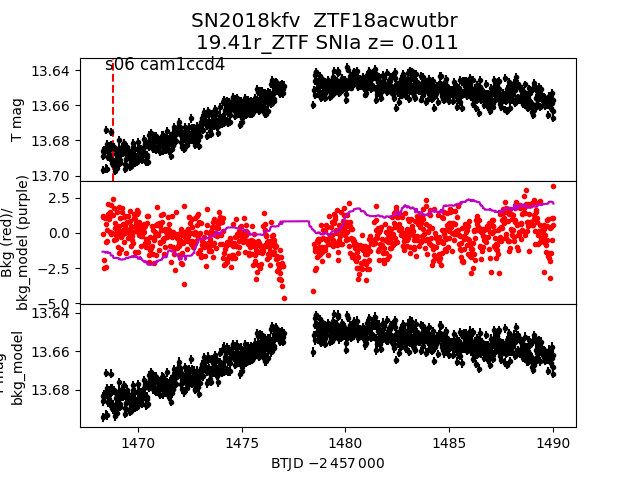
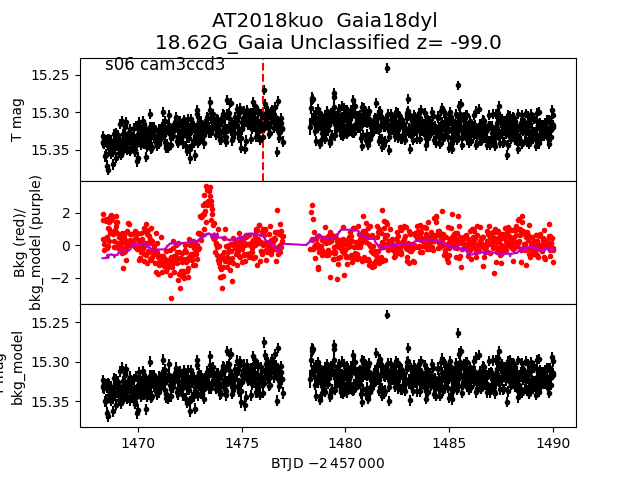
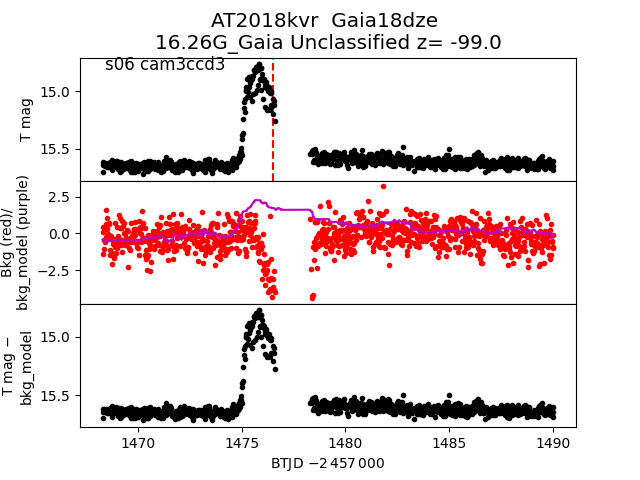
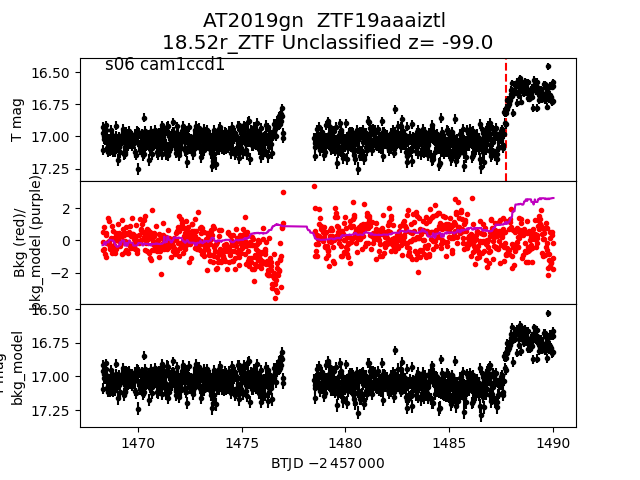
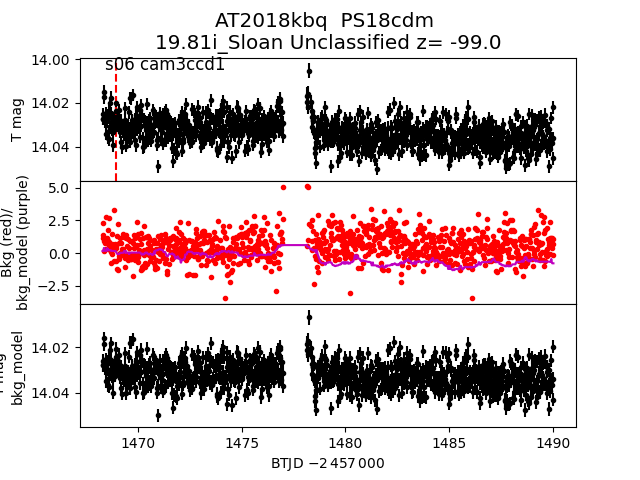
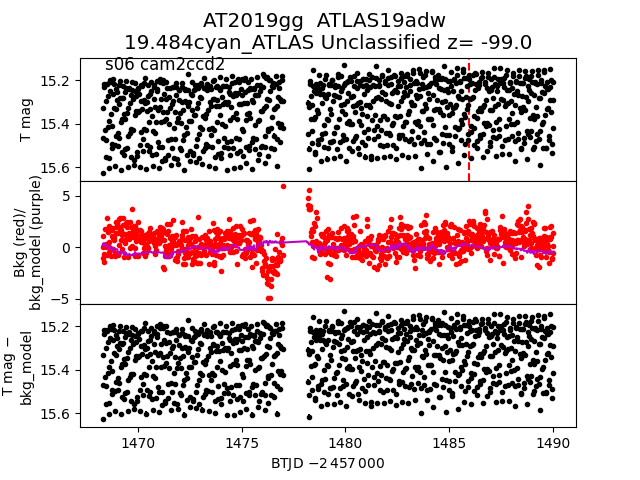
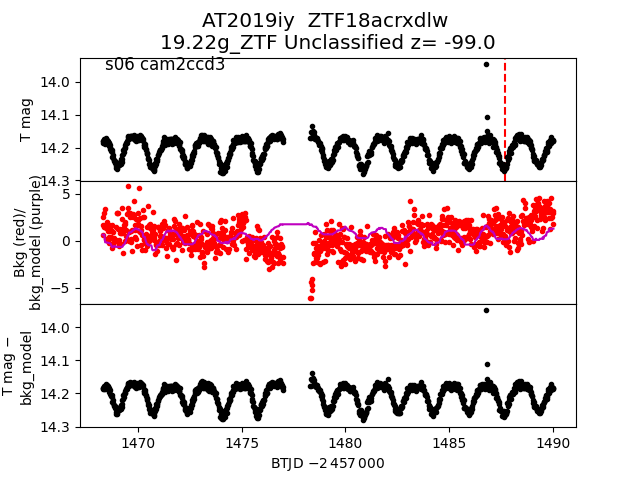
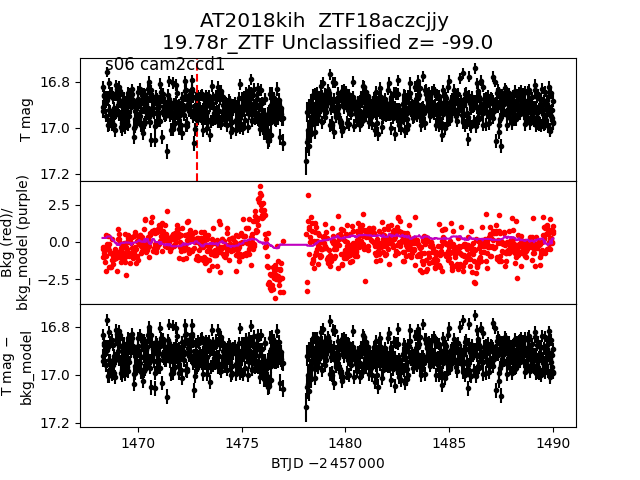
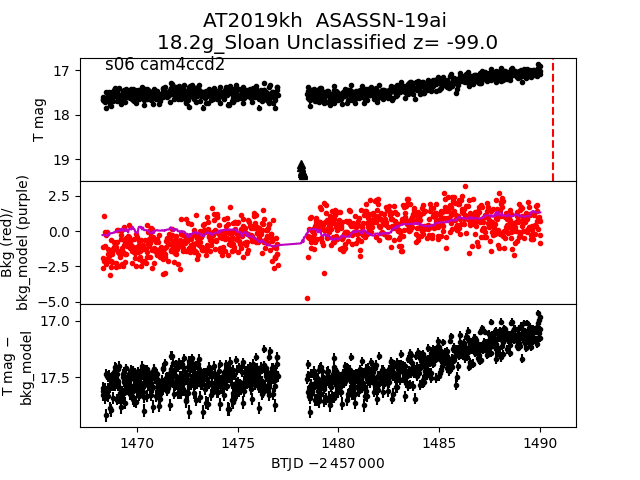
Each figure has three panels. The top panel shows the transient light curve, the middle panel shows the local background (estimated in an annulus), and the bottom panel shows a "background-model corrected" light curve. Details about the background model are in the README.
The vertical red line marks the time of discovery reported to TNS. Other useful metadata from TNS is in the figure title.
Note that the top and bottom panel are in magnitudes, while the middle panel is in differential flux units. The magnitudes are calibrated to the flux in the reference image used for image subtraction. Thus, flux from the host galaxy is included in these magnitudes.
3-sigma upper limits are plotted as triangles with no errorbars. A typical limiting magnitude is 19.6 in 30 minutes or 18.4 in 200 seconds (for low backgrounds).
The links allow you to download the light curve data as a text file.
More details in the README.
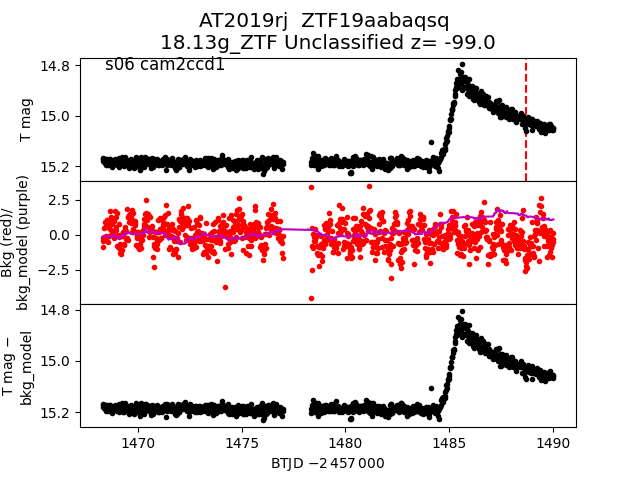
2019rj
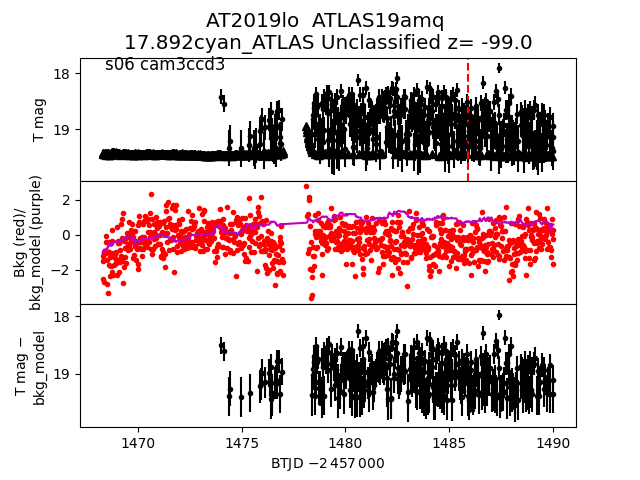
 2019lo
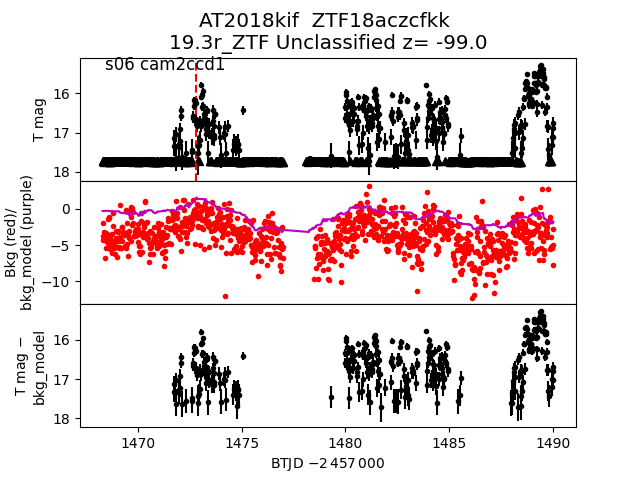
 2018kif
 2018kgg
 2018kpc
 2018krw
 2018jtu
 2018jro
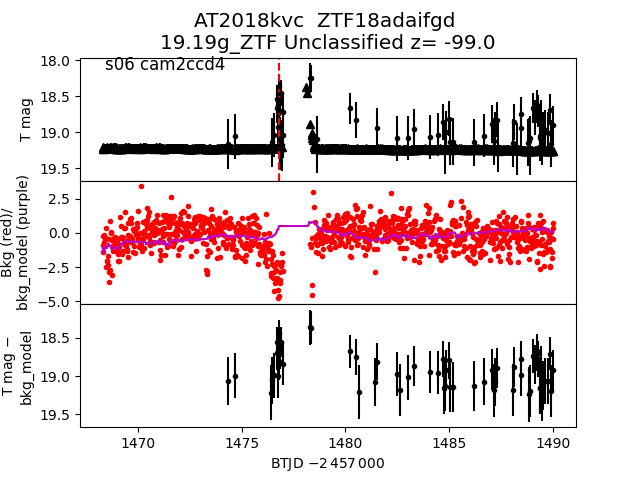
 2018kvc
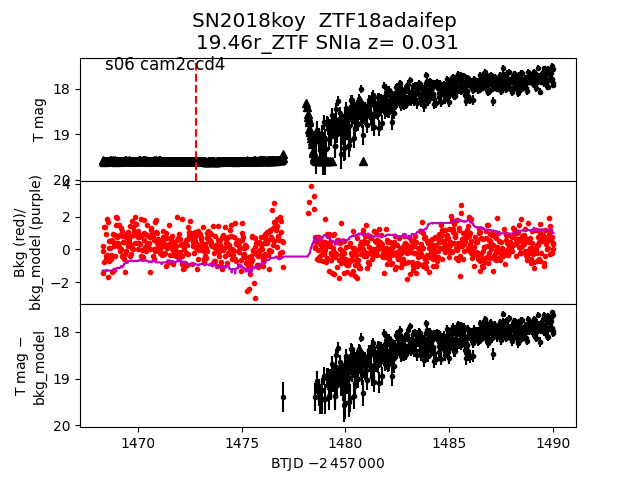
 2018koy
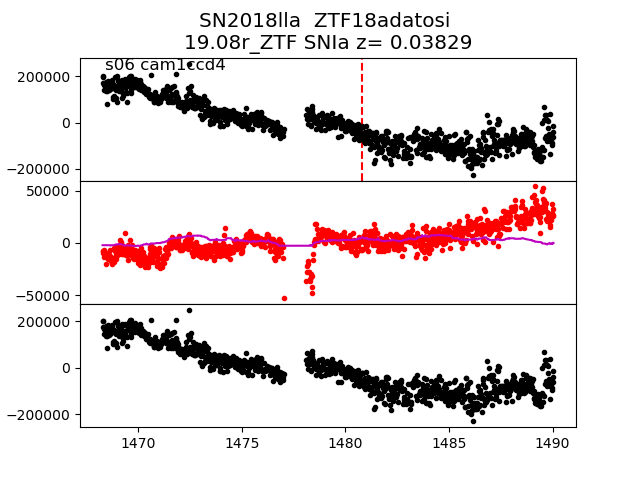
 2018lla
 2018ksr
 2018kwo
 2019jom
 2018lab
 2018kcu
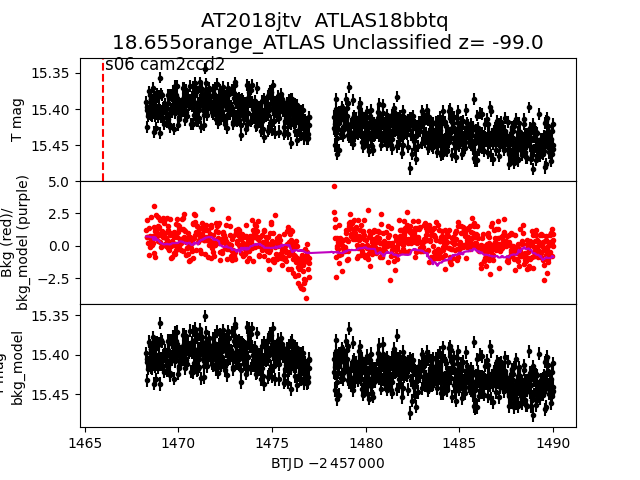
 2018jtv
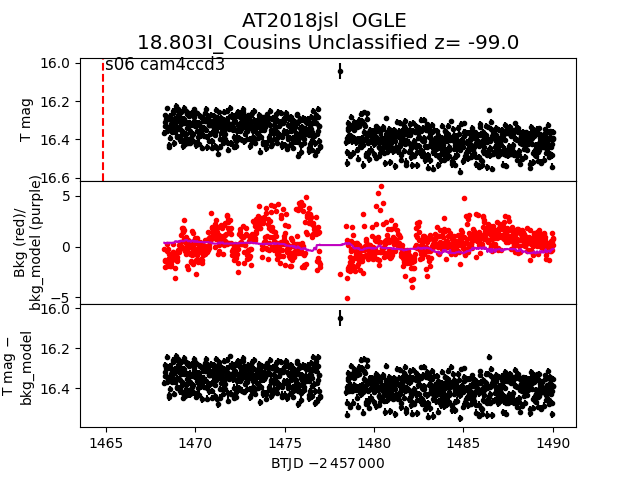
 2018jsl
 2018kfv_detrended
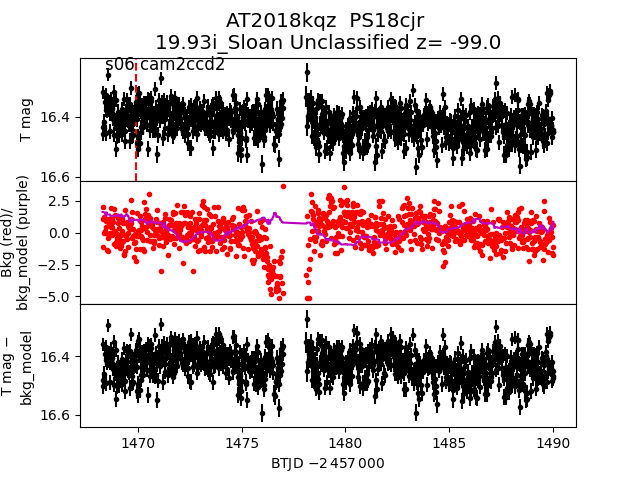
 2018kqz
 2018kvz
 2018lad
 2018knl
 2019fp
 2018kfv
 2019kt
 2018lml
 2018lot
 2018kib
 2018kao
 2018kqk
 2018jwi
 2018kuv
 2019cj
 2018kig
 2018lit
 2018ksi
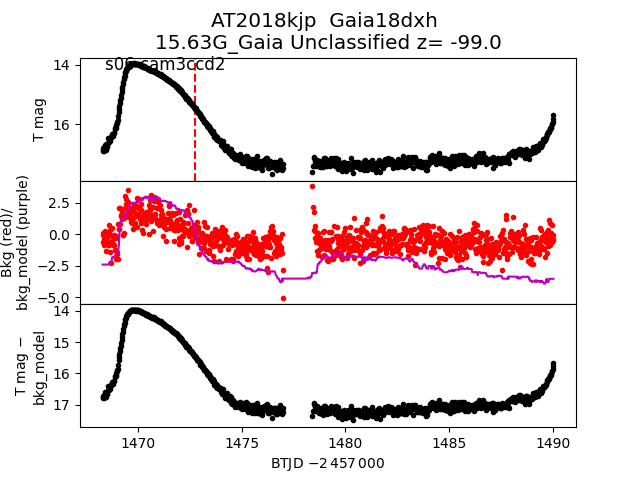
 2018kjp
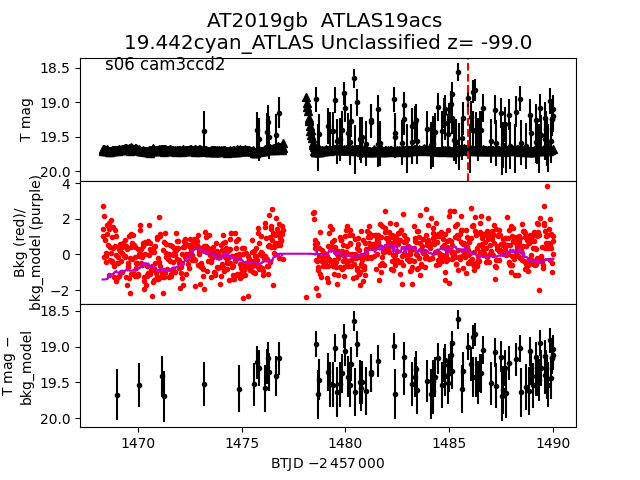
 2019gb
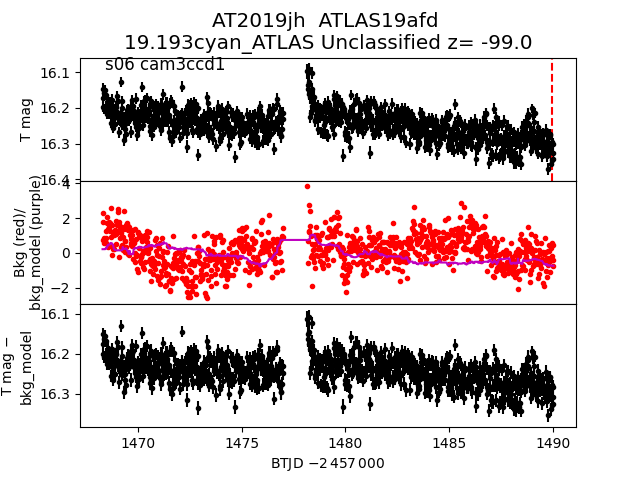
 2019jh
 2019coz
 2018kfv
 2018kuo
 2018kvr
 2019gn
 2018kbq
 2019gg
 2019iy
 2018kih
 2019kh
 2018kwm