all transients in sector05 (32 total)
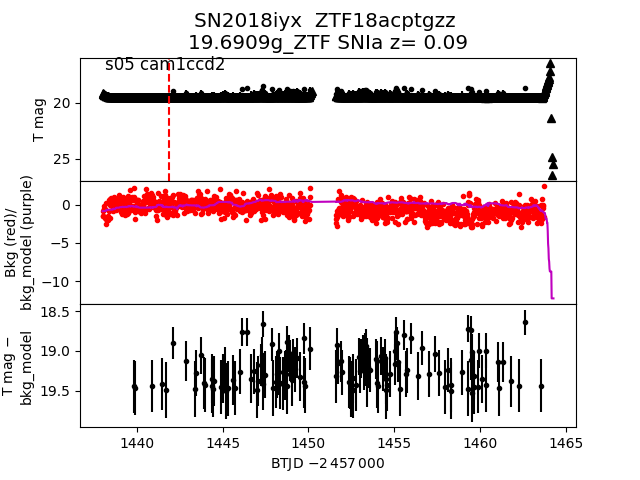
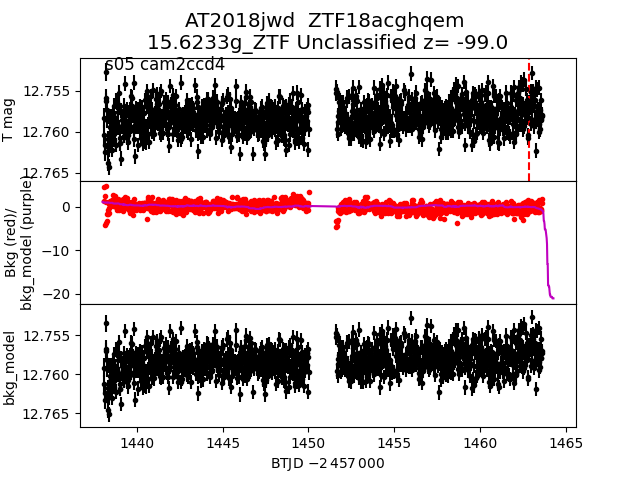
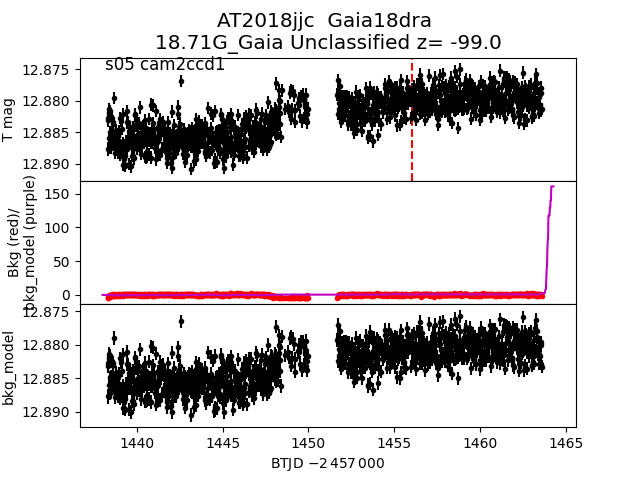
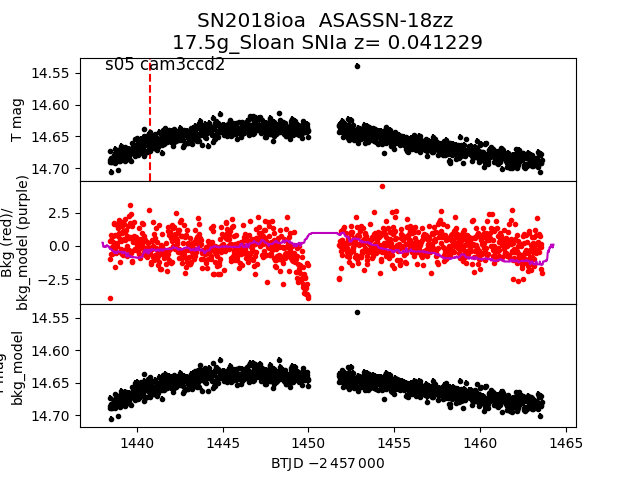
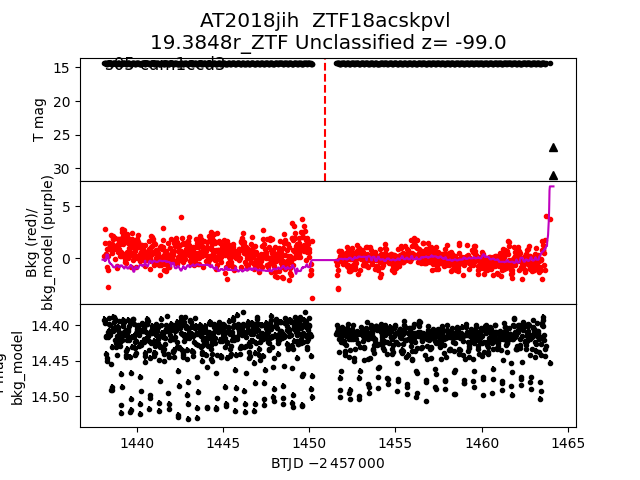
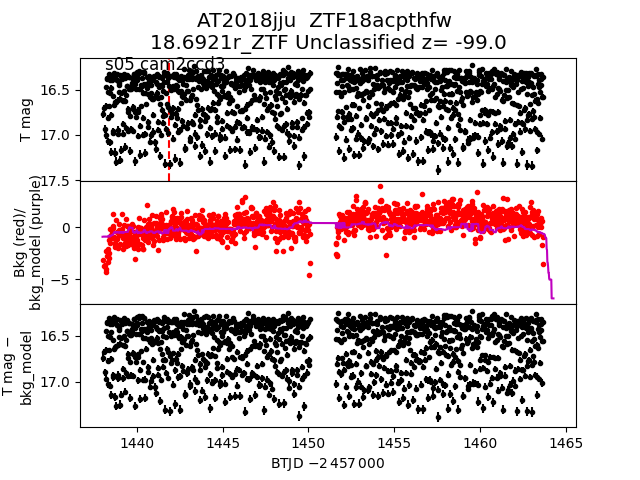
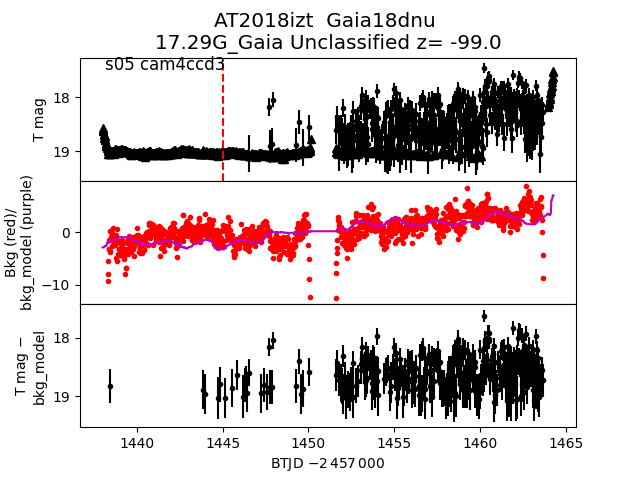
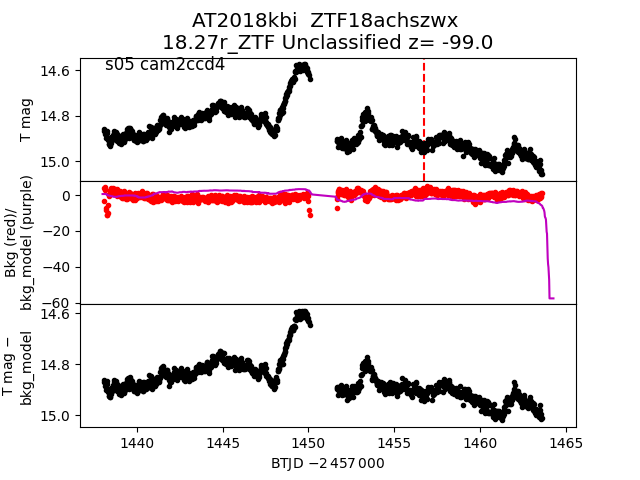
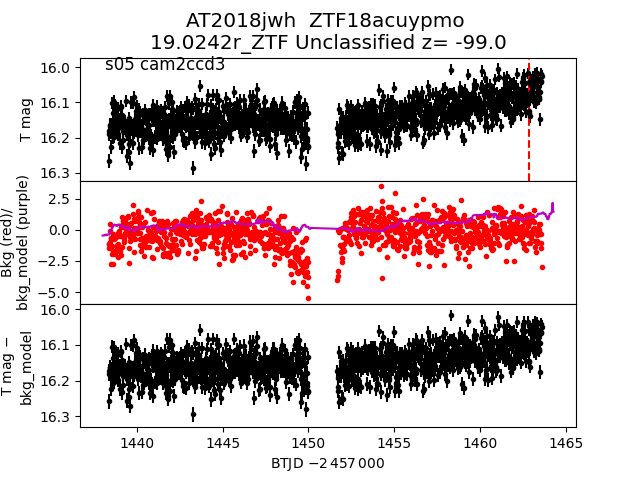
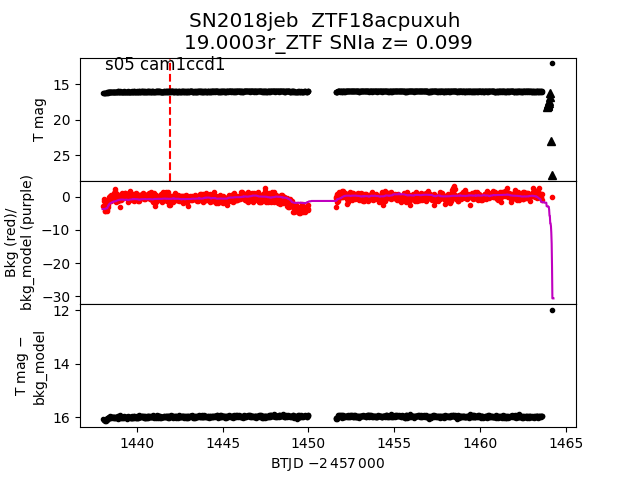
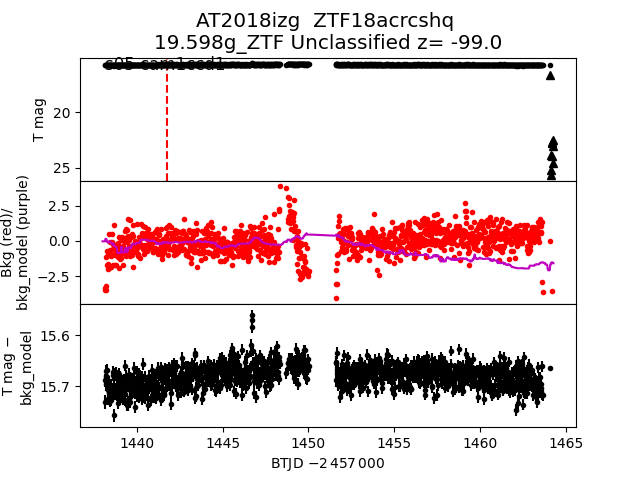
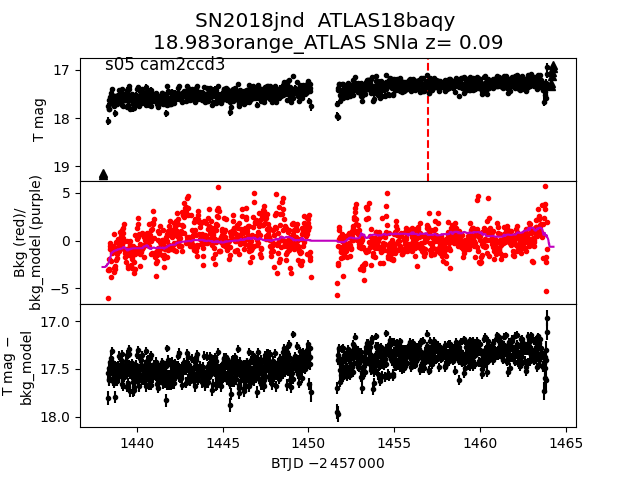
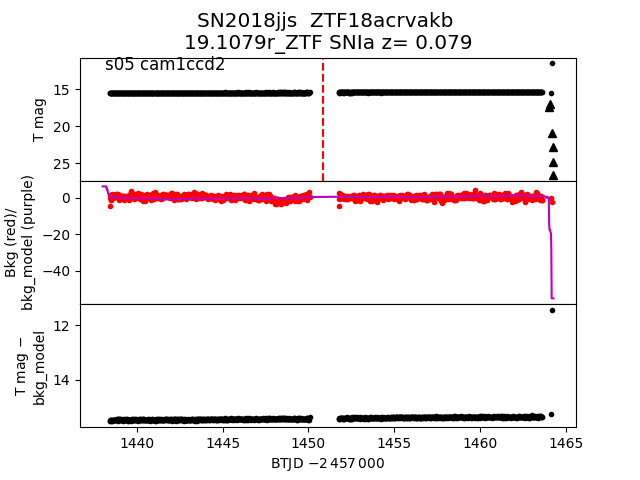
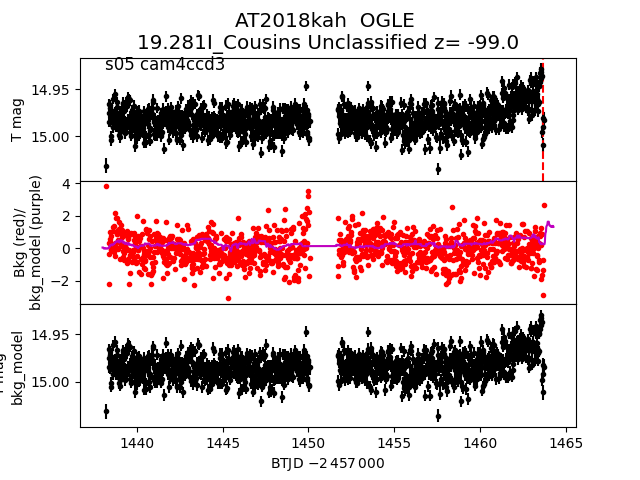
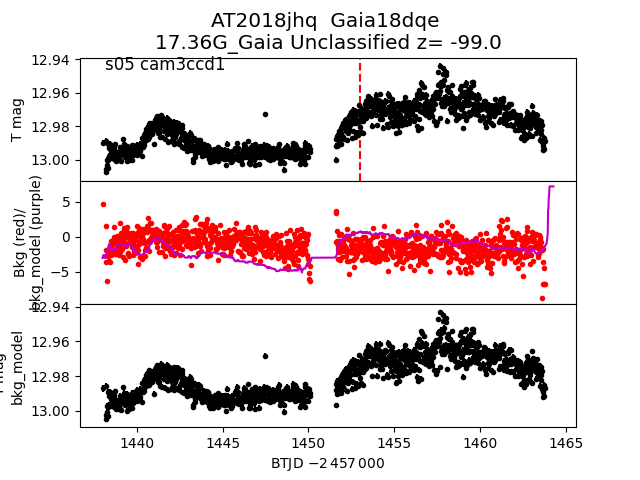
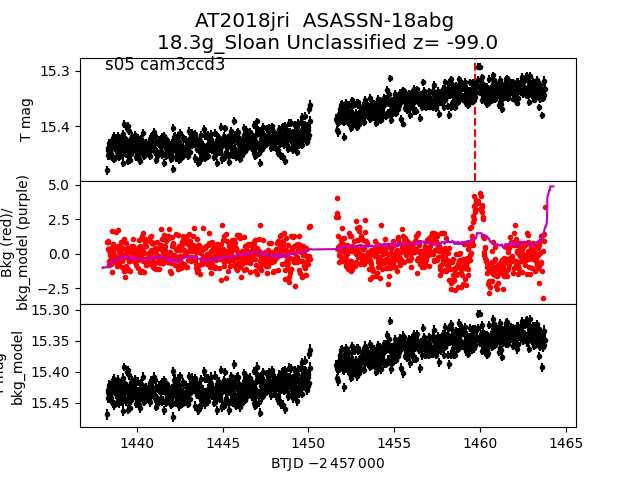
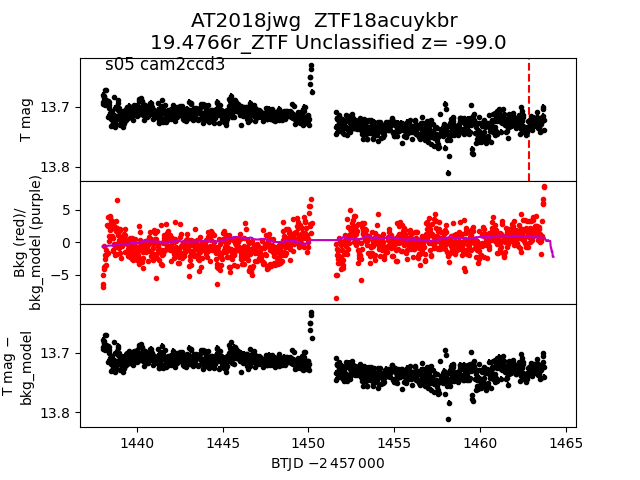
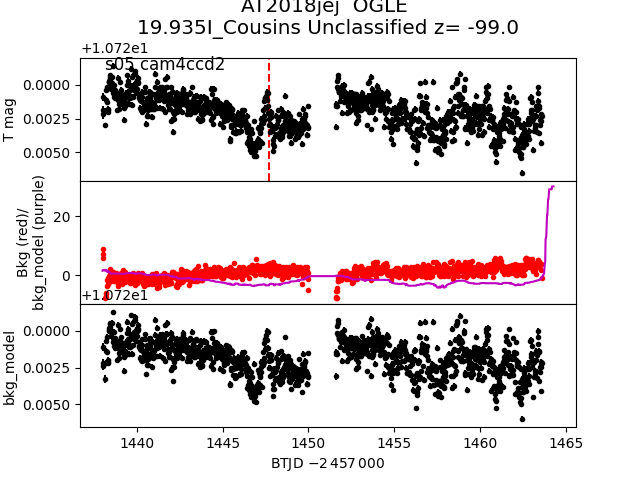
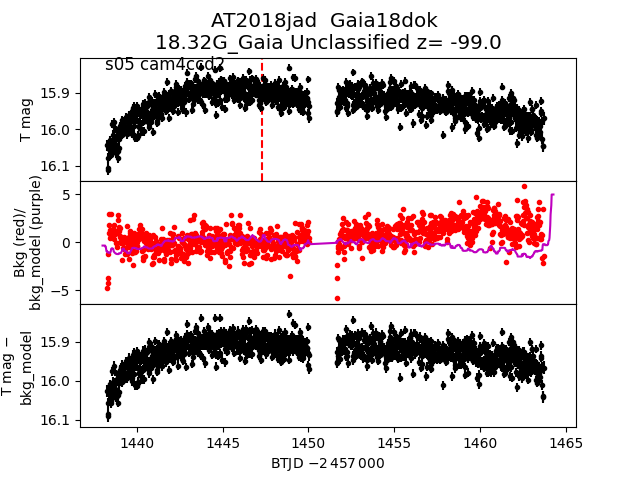
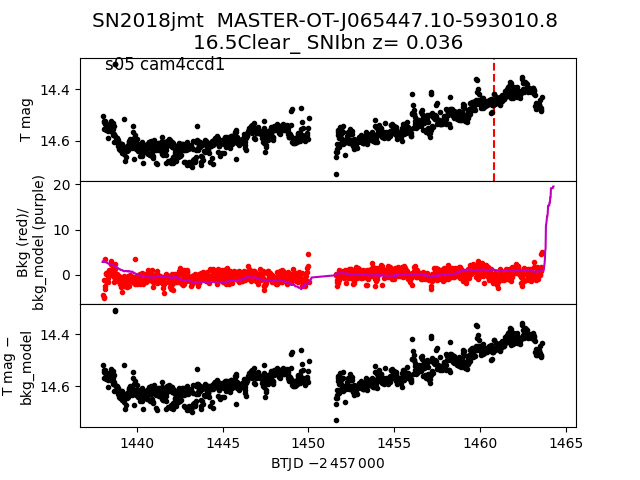
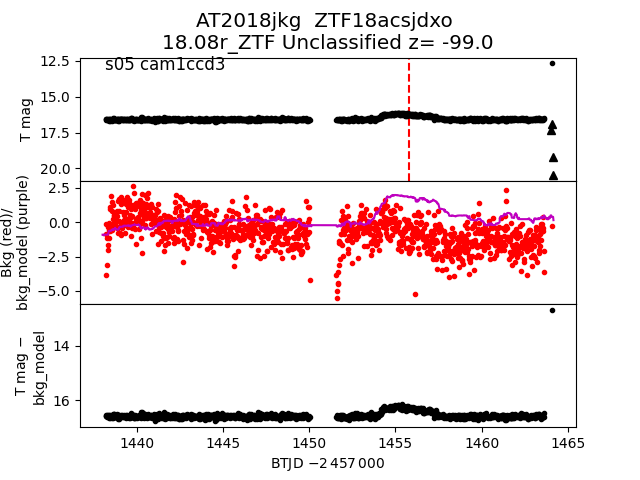
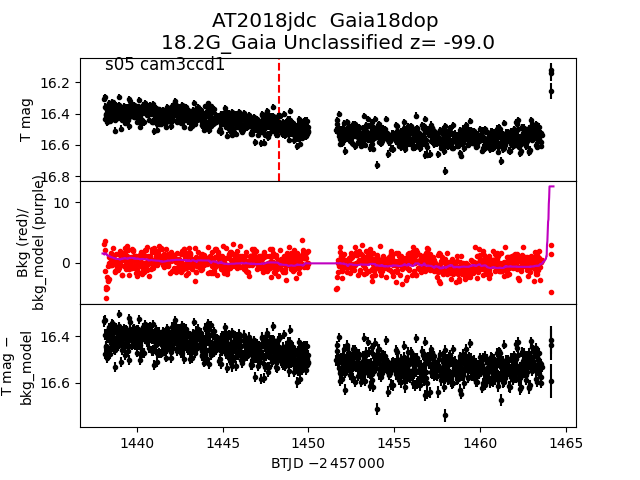
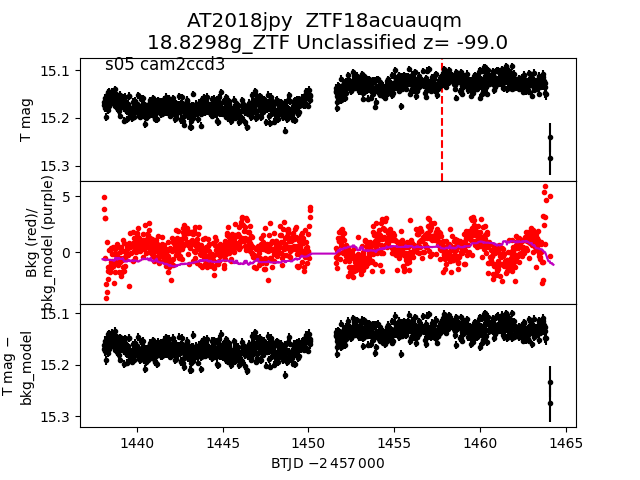
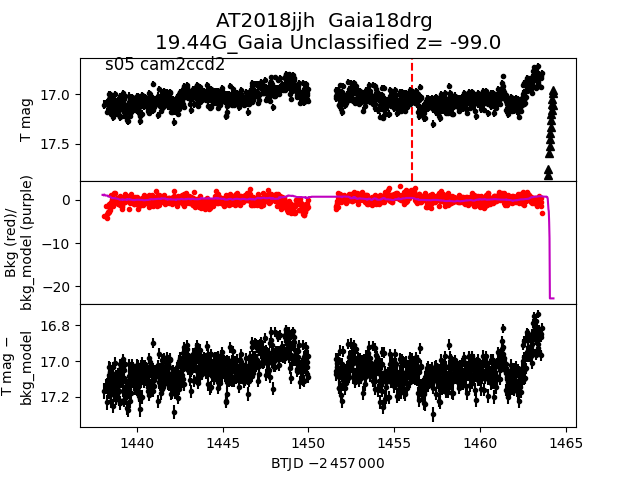
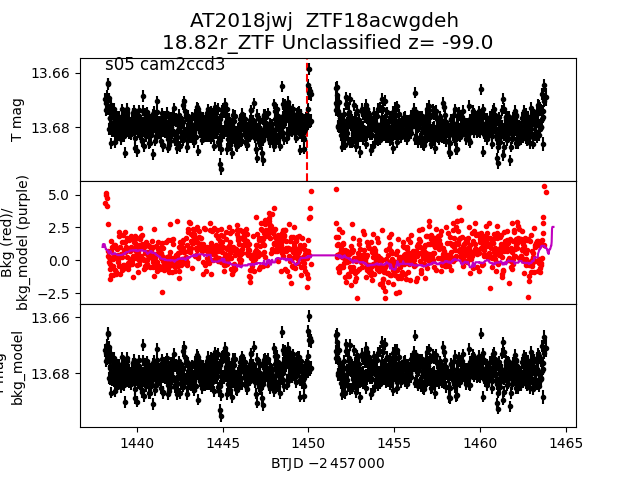
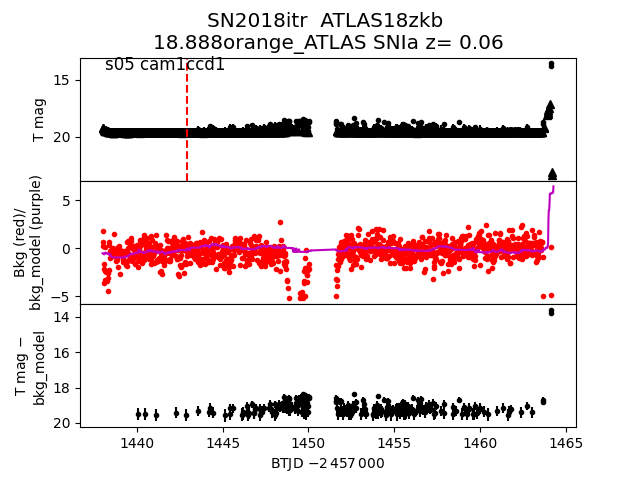
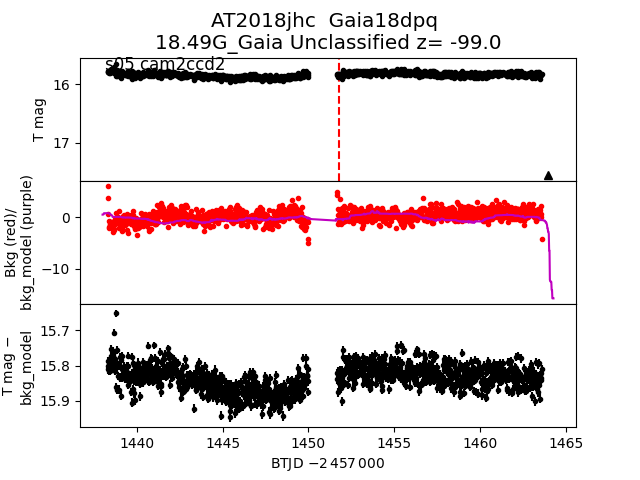
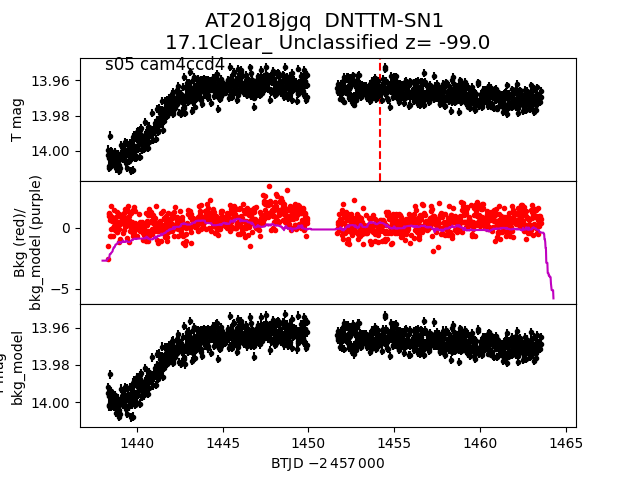
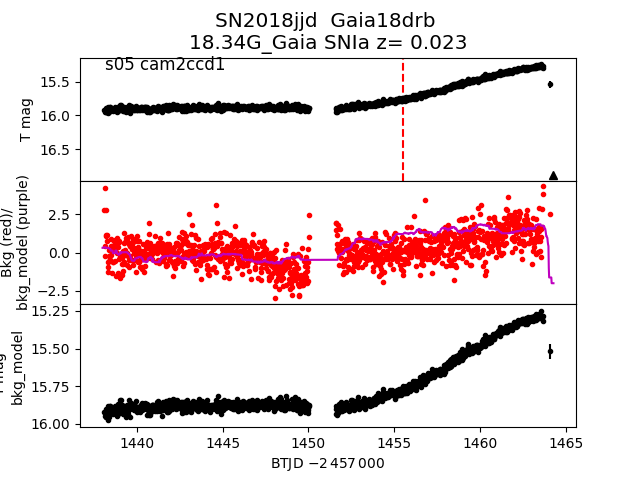
Each figure has three panels. The top panel shows the transient light curve, the middle panel shows the local background (estimated in an annulus), and the bottom panel shows a "background-model corrected" light curve. Details about the background model are in the README.
The vertical red line marks the time of discovery reported to TNS. Other useful metadata from TNS is in the figure title.
Note that the top and bottom panel are in magnitudes, while the middle panel is in differential flux units. The magnitudes are calibrated to the flux in the reference image used for image subtraction. Thus, flux from the host galaxy is included in these magnitudes.
3-sigma upper limits are plotted as triangles with no errorbars. A typical limiting magnitude is 19.6 in 30 minutes or 18.4 in 200 seconds (for low backgrounds).
The links allow you to download the light curve data as a text file.
More details in the README.
2018jwd
 2018jjc
 2018ioa
 2018jih
 2018jju
 2018izt
 2018kbi
 2018jwh
 2018jeb
 2018izg
 2018jnd
 2018jjs
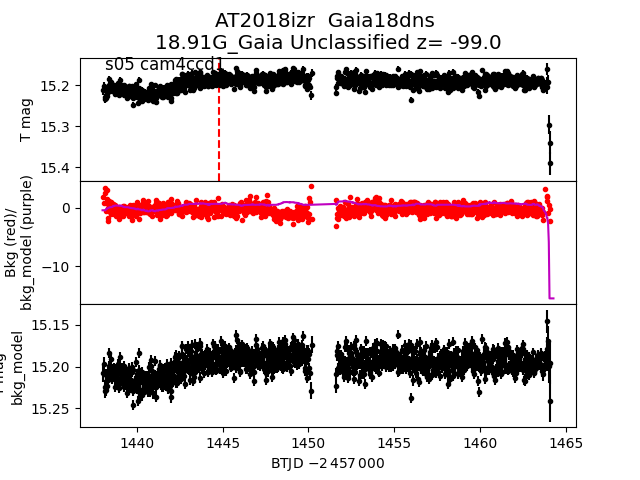
 2018izr
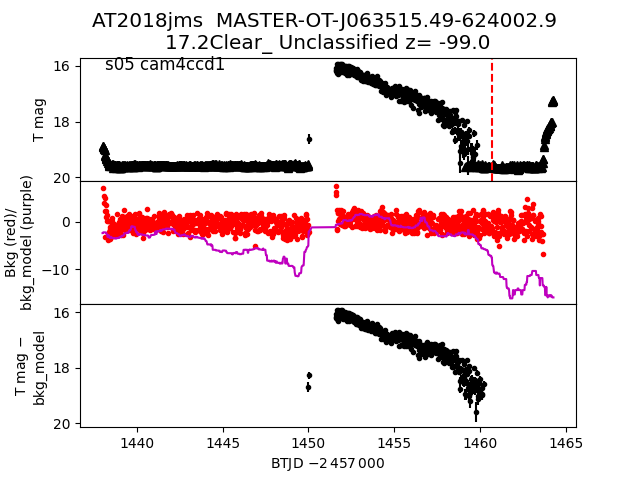
 2018jms
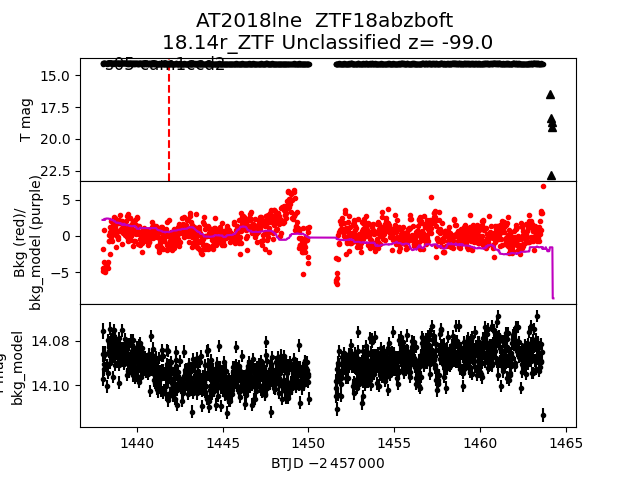
 2018lne
 2018kah
 2018jhq
 2018jri
 2018jwg
 2018jej
 2018jad
 2018jmt
 2018jkg
 2018jdc
 2018jpy
 2018jjh
 2018jwj
 2018itr
 2018jhc
 2018jgq
 2018jjd
 2018iyx