all transients in sector04 (41 total)
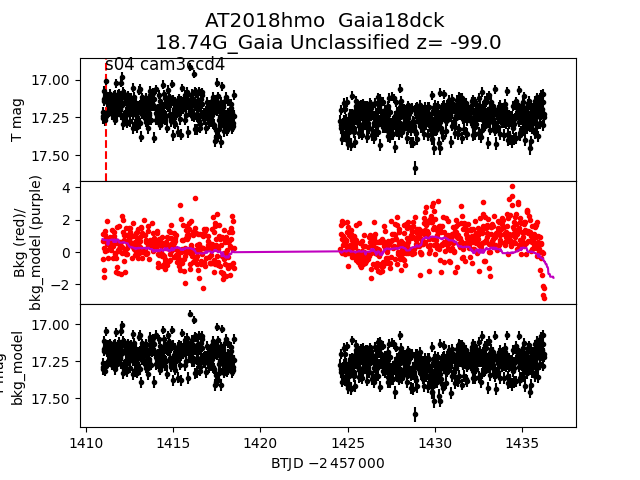
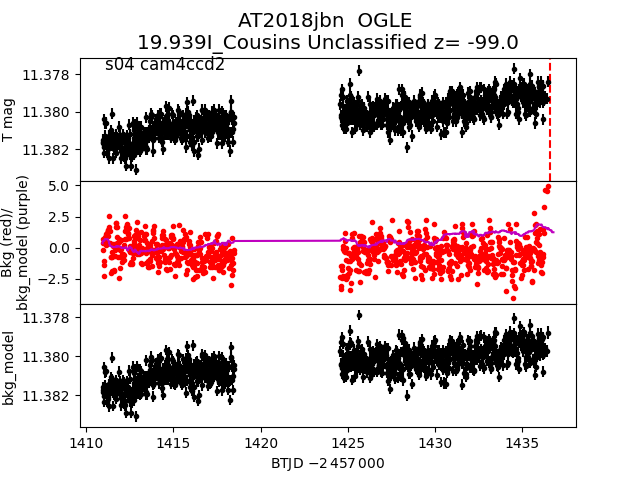
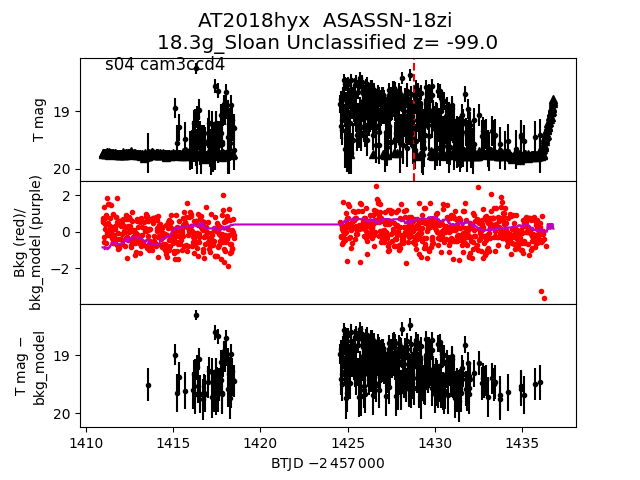
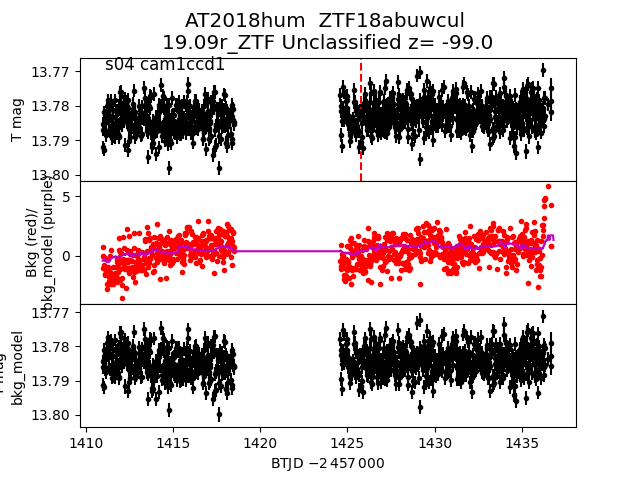
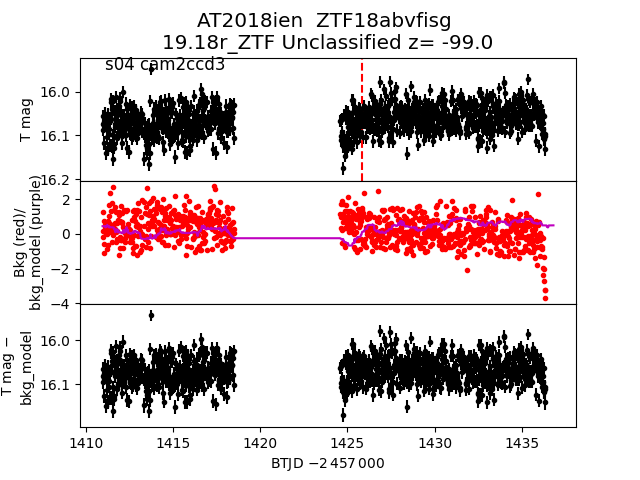
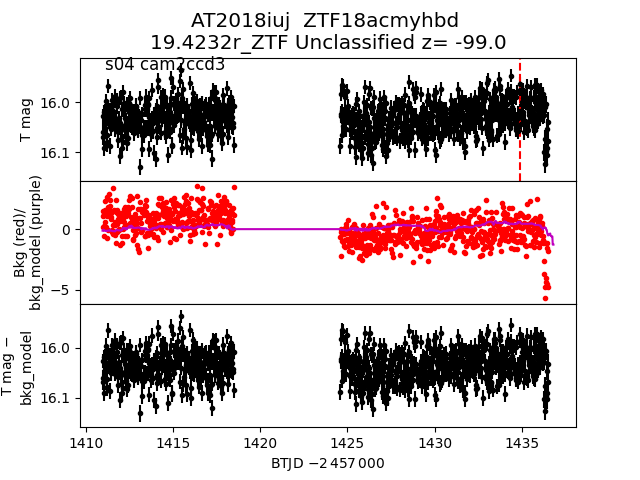
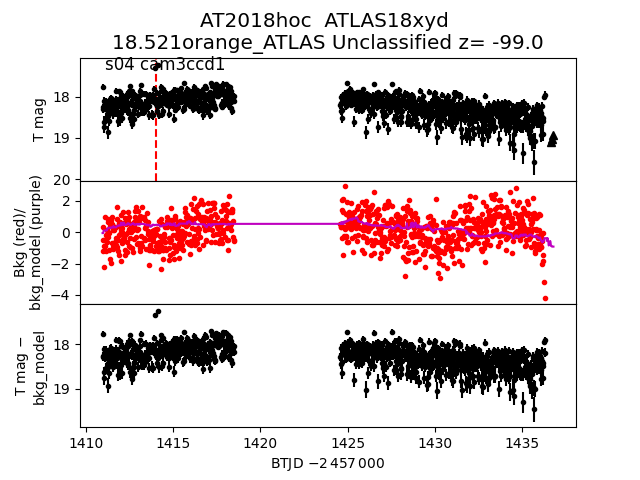
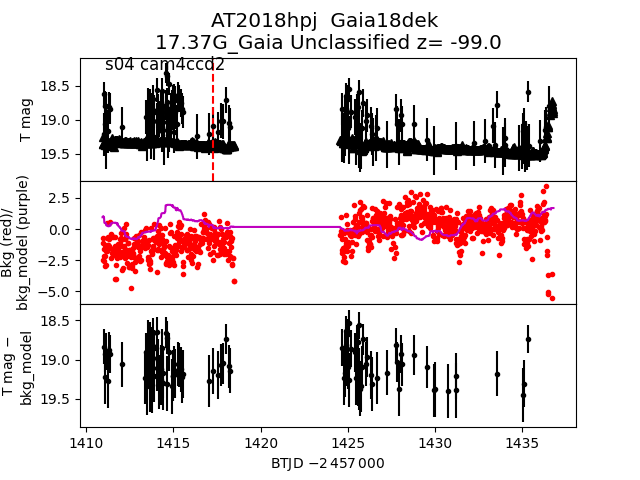
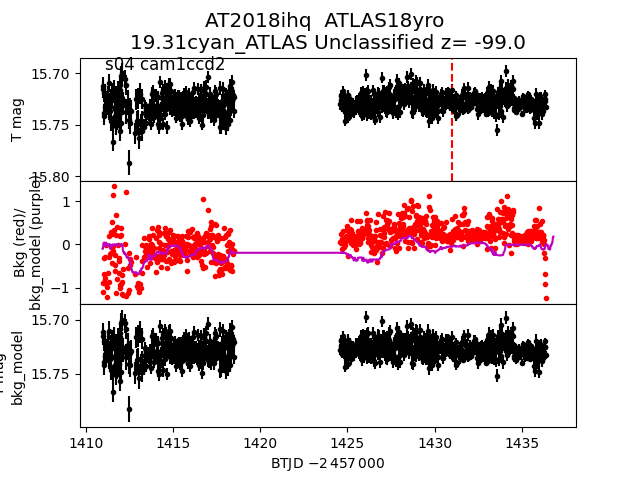
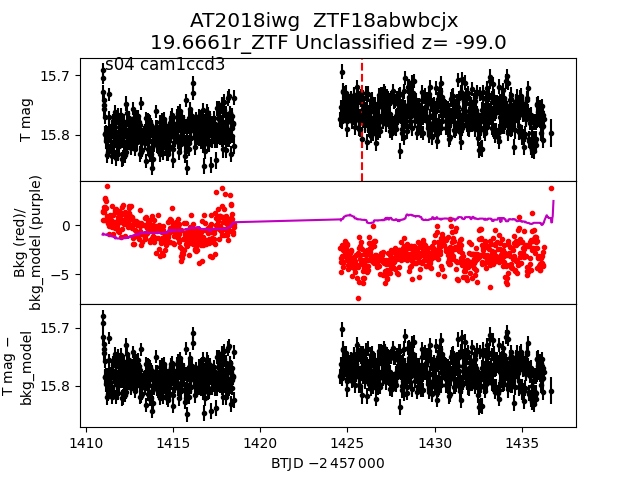
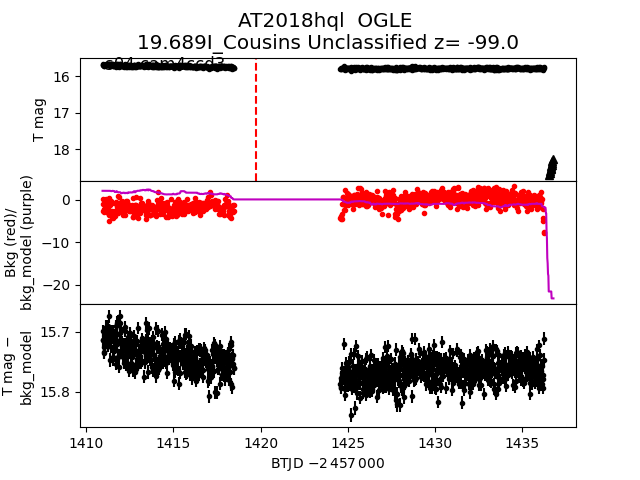
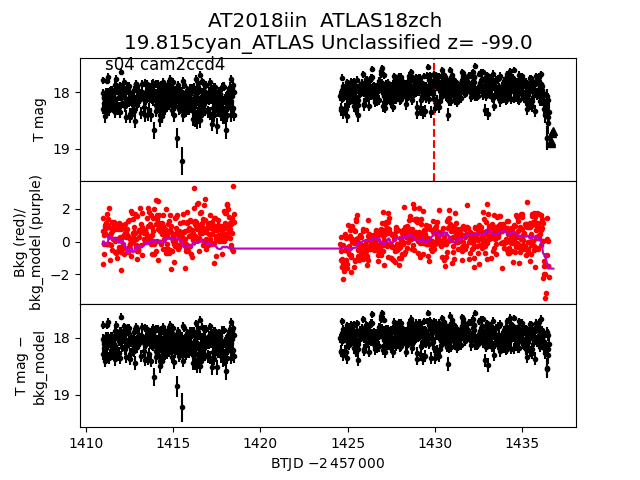
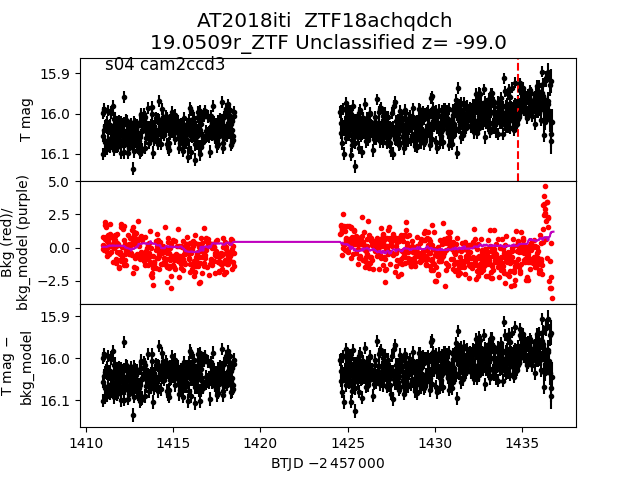
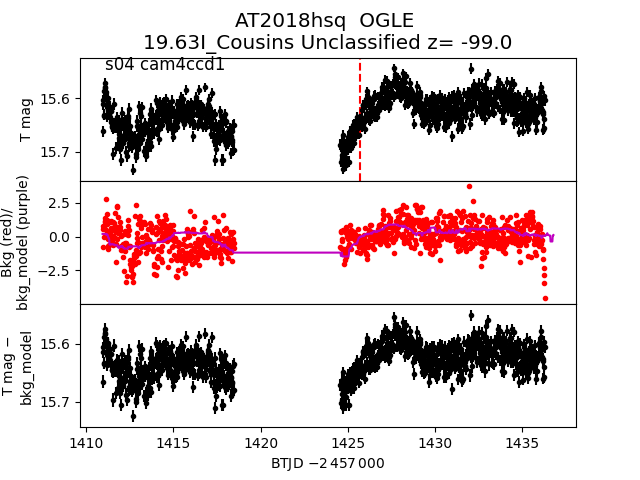
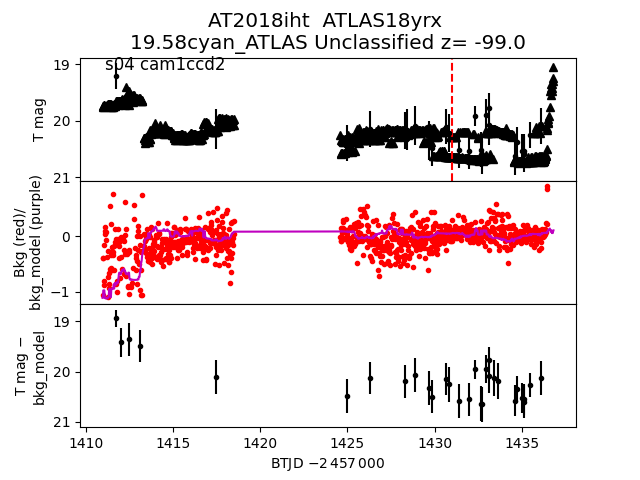
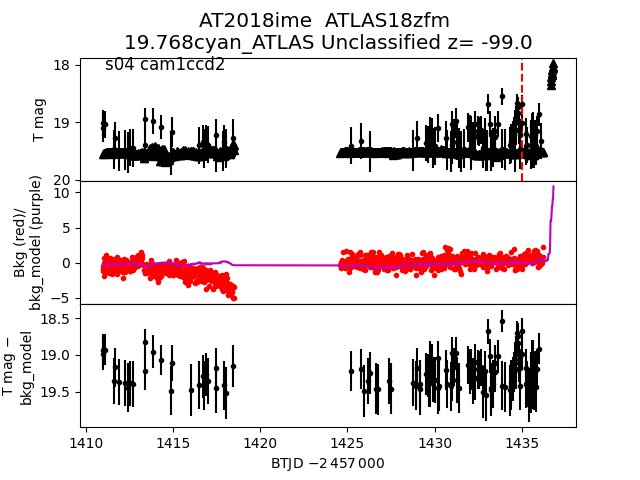
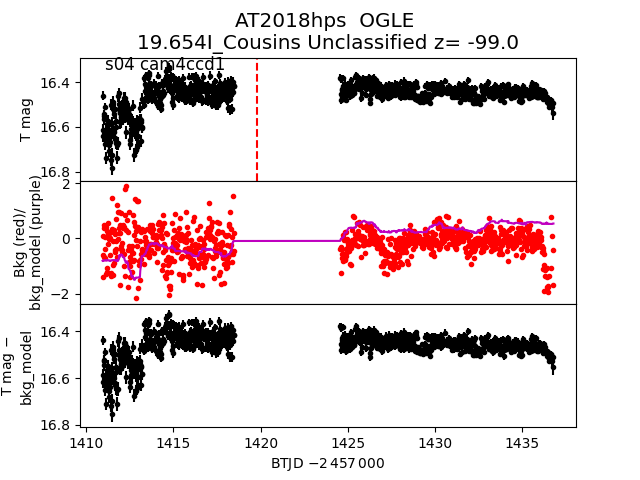
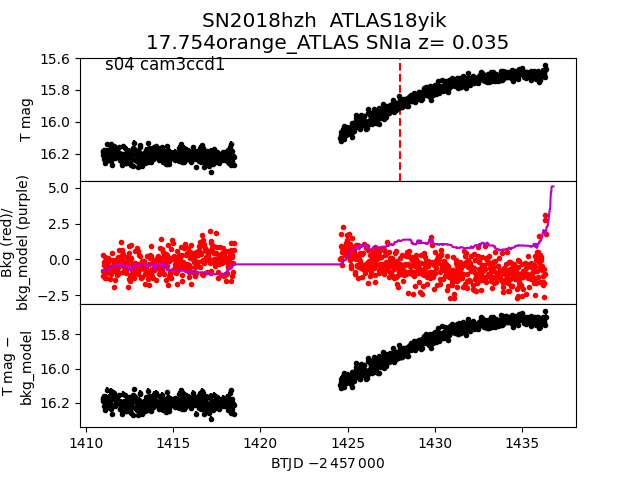
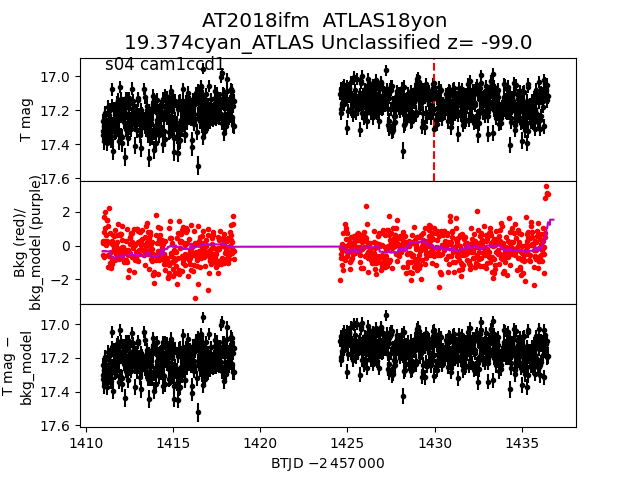
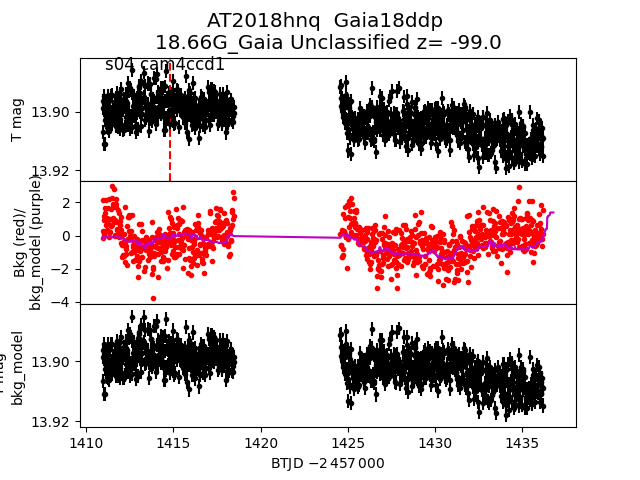
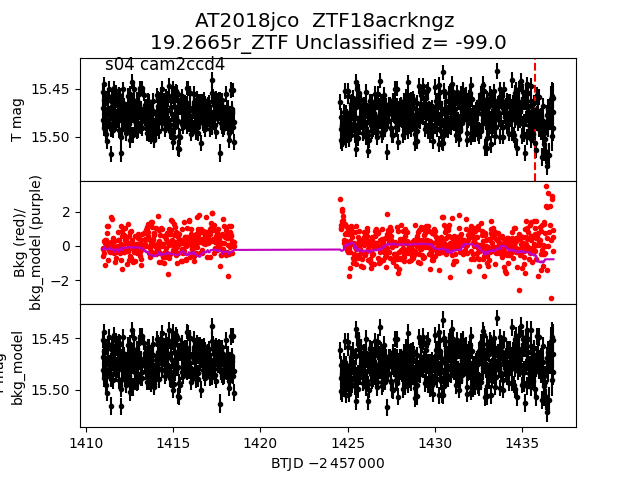
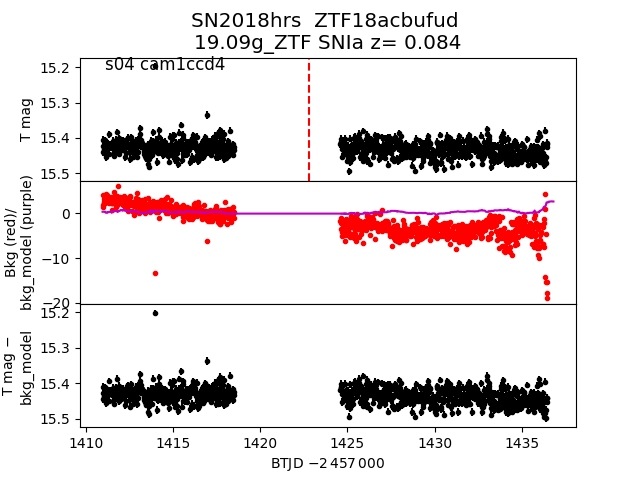
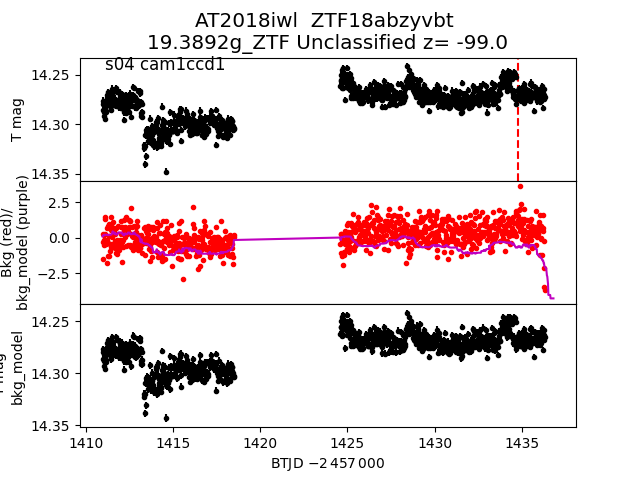
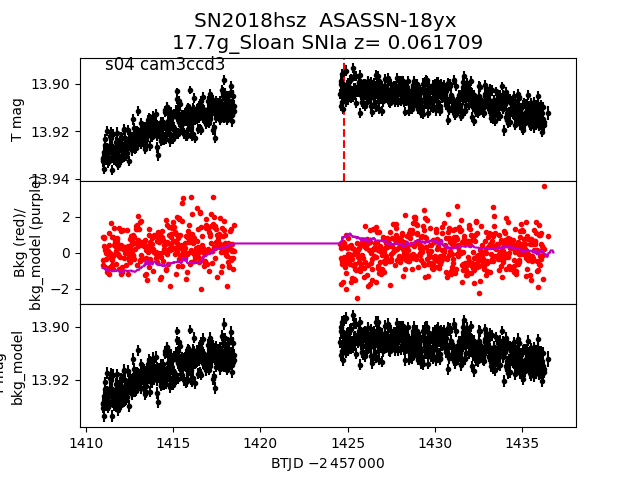
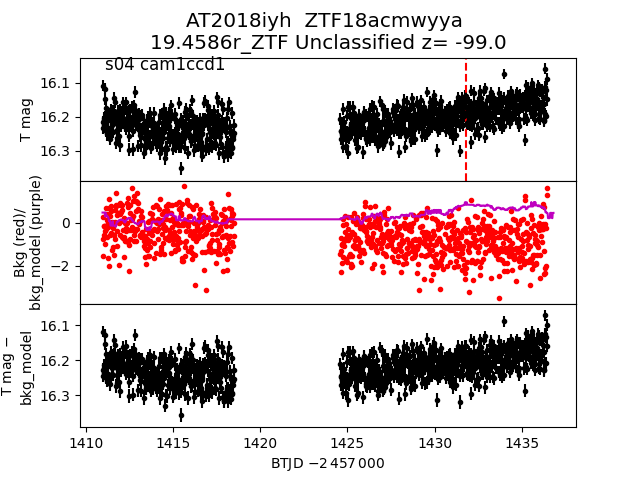
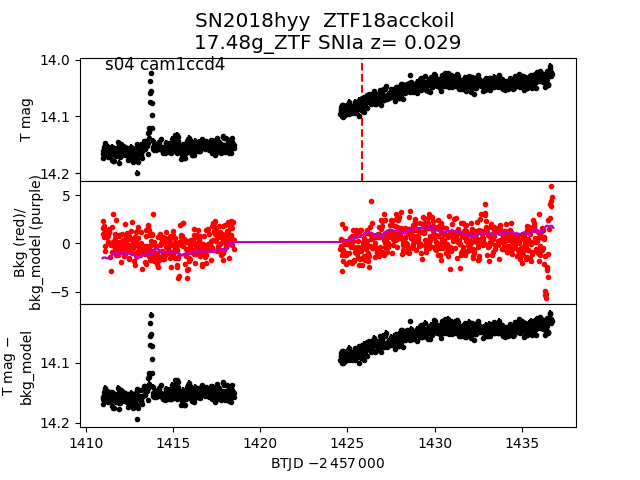
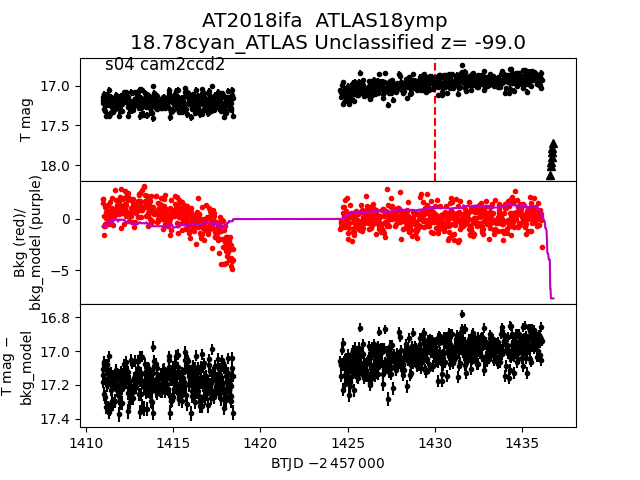
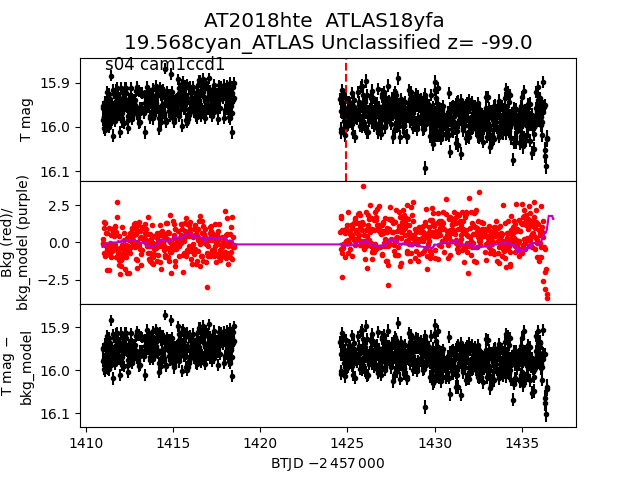
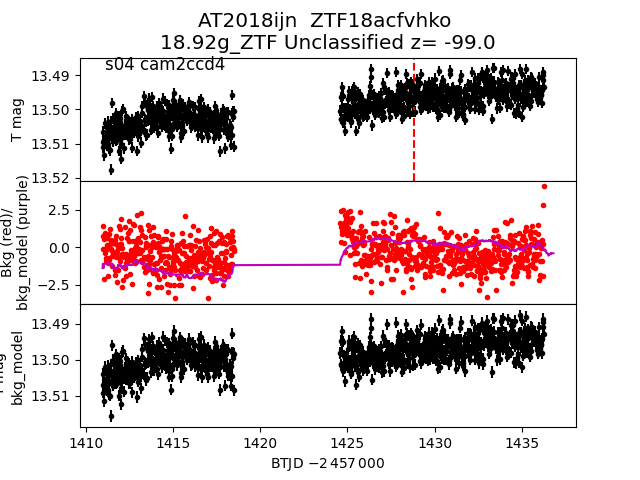
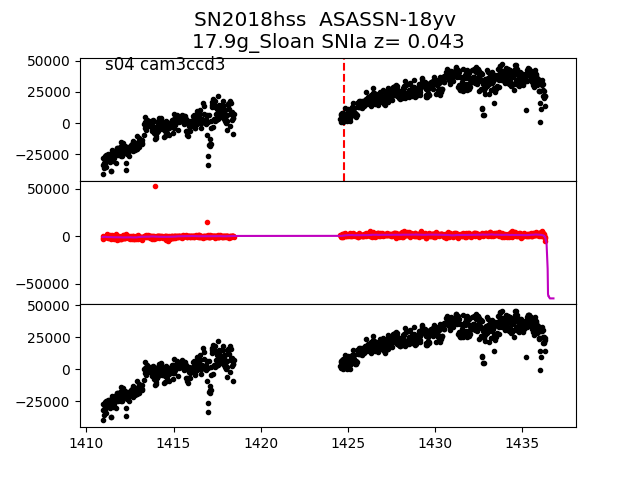
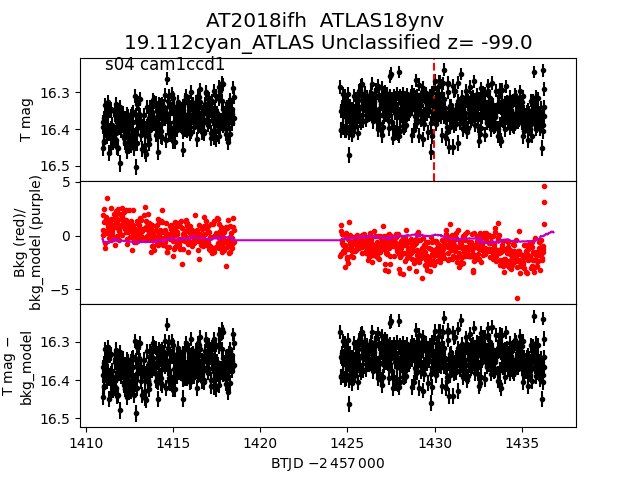
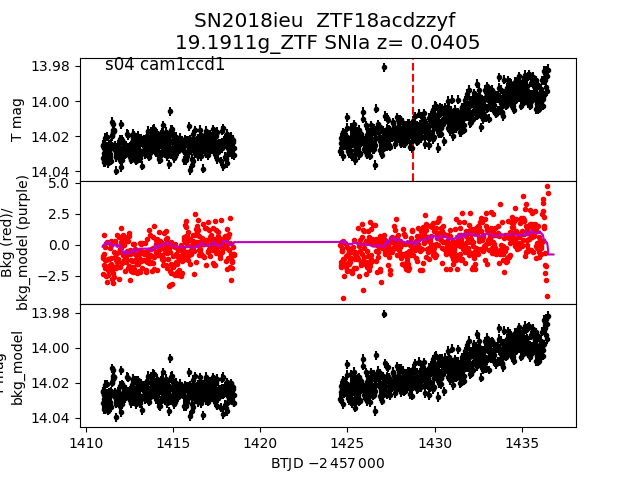
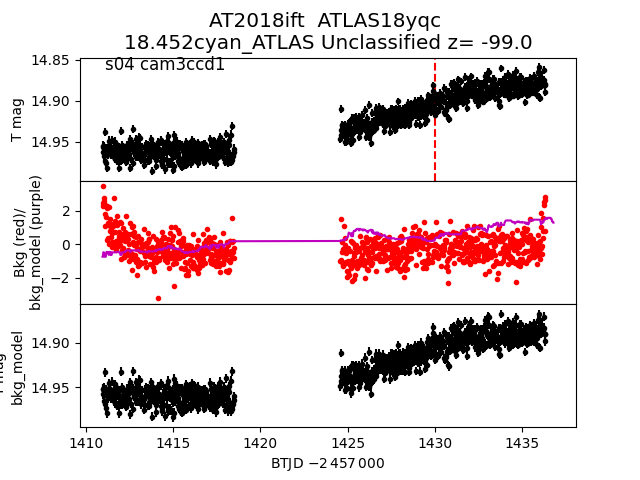
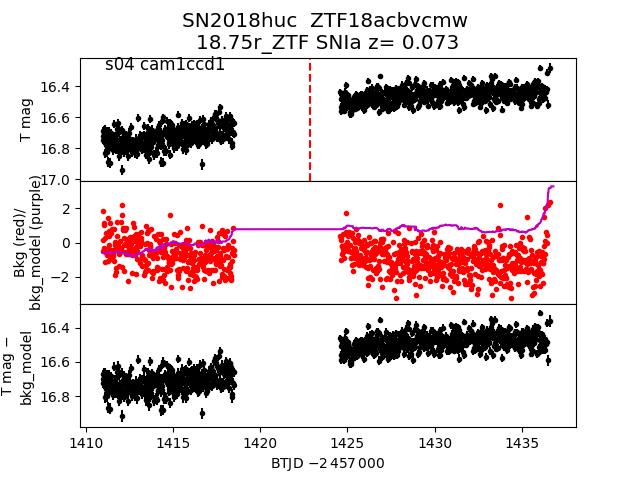
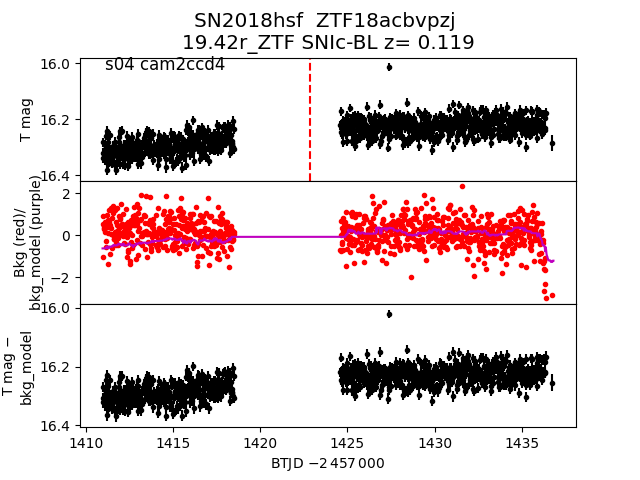
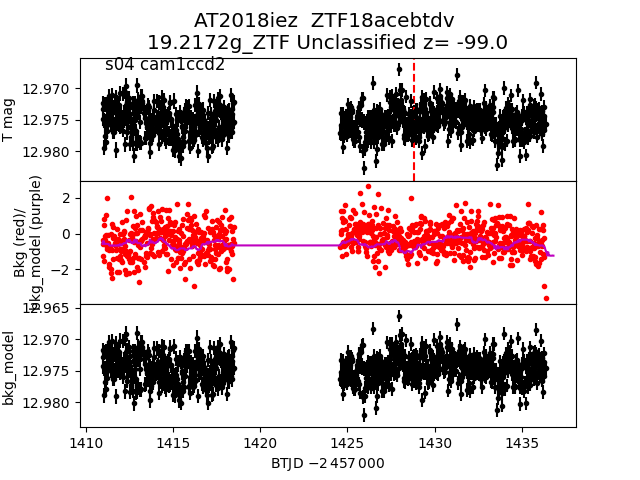
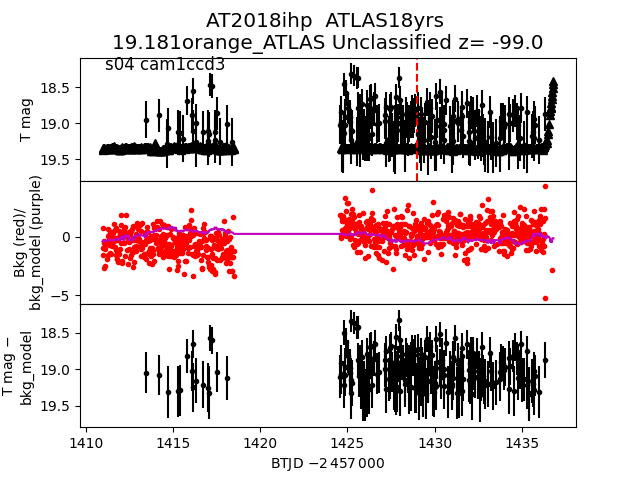
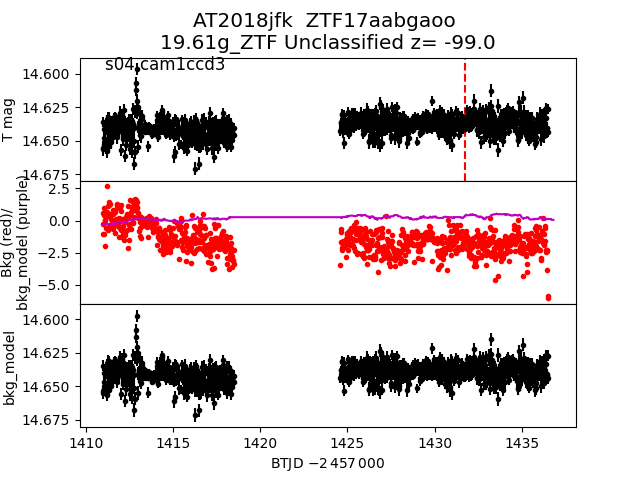
Each figure has three panels. The top panel shows the transient light curve, the middle panel shows the local background (estimated in an annulus), and the bottom panel shows a "background-model corrected" light curve. Details about the background model are in the README.
The vertical red line marks the time of discovery reported to TNS. Other useful metadata from TNS is in the figure title.
Note that the top and bottom panel are in magnitudes, while the middle panel is in differential flux units. The magnitudes are calibrated to the flux in the reference image used for image subtraction. Thus, flux from the host galaxy is included in these magnitudes.
3-sigma upper limits are plotted as triangles with no errorbars. A typical limiting magnitude is 19.6 in 30 minutes or 18.4 in 200 seconds (for low backgrounds).
The links allow you to download the light curve data as a text file.
More details in the README.
2018jbn
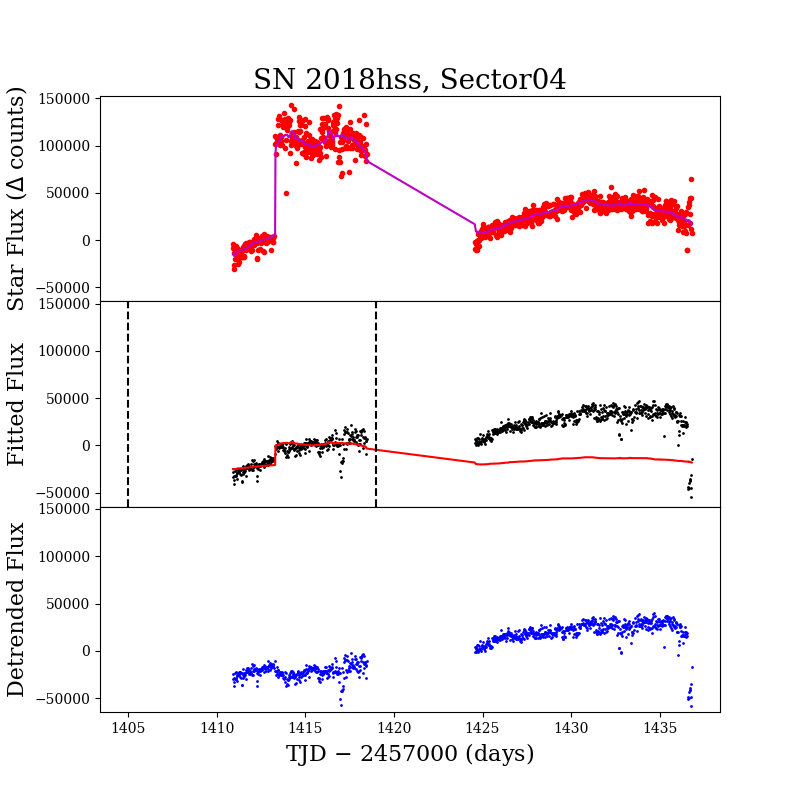
 2018hss_detrended
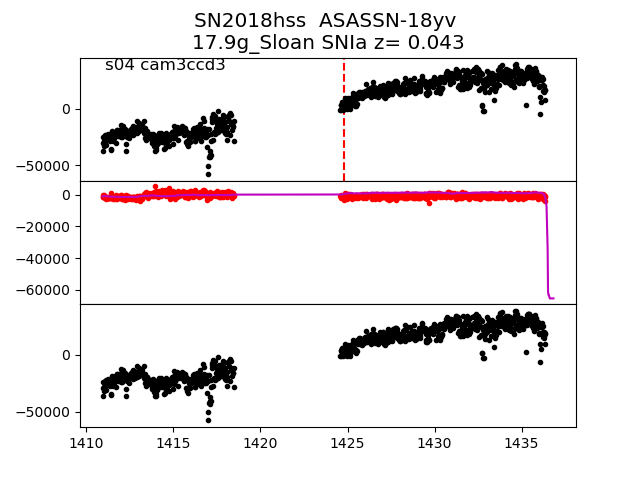 2018hss
 2018hyx
 2018hum
 2018ien
 2018iuj
 2018hoc
 2018hpj
 2018ihq
 2018iwg
 2018hql
 2018iin
 2018iti
 2018hsq
 2018iht
 2018ime
 2018hps
 2018hzh
 2018ifm
 2018hnq
 2018jco
 2018hrs
 2018iwl
 2018hsz
 2018iyh
 2018hyy
 2018ifa
 2018hte
 2018ijn
 2018hss
 2018ifh
 2018ieu
 2018ift
 2018huc
 2018hsf
 2018hpd
 2018iez
 2018ihp
 2018jfk
 2018hmo