all transients in sector03 (28 total)
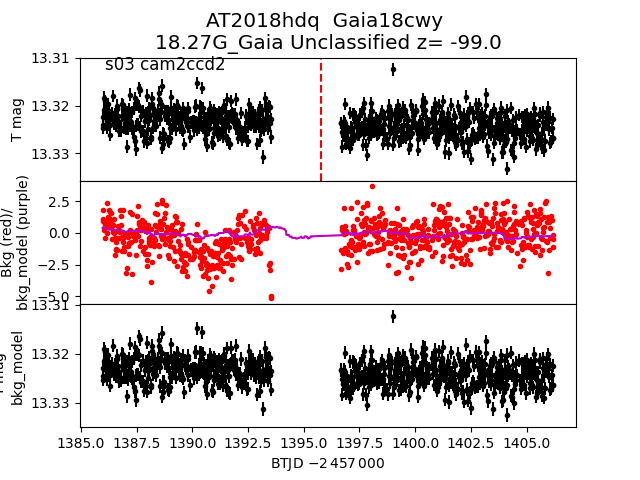
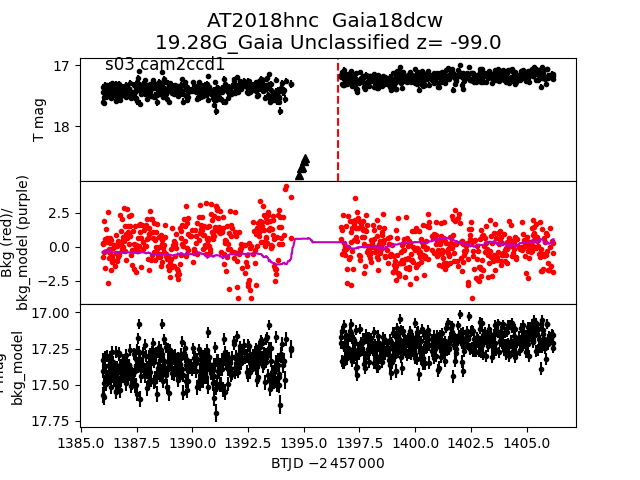
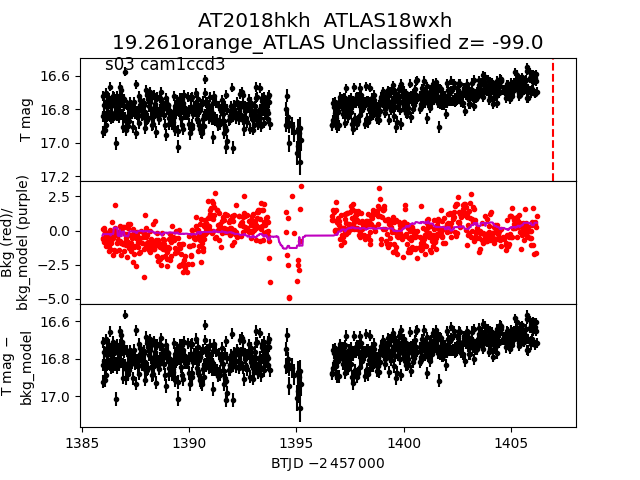
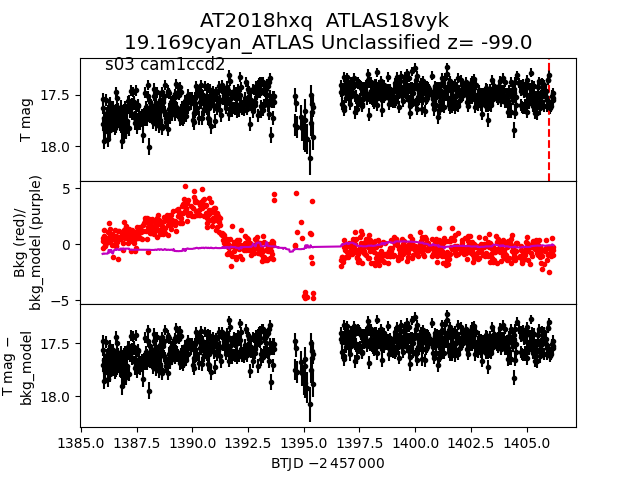
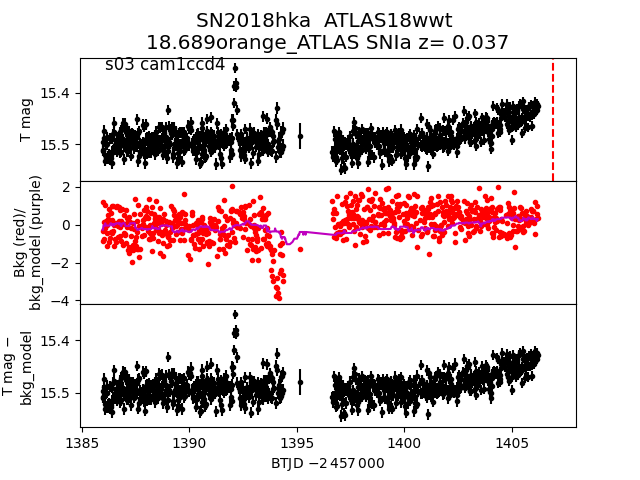
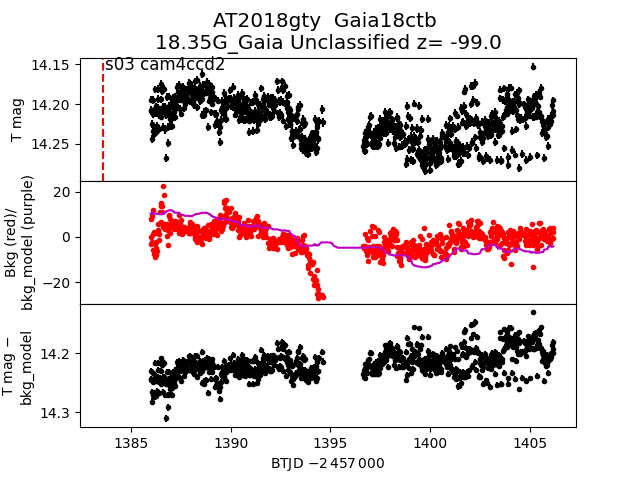
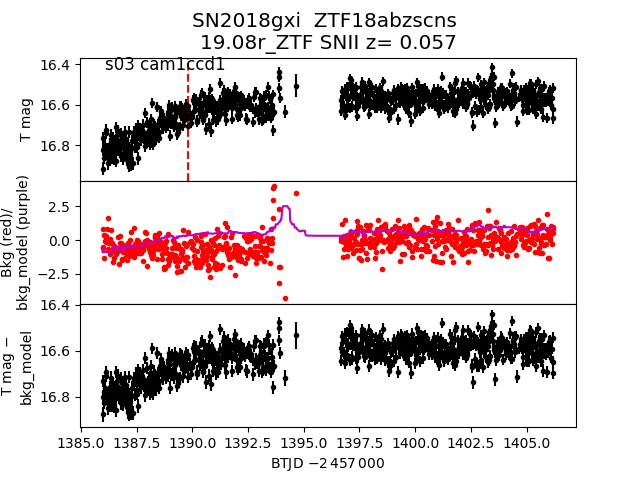
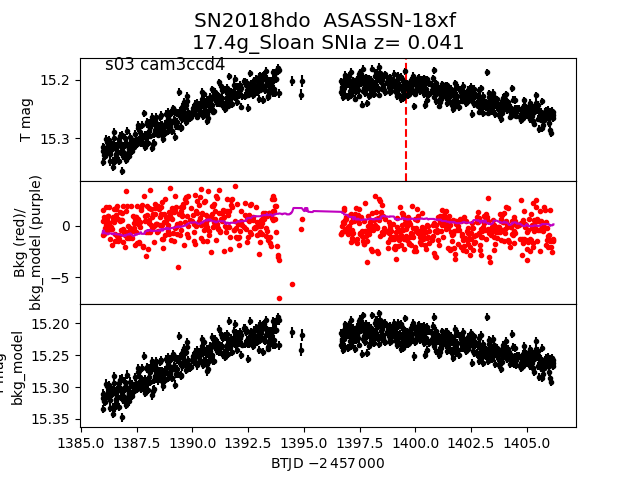
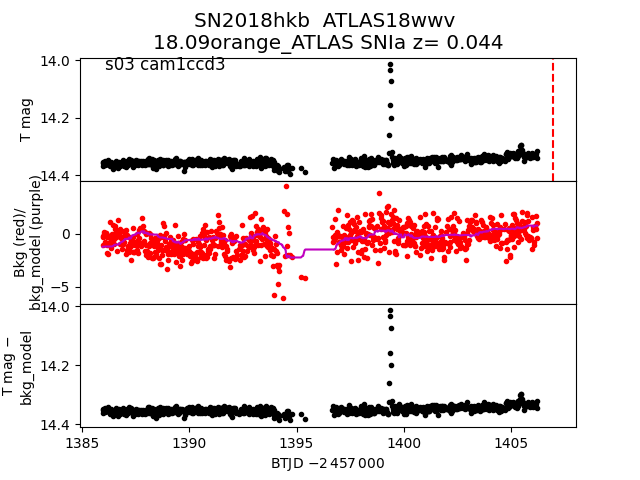
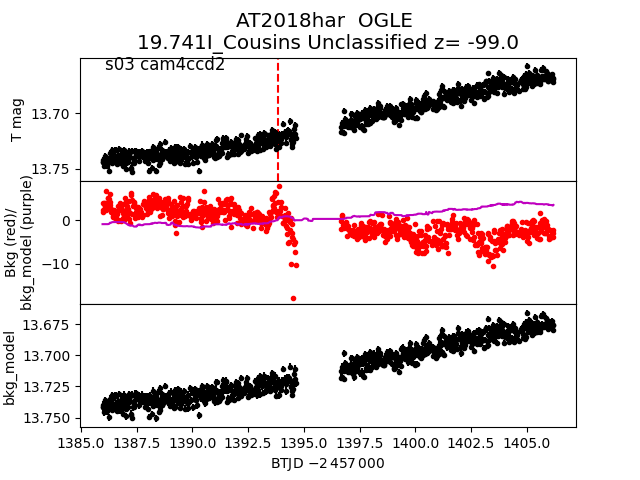
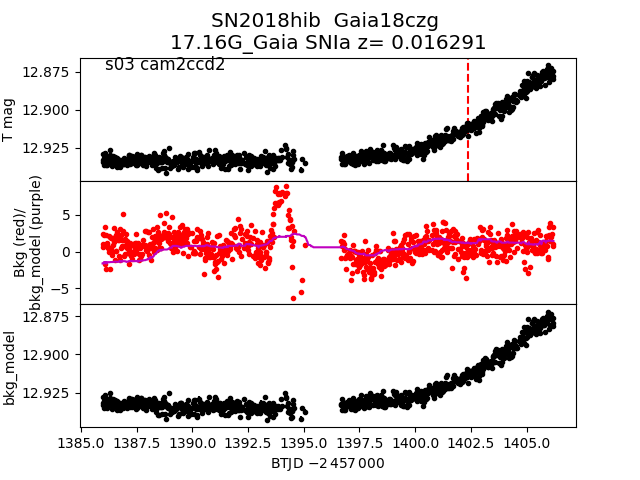
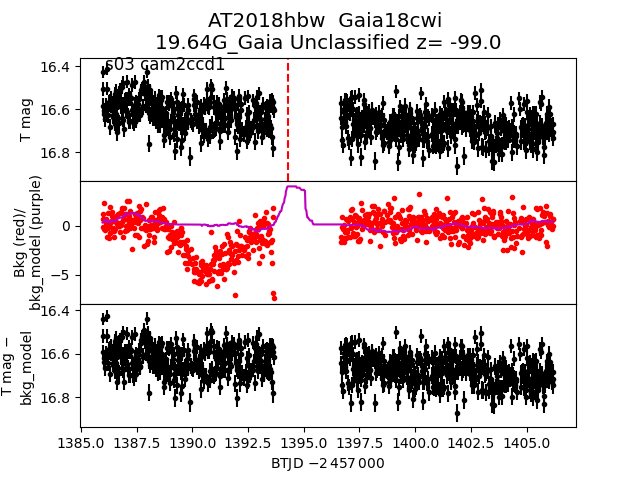
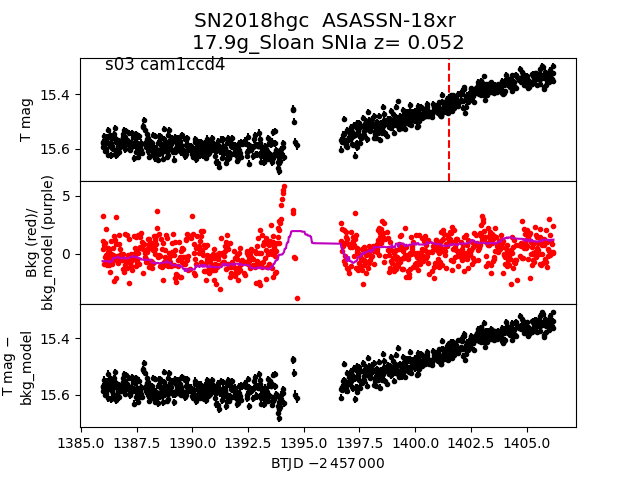
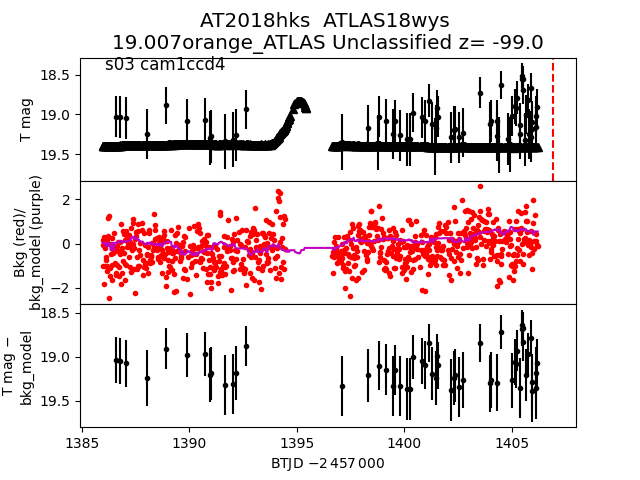
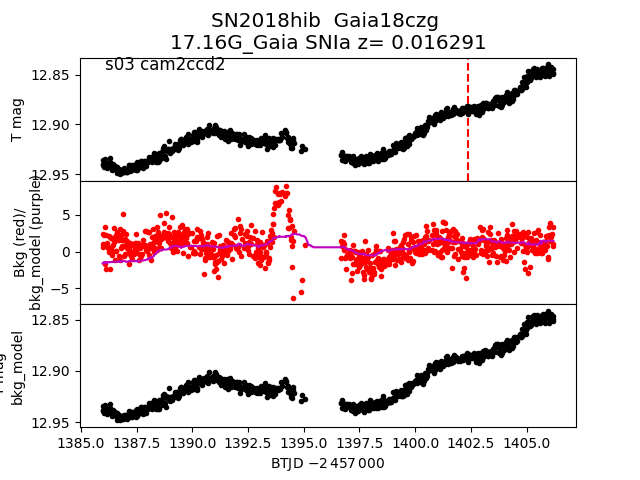
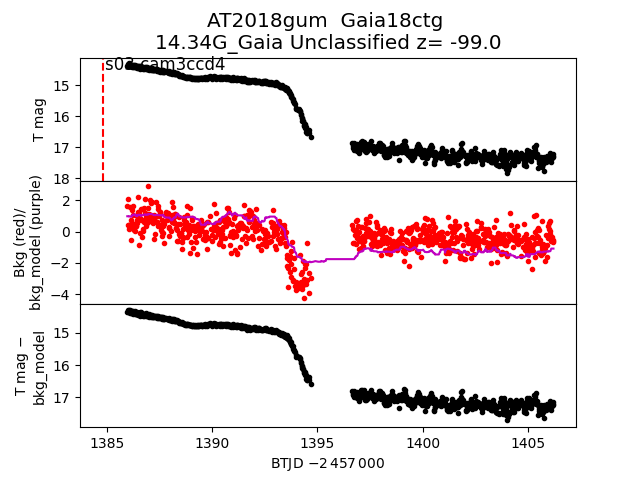
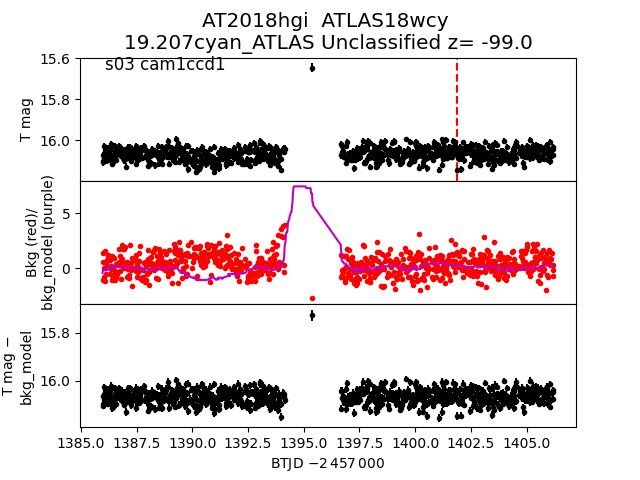
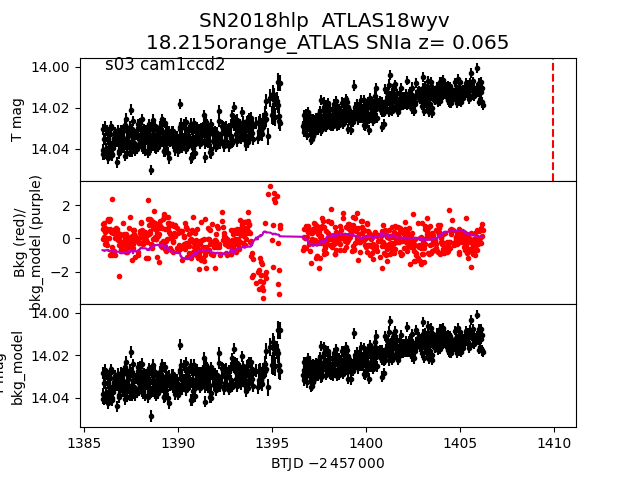
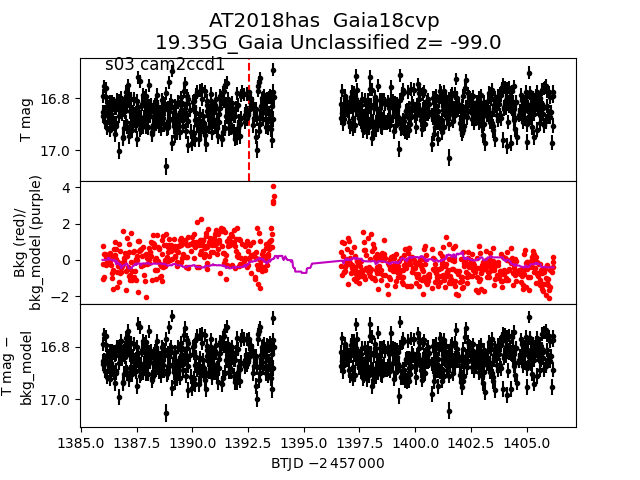
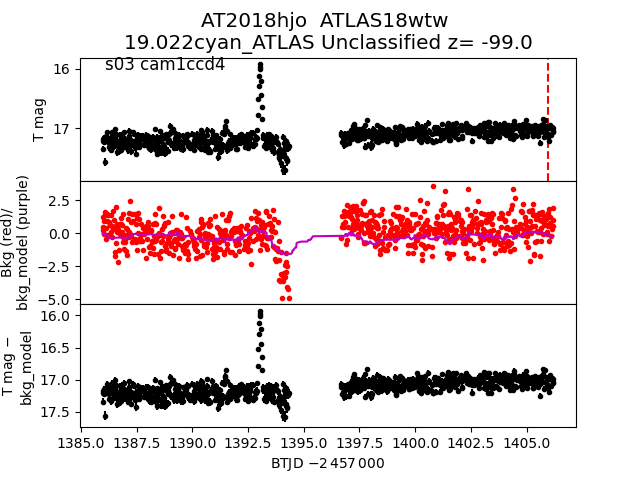
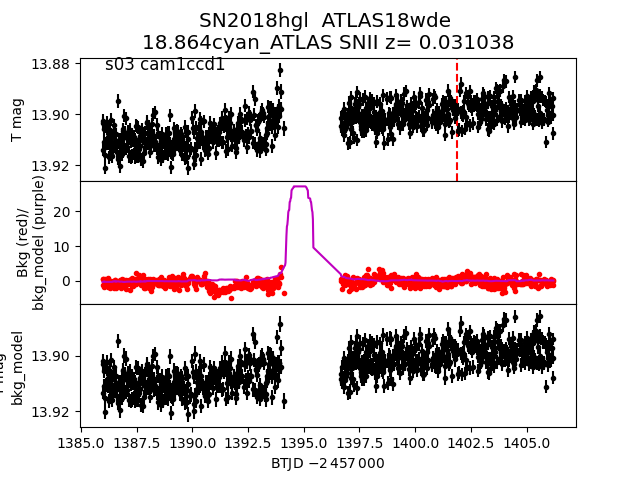
Each figure has three panels. The top panel shows the transient light curve, the middle panel shows the local background (estimated in an annulus), and the bottom panel shows a "background-model corrected" light curve. Details about the background model are in the README.
The vertical red line marks the time of discovery reported to TNS. Other useful metadata from TNS is in the figure title.
Note that the top and bottom panel are in magnitudes, while the middle panel is in differential flux units. The magnitudes are calibrated to the flux in the reference image used for image subtraction. Thus, flux from the host galaxy is included in these magnitudes.
3-sigma upper limits are plotted as triangles with no errorbars. A typical limiting magnitude is 19.6 in 30 minutes or 18.4 in 200 seconds (for low backgrounds).
The links allow you to download the light curve data as a text file.
More details in the README.
2018hnc
 2018hkh
 2018hxq
 2018hka
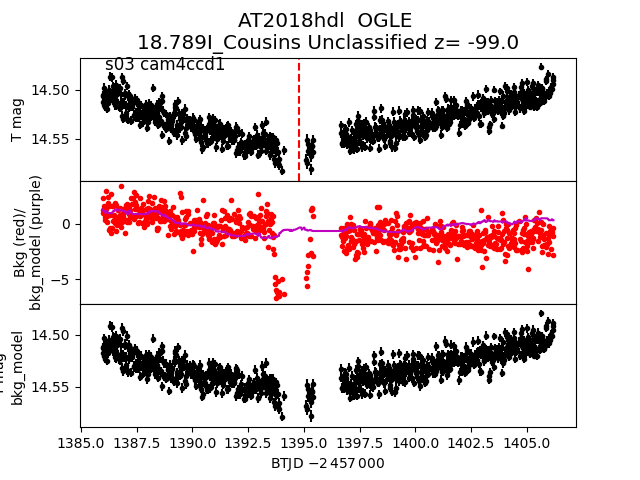
 2018hdl
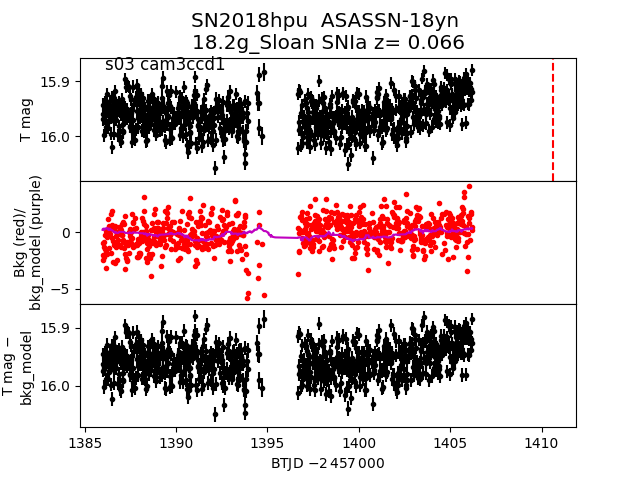
 2018hpu
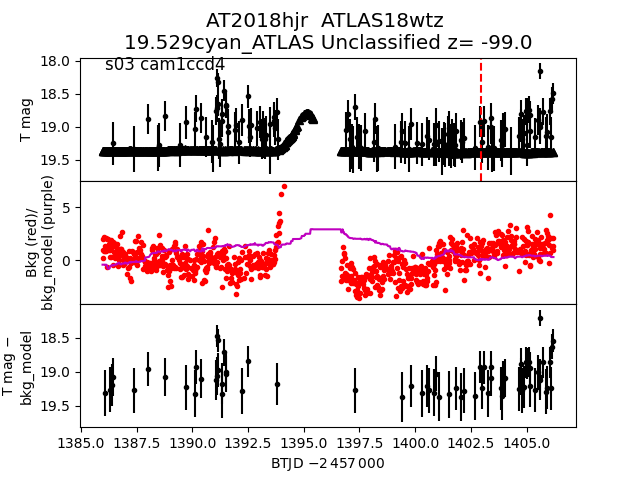
 2018hjr
 2018gty
 2018gxi
 2018hdo
 2018hkb
 2018har
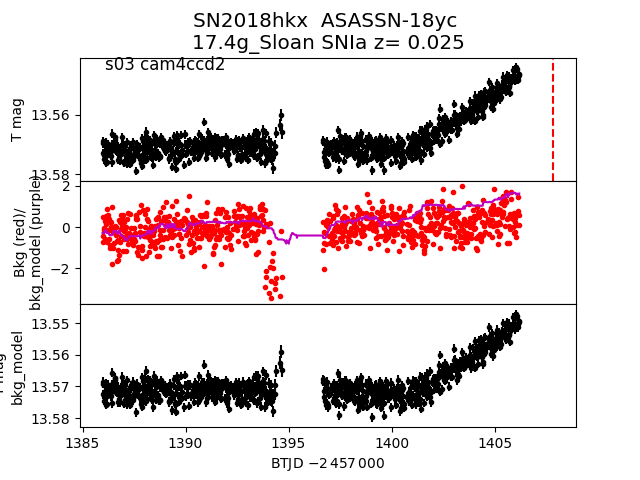
 2018hkx
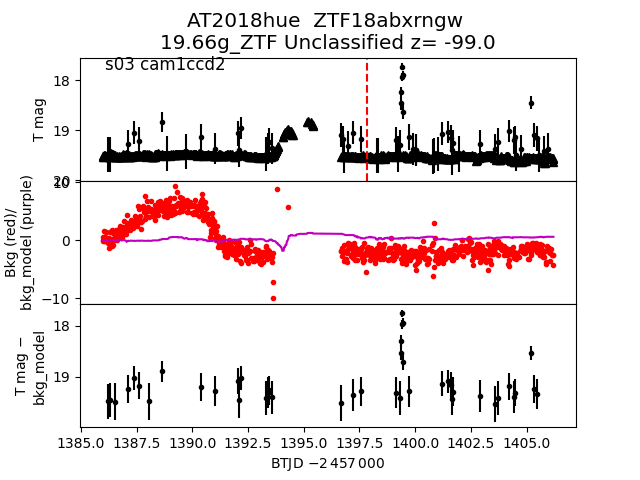
 2018hue
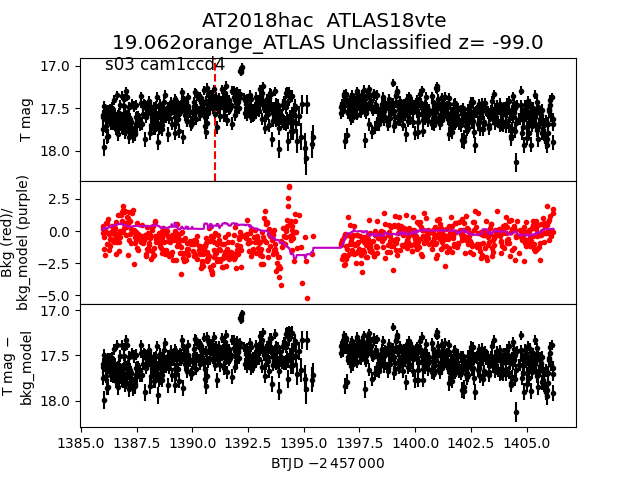
 2018hac
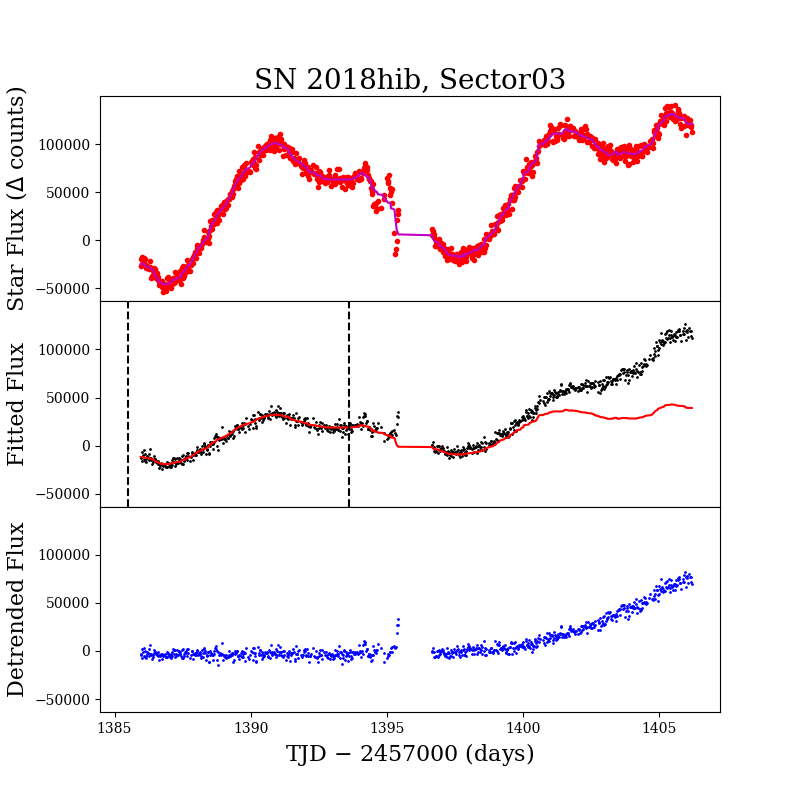
 2018hib_detrended
 2018hbw
 2018hgc
 2018hks
 2018hib
 2018gum
 2018hib
 2018hgi
 2018hlp
 2018has
 2018hjo
 2018hgl
 2018hdq