all transients in sector02 (30 total)
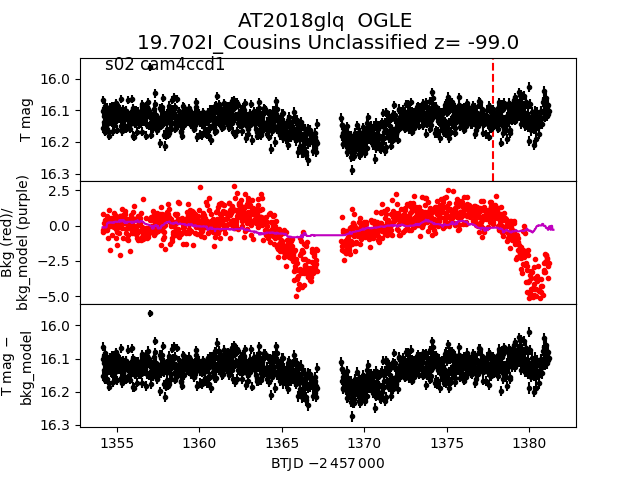
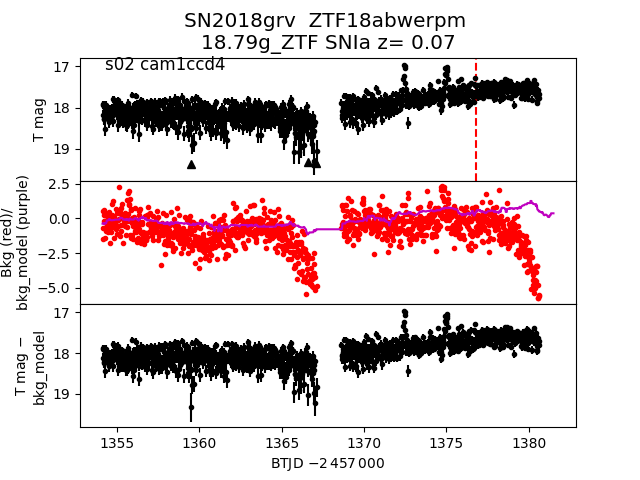
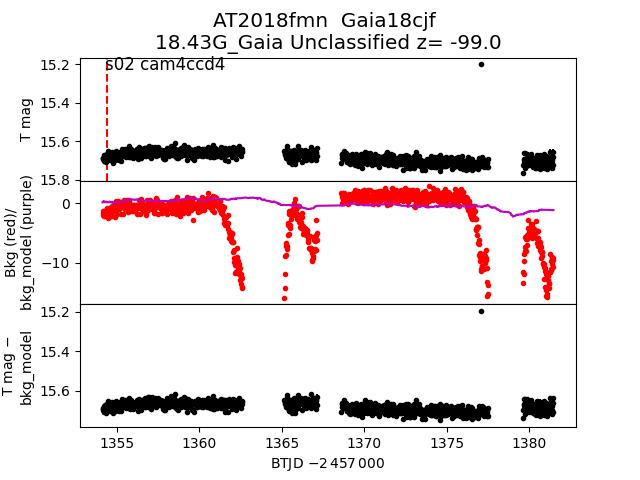
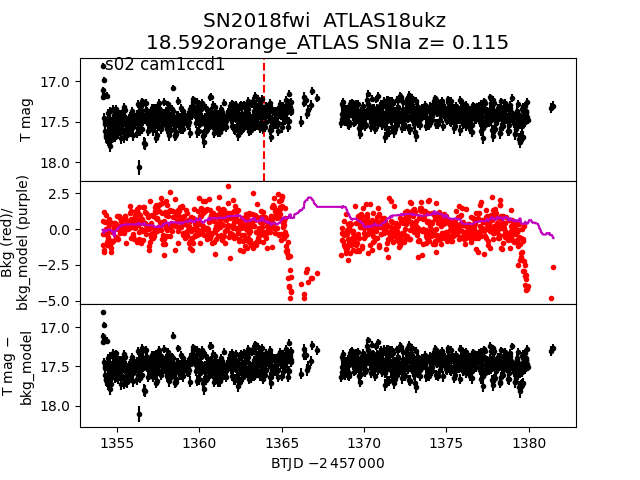
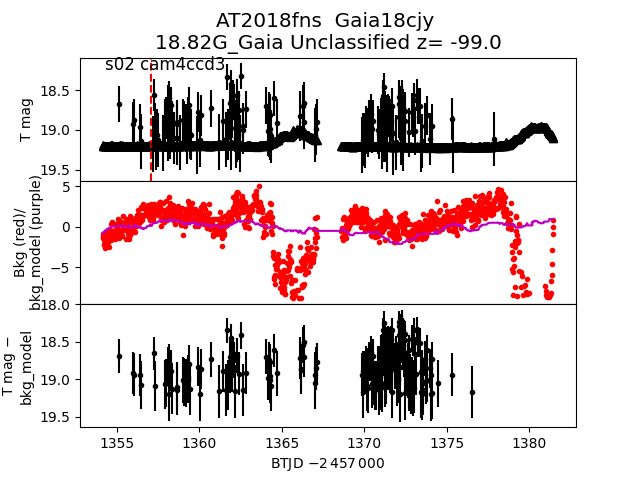
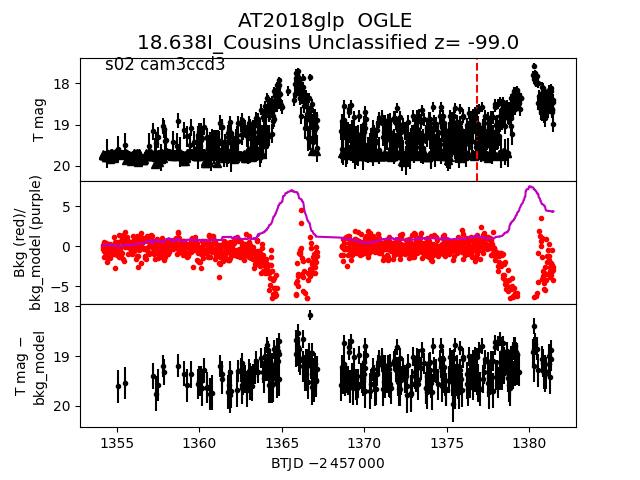
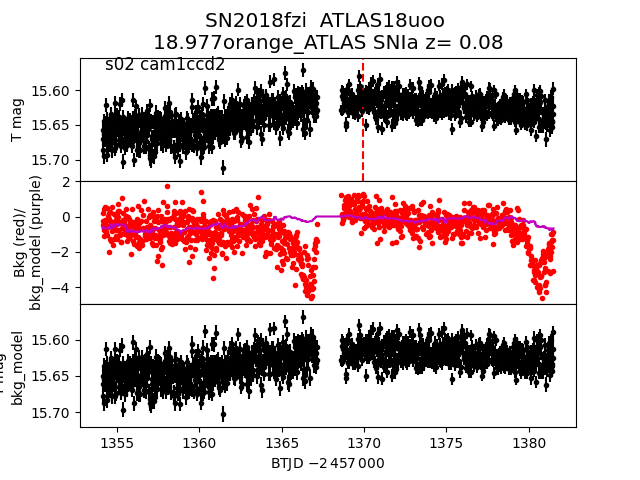
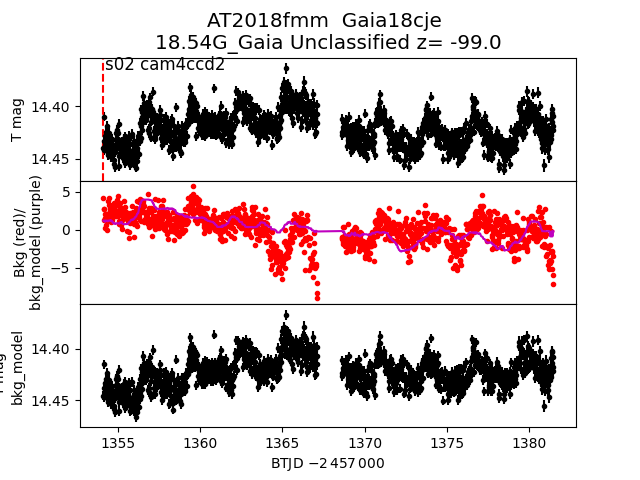
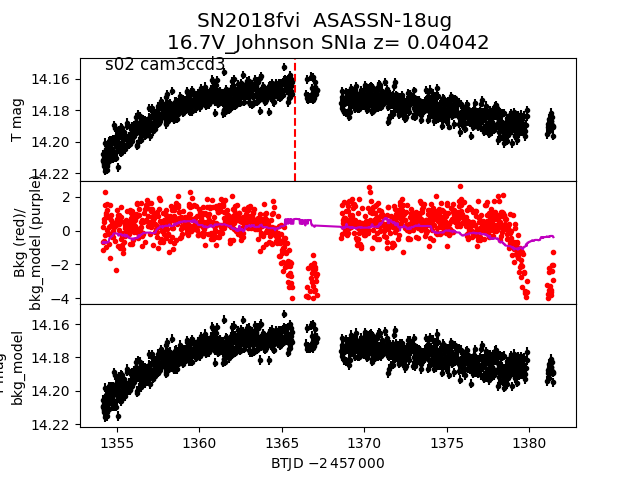
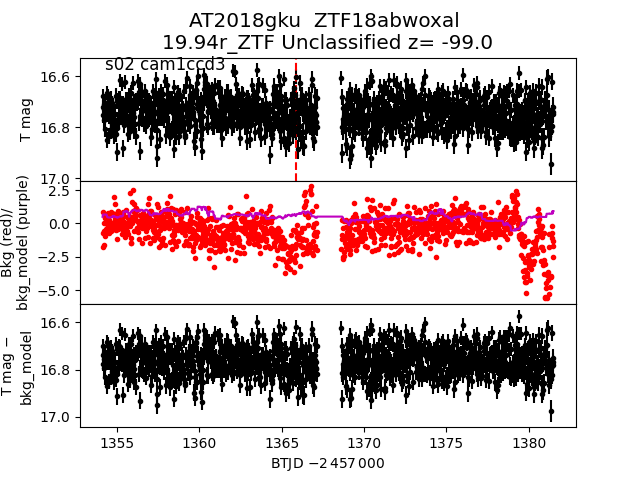
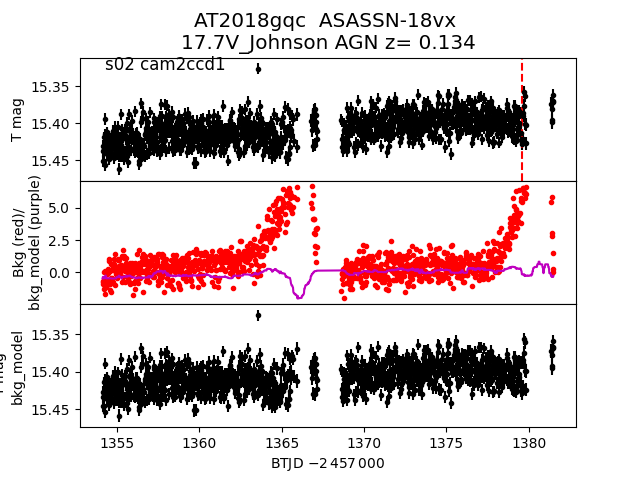
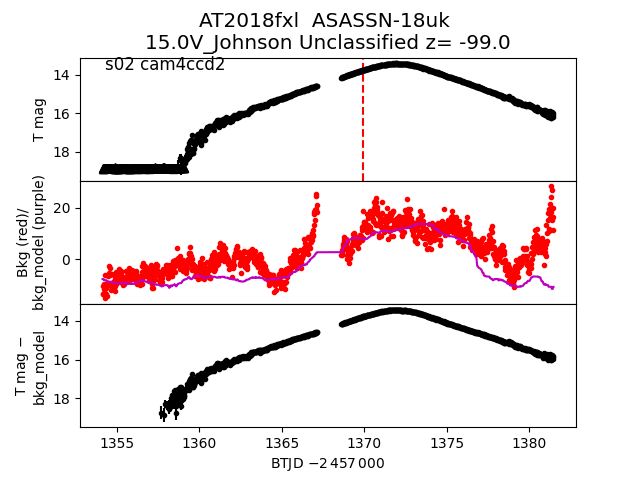
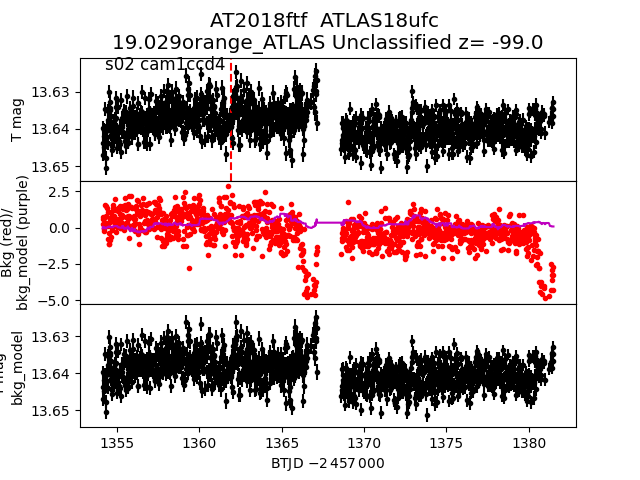
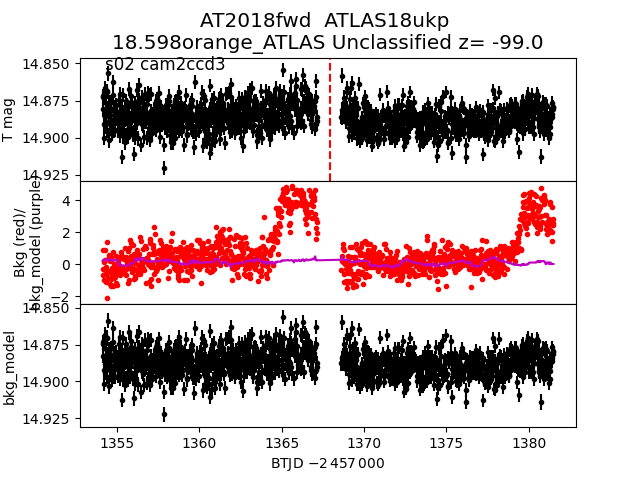
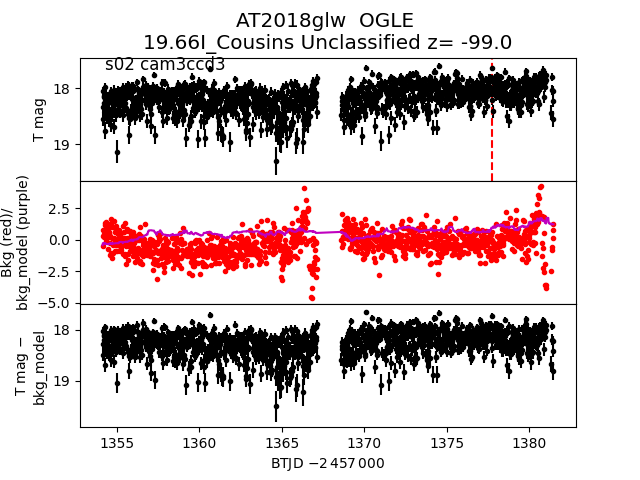
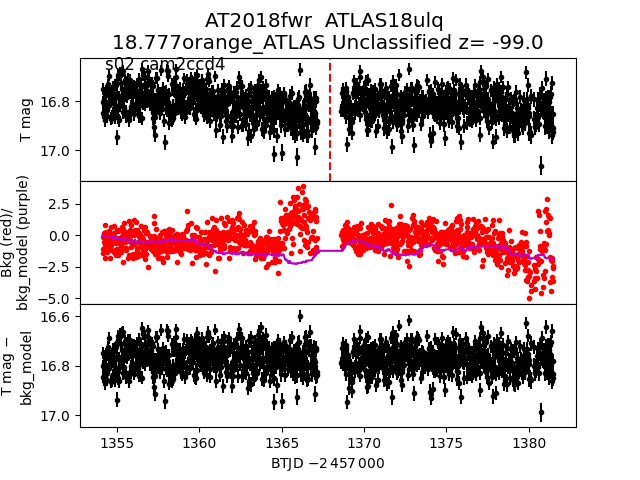
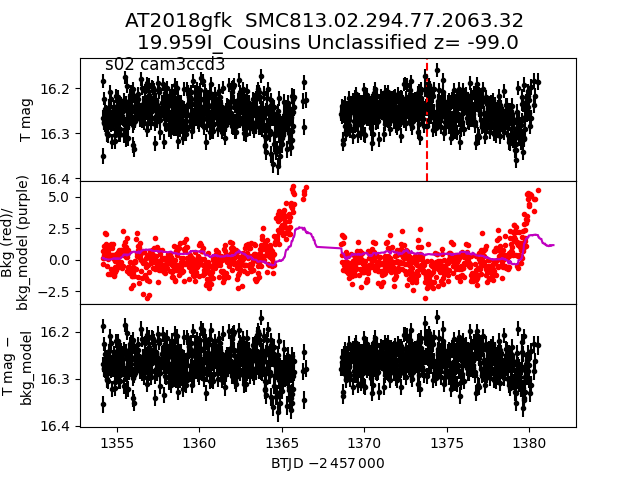
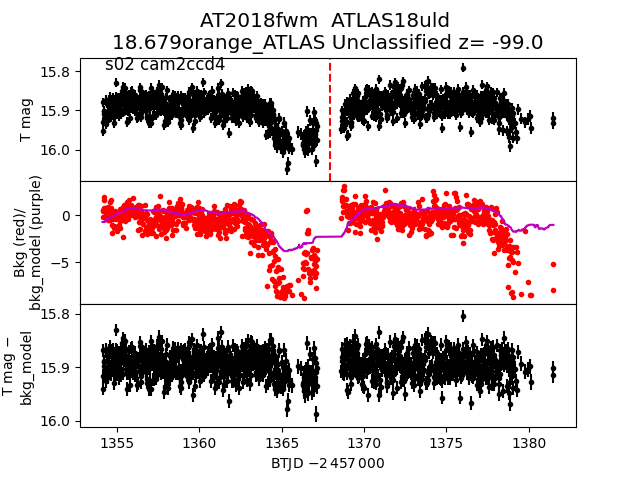
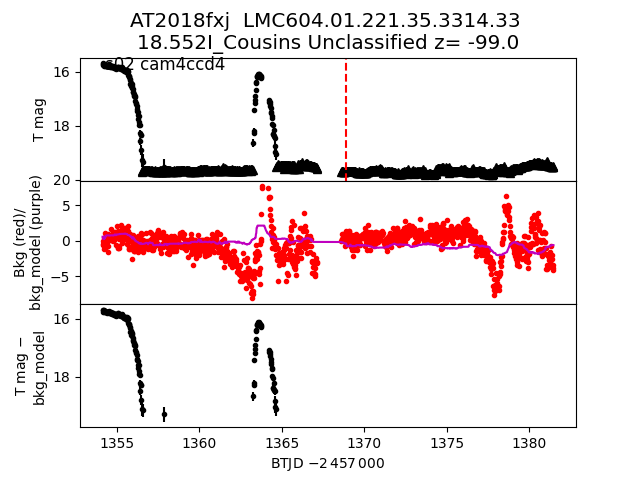
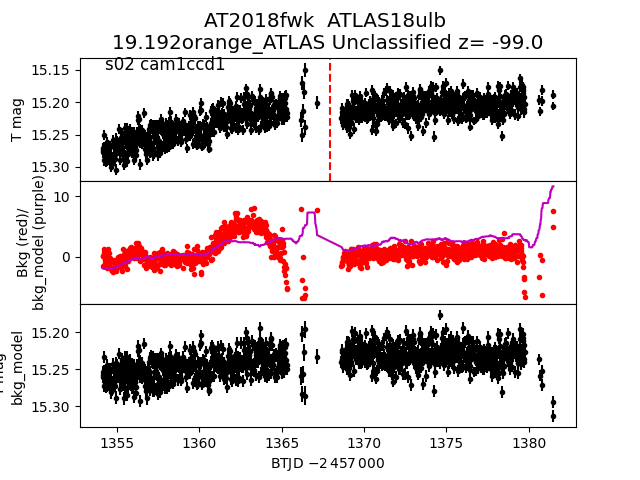
Each figure has three panels. The top panel shows the transient light curve, the middle panel shows the local background (estimated in an annulus), and the bottom panel shows a "background-model corrected" light curve. Details about the background model are in the README.
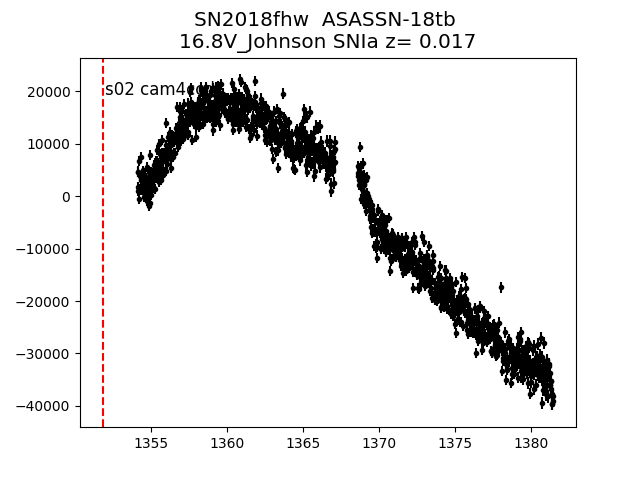
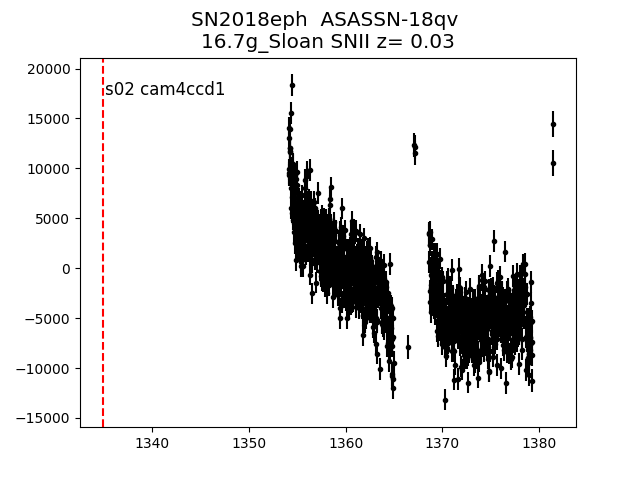
The vertical red line marks the time of discovery reported to TNS. Other useful metadata from TNS is in the figure title.
Note that the top and bottom panel are in magnitudes, while the middle panel is in differential flux units. The magnitudes are calibrated to the flux in the reference image used for image subtraction. Thus, flux from the host galaxy is included in these magnitudes.
3-sigma upper limits are plotted as triangles with no errorbars. A typical limiting magnitude is 19.6 in 30 minutes or 18.4 in 200 seconds (for low backgrounds).
The links allow you to download the light curve data as a text file.
More details in the README.
2018fub
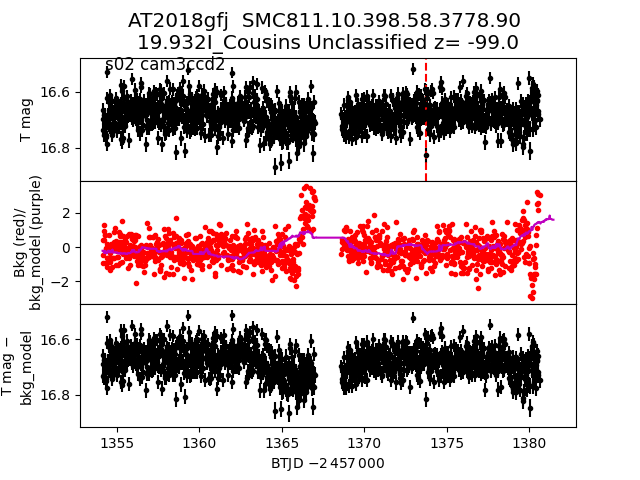
 2018gfj
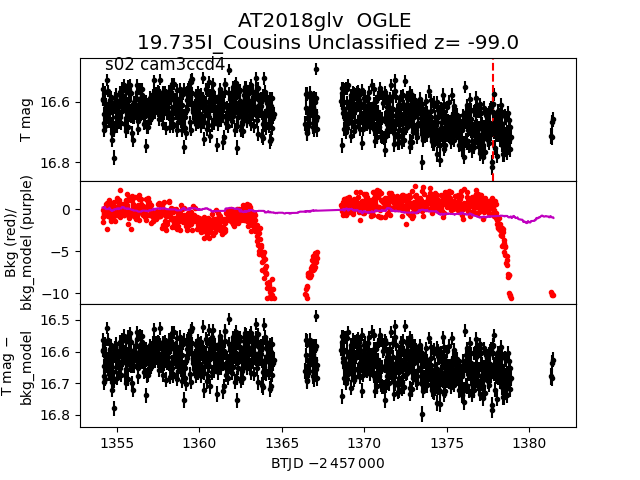
 2018glv
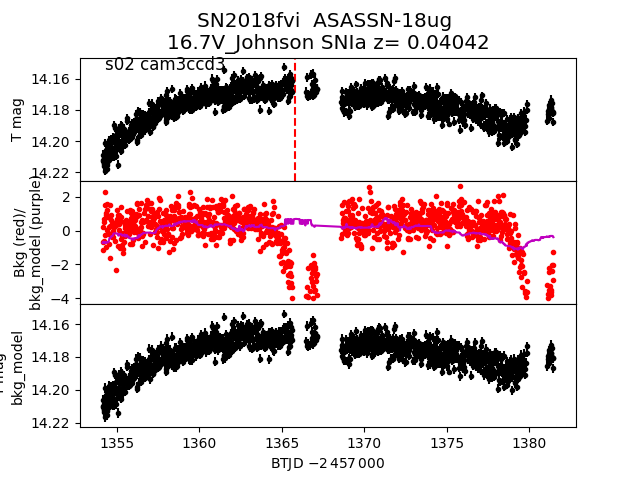
 2018fvi
 2018grv
 2018fmn
 2018fwi
 2018fns
 2018glp
 2018fzi
 2018fmm
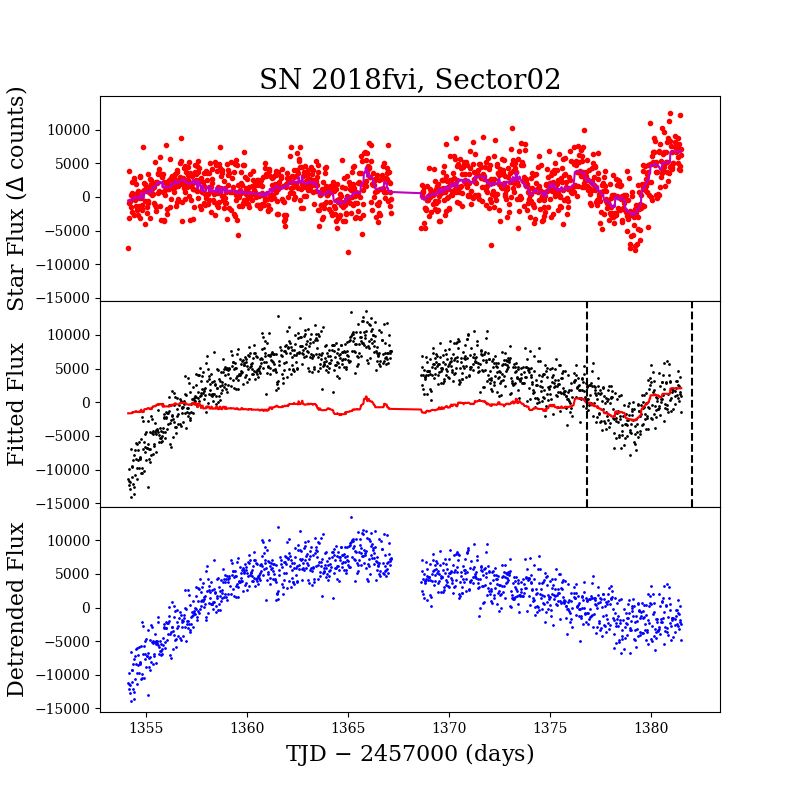
 2018fvi_detrended
 2018gku
 2018fhw
 2018fvi
 2018gqc
 2018fxl
 2018ftf
 2018fwd
 2018glw
 2018fwr
 2018eph
 2018gfk
 2018fwm
 2018fxj
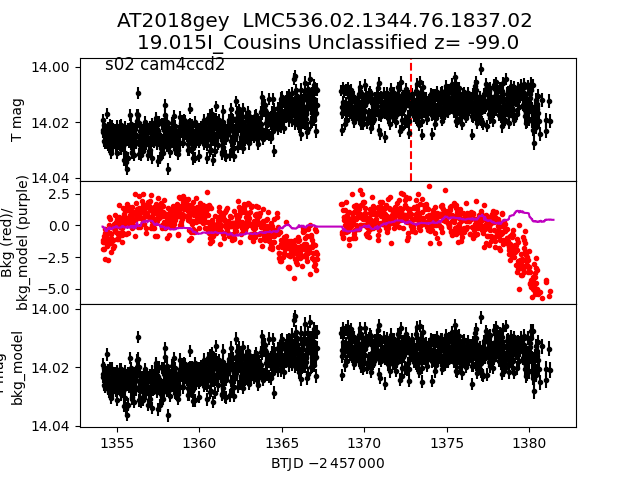
 2018gey
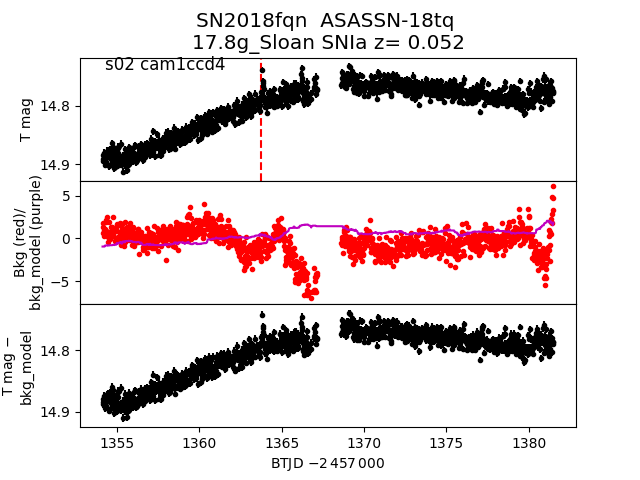
 2018fqn
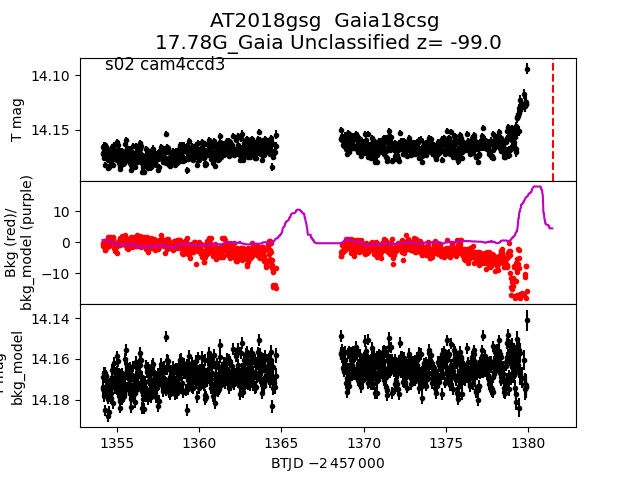
 2018gsg
 2018fwk
 2018glq