all transients in sector01 (29 total)
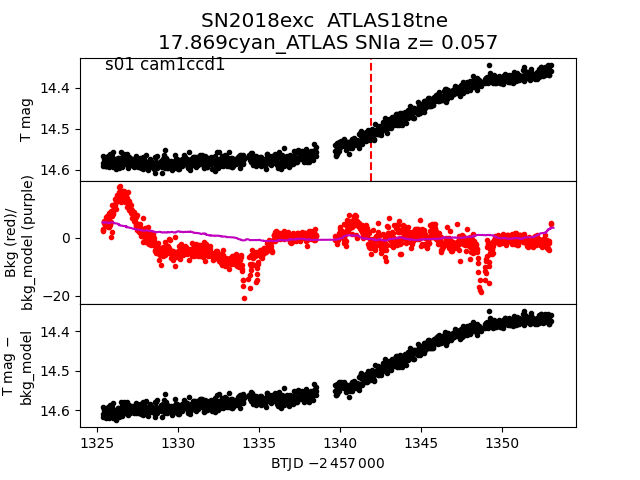
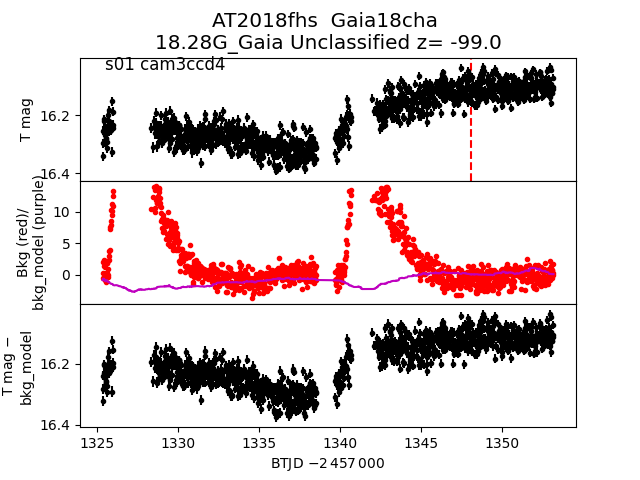
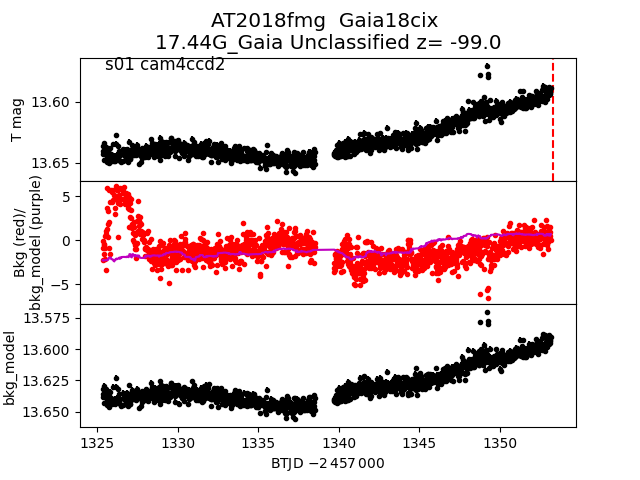
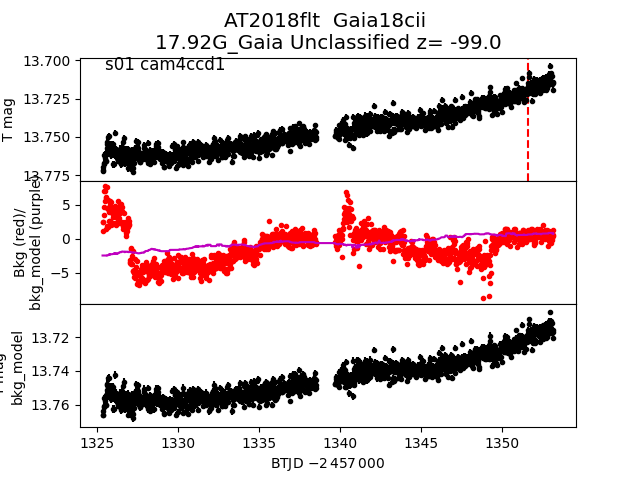
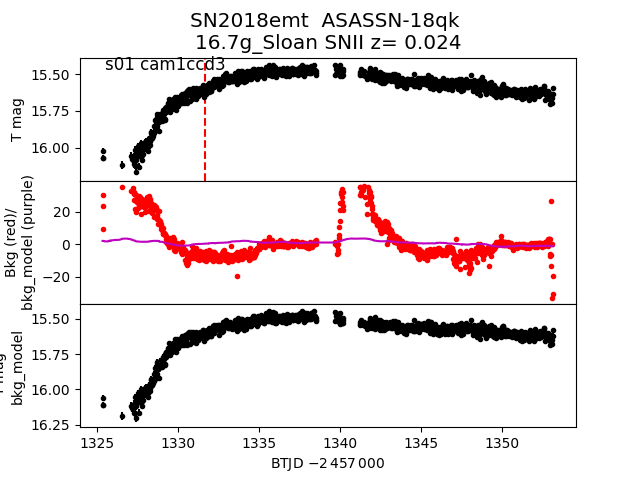
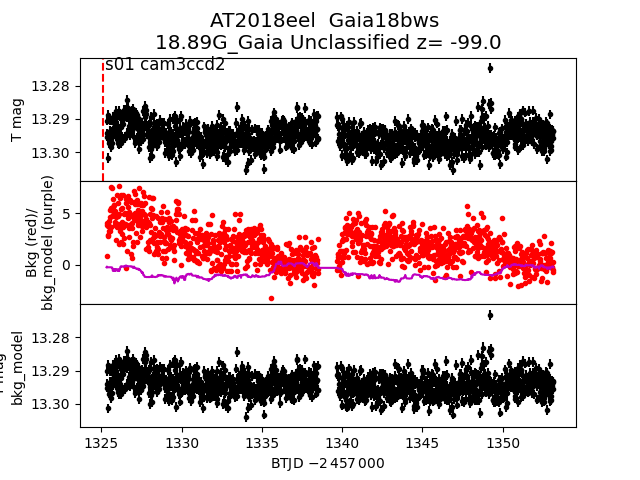
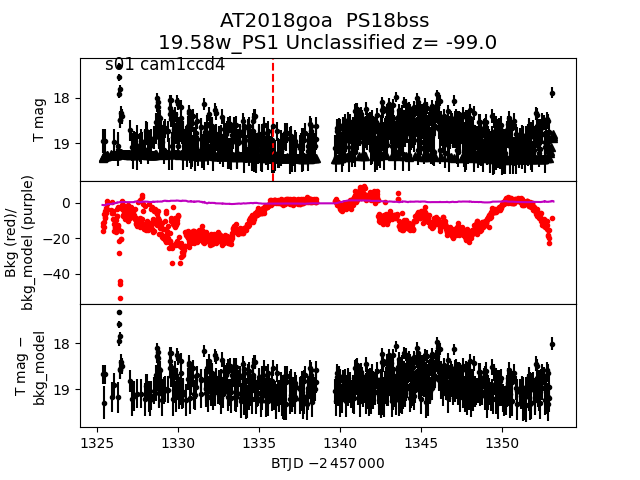
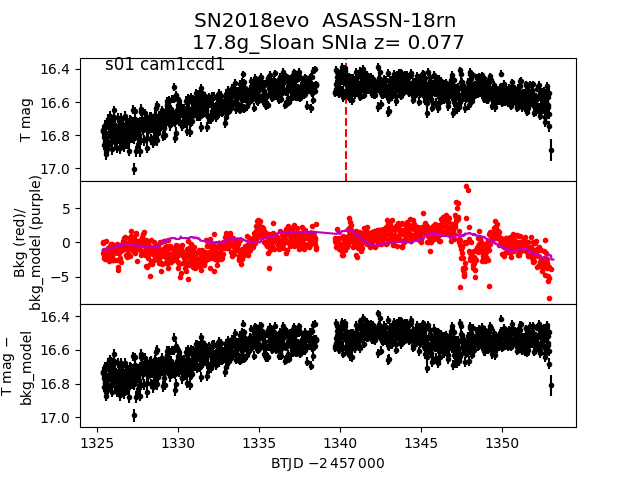
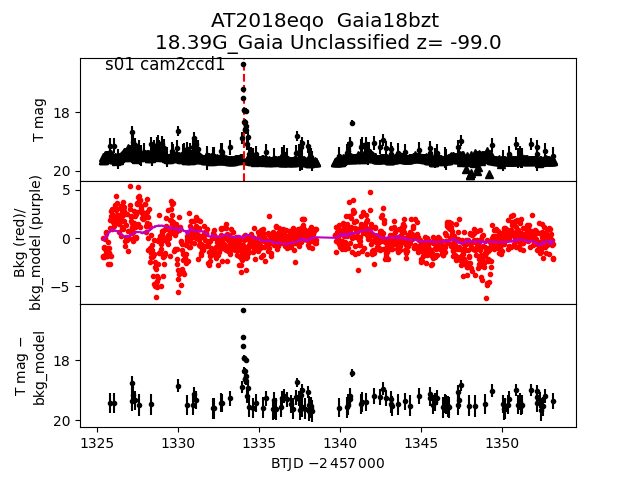
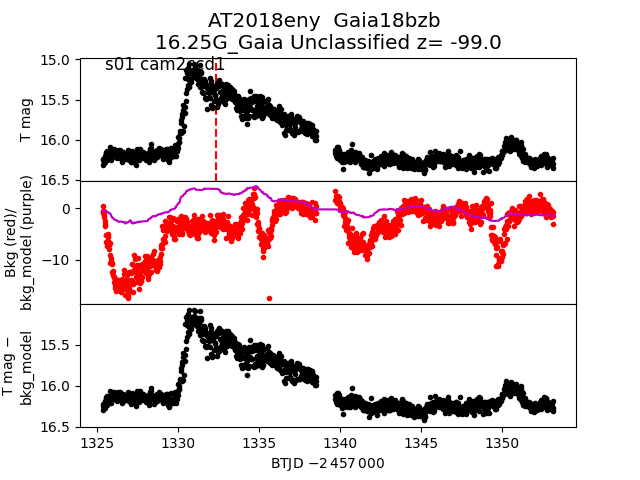
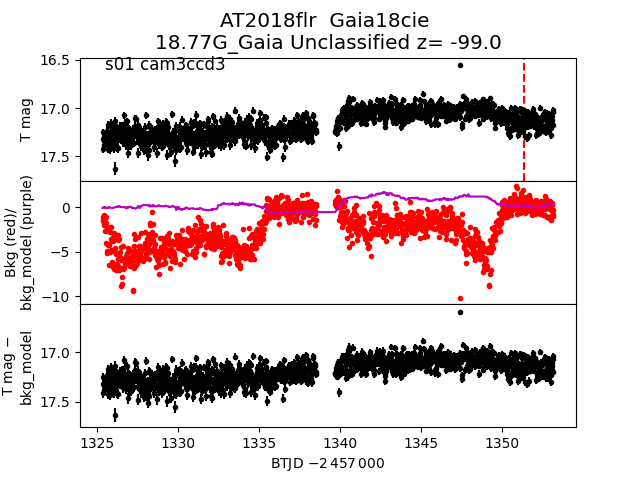
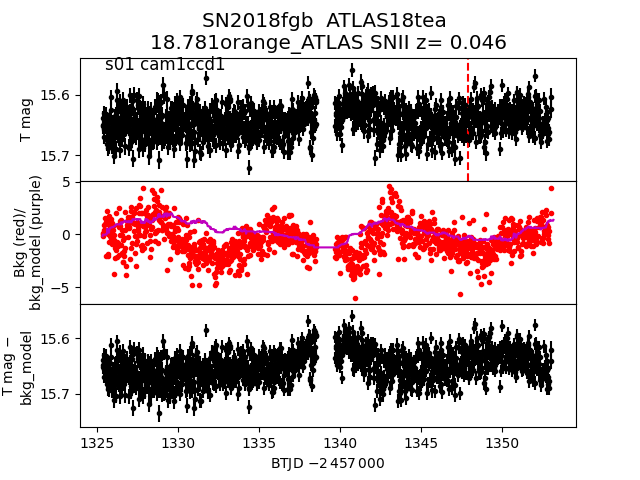
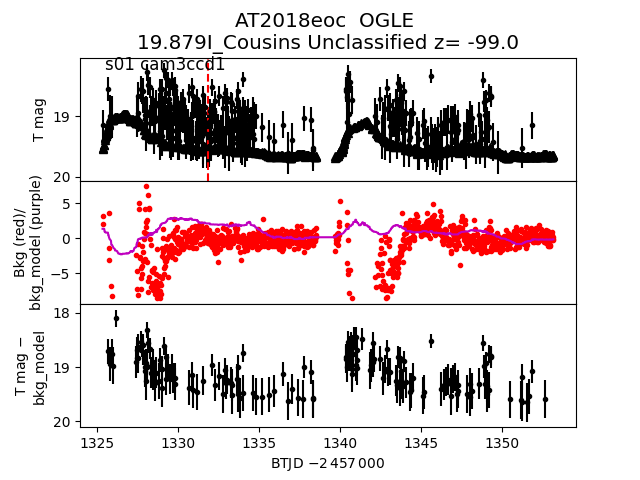
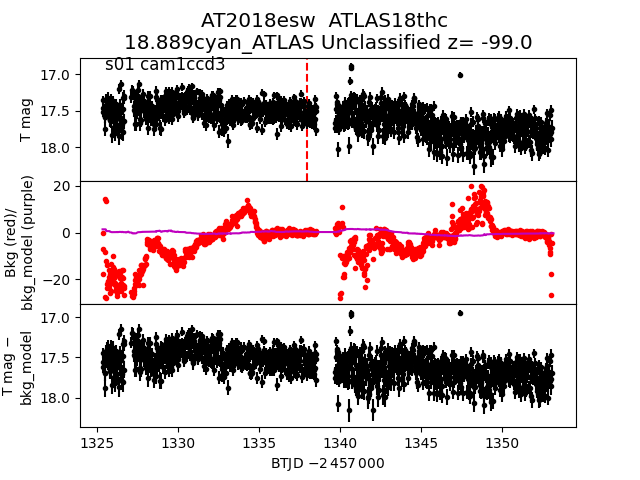
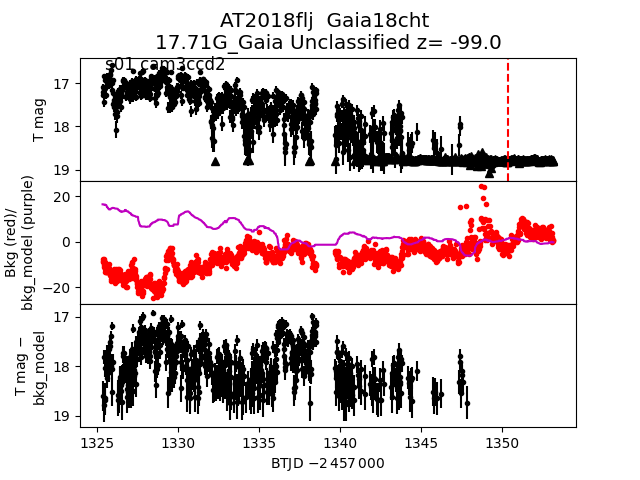
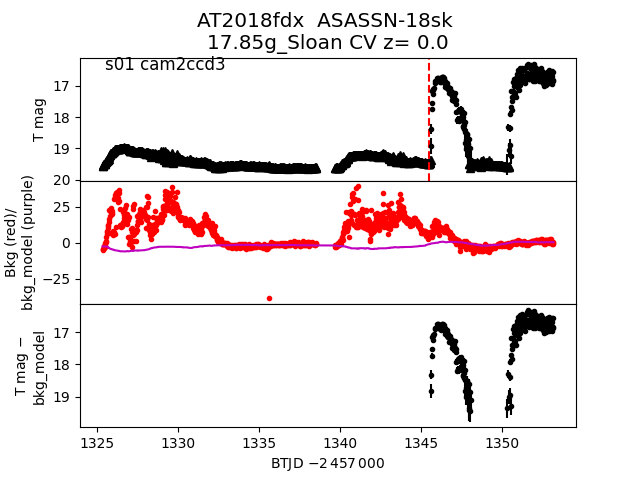
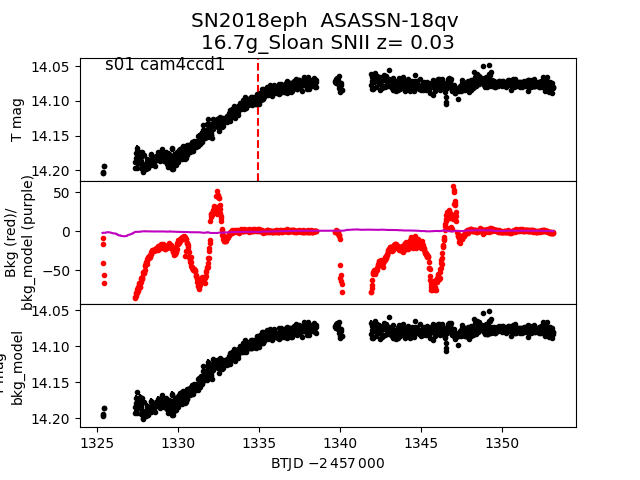
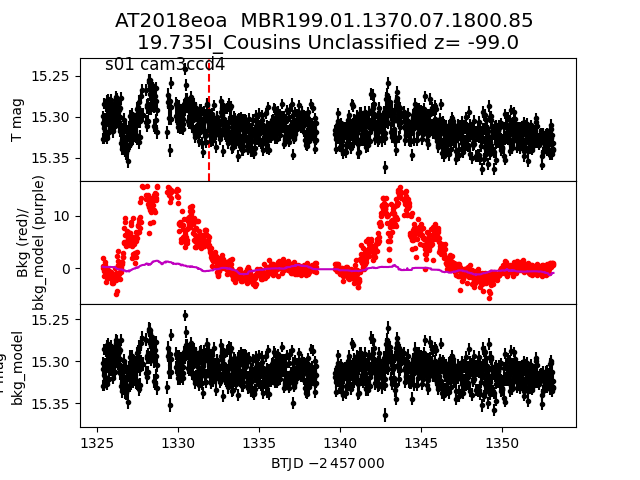
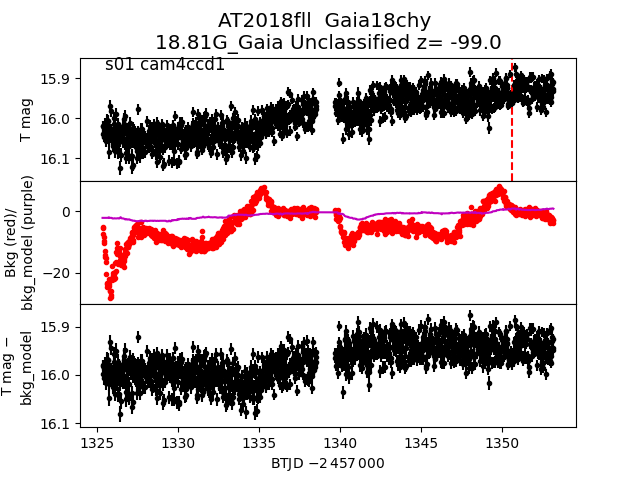
Each figure has three panels. The top panel shows the transient light curve, the middle panel shows the local background (estimated in an annulus), and the bottom panel shows a "background-model corrected" light curve. Details about the background model are in the README.
The vertical red line marks the time of discovery reported to TNS. Other useful metadata from TNS is in the figure title.
Note that the top and bottom panel are in magnitudes, while the middle panel is in differential flux units. The magnitudes are calibrated to the flux in the reference image used for image subtraction. Thus, flux from the host galaxy is included in these magnitudes.
3-sigma upper limits are plotted as triangles with no errorbars. A typical limiting magnitude is 19.6 in 30 minutes or 18.4 in 200 seconds (for low backgrounds).
The links allow you to download the light curve data as a text file.
More details in the README.
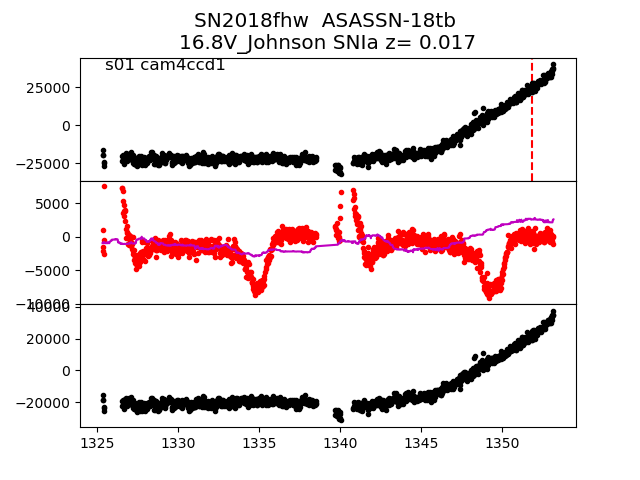
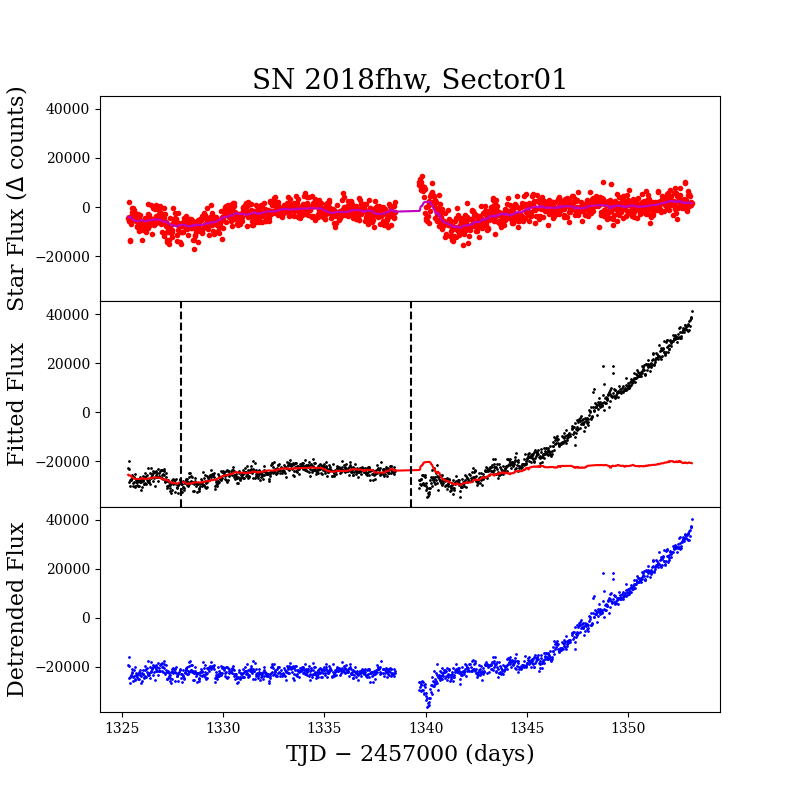
2018fhw_detrended
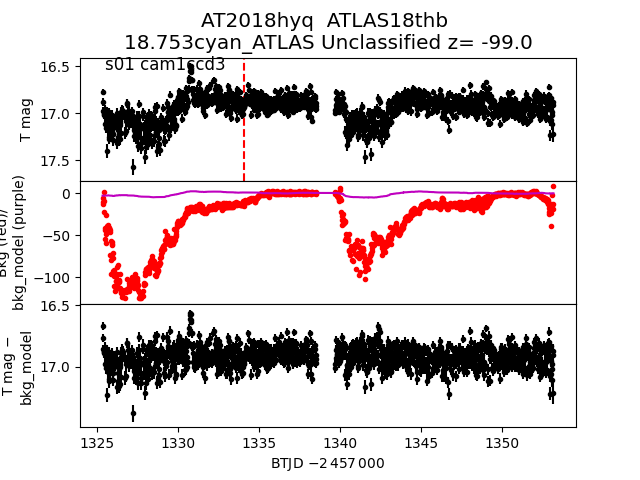
 2018hyq
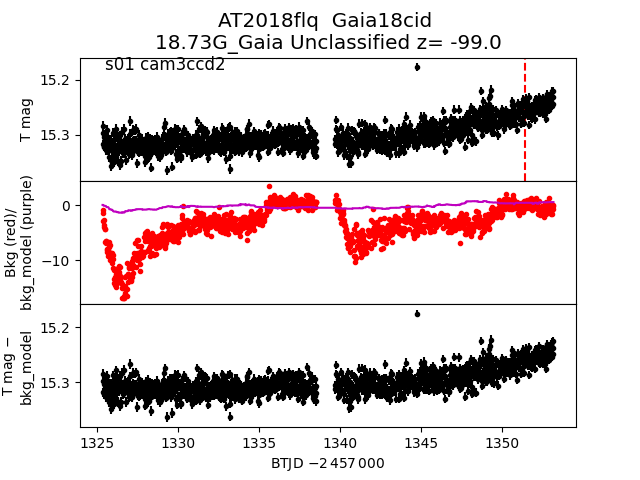
 2018flq
 2018fhs
 2018fmg
 2018flt
 2018emt
 2018eel
 2018goa
 2018evo
 2018eqo
 2018eny
 2018flr
 2018fgb
 2018eoc
 2018esw
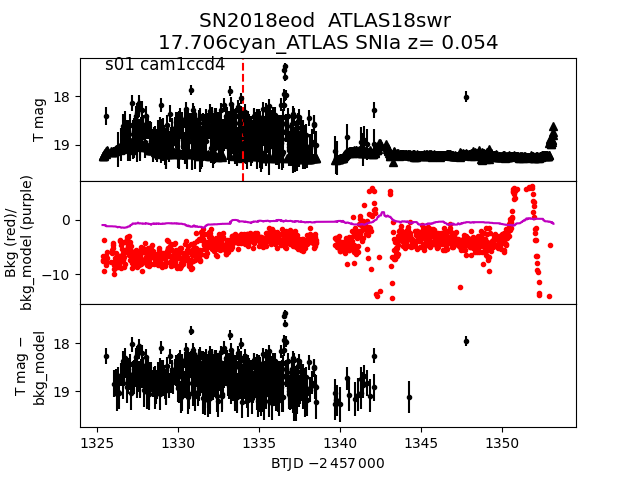
 2018eod
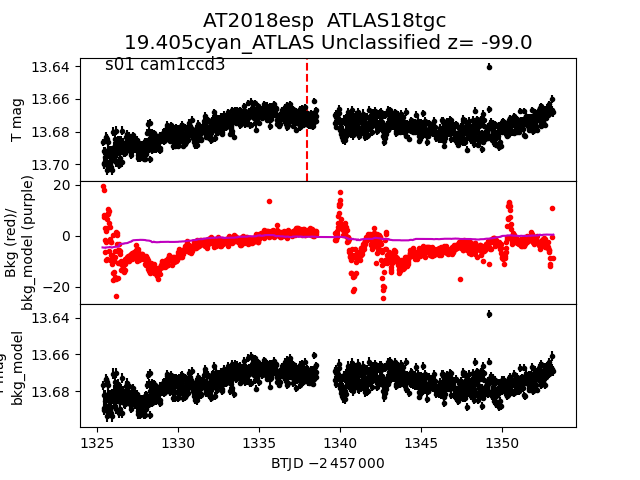
 2018esp
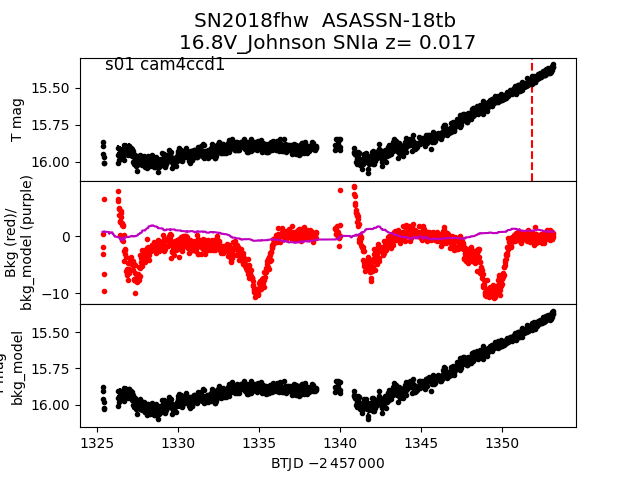
 2018fhw
 2018flj
 2018fhw
 2018fdx
 2018eph
 2018eoa
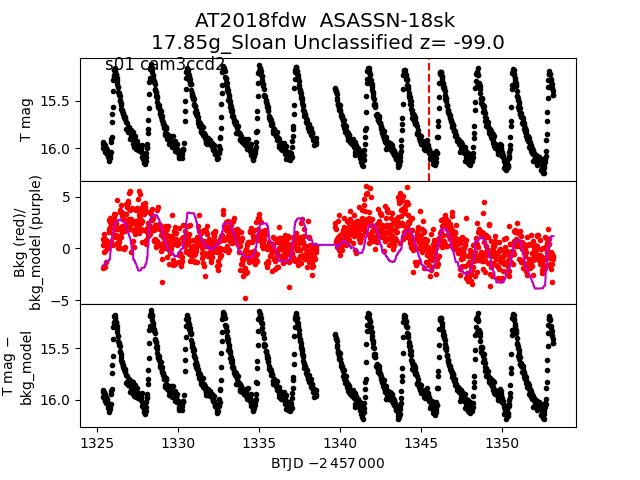
 2018fdw
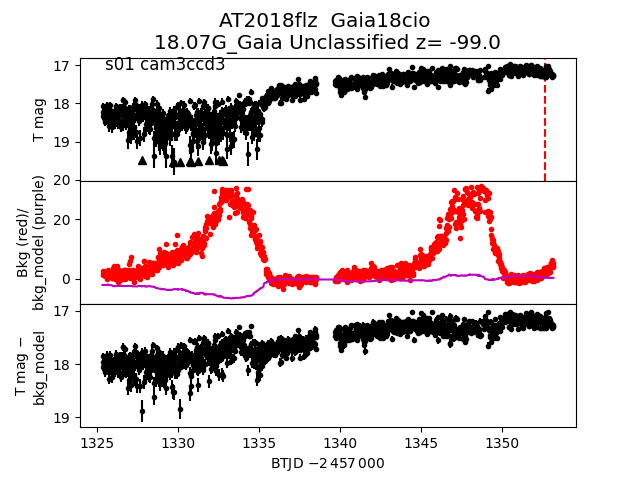
 2018flz
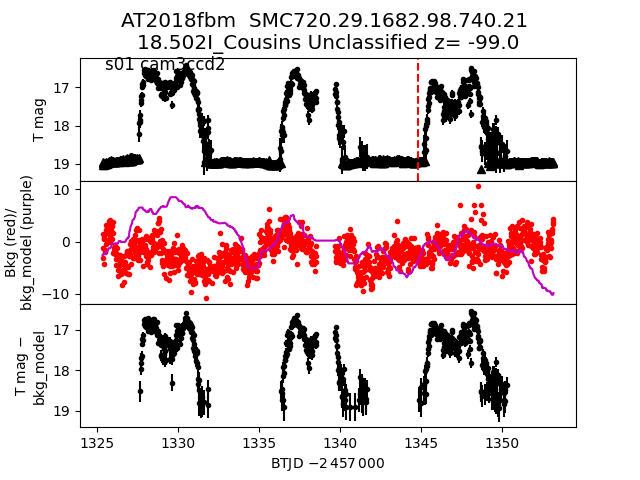
 2018fbm
 2018fll
 2018exc